
Journal of Geo-information Science >
Analysis on Spatio-temporal Patterns and Drivers of Poverty at Village Level based on PCA-GWR
Received date: 2019-06-10
Request revised date: 2019-11-22
Online published: 2020-04-13
Supported by
The National Science Fund for Distinguished Young Scholars(41725006)
Natural Science Foundation of Shandong Province(ZR2017MD003)
Copyright
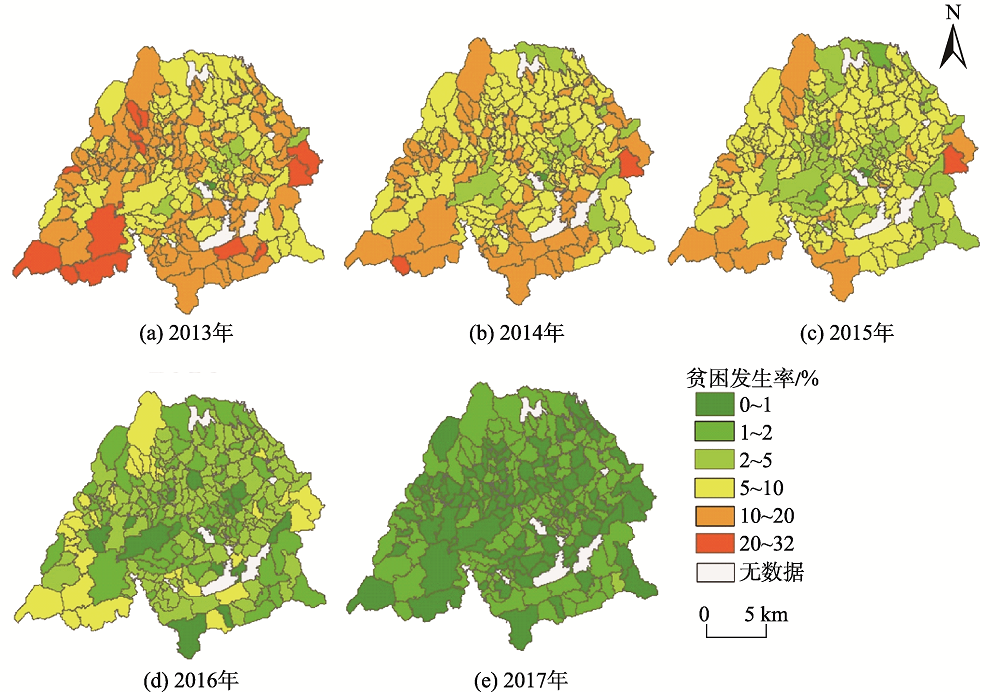
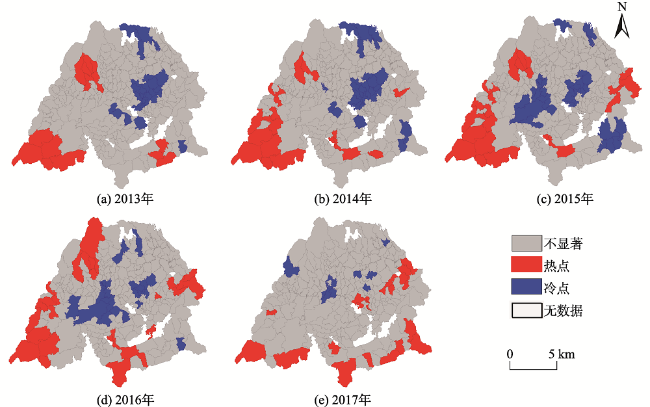
Exploring the spatio-temporal changes of poverty and identifying the factors that cause poverty can provide reference for the formulation and implementation of poverty alleviation policies.Poverty is caused by many factors. Geographically Weighted Regression model (GWR) can analyze the spatial differences in the influence of various factors on poverty,but there is a strong correlation between the factors causing poverty,which leadsto multicollinearity. Principal Component-based Geographic Weighted Regression method (PCA-GWR) is usedin this paper by combining the natural, economic and social attributes toanalyze the characteristics of the spatial pattern of poverty.In order to explore the spatio-temporal changes of poverty, this paper analyzes the temporal and spatial patterns of village-level poverty incidence from 2013 to 2017. Spatial autocorrelation analysis was performed using global Moran's I index and local G coefficientrespectively.Selecting Yongxin County of Jiangxi Province as the research area, the results show that: (1) There is a high correlation between independent variables affecting poverty. When these variables are put together in GWR model, the multicollinearity problem is easy to occur, and the results of GWRanalysis are not reliable. In order to eliminate the multicollinearity problem, Principal Component Analysis (PCA) was performed on the variables that were significantly correlated with the dependent variables. Three principal components were extracted by principal component analysis, including self-development ability of rural subjects, topographic and vegetation index. The Variance Inflation Factors(VIF)value of the variable in the PCA-GWR model is significantly lower than that in the GWR model. The PCA-GWR model effectively solves the multicollinearity problem in the GWR model. (2) The result of PCA-GWR found that the poverty in Yongxin County is the result of the combination of natural factors such as topographic factors and vegetation distribution and the self-development ability of rural subjects such as low-education, lack of labor, disease. And the effects of these factors presented different spatial patterns. This can provide a reference for the formulation of government poverty alleviation policies. (3) From 2013 to 2017, the incidence of poverty in Yongxin County decreased from 11.27% to 0.97%, showing a downward trend year by year, and the poverty gap between villages decreased year by year. The incidence of poverty from 2013 to 2015 was high in the west and low in the east. The overall value in 2016 and 2017 was low. (4) From the perspective of spatial correlation: on the whole, the spatial correlation between 2013 and 2016 is positive, and it is randomly distributed in 2017; Locally, the distribution of cold and hot spots did not change much from 2013 to 2016, the cold spots were distributed in the middle, and the hot spots were concentrated in the southwest. In 2017, hot spots are distributed in the south, and cold spots are scattered in the north.
LUO Yaowen , REN Zhoupeng , GE Yong , HAN Litao , LIU Mengxiao , HE Yawen . Analysis on Spatio-temporal Patterns and Drivers of Poverty at Village Level based on PCA-GWR[J]. Journal of Geo-information Science, 2020 , 22(2) : 231 -245 . DOI: 10.12082/dqxxkx.2020.190286
表1 2013年永新县贫困指标与贫困发生率相关程度分析Tab. 1 Analysis of the correlation between poverty indicators and poverty incidence in Yongxin County in 2013 |
| 贫困维度 | 贫困指标 | Pearson相关系数 | 相关性程度 |
|---|---|---|---|
| 自然因素 | 高程 | 0.289** | 显著弱相关 |
| NDVI | 0.282** | 显著弱相关 | |
| 坡度 | 0.031 | 不显著 | |
| 坡度>8°面积占比 | 0.214** | 显著弱相关 | |
| 社会因素 | 疾病 | 0.711** | 显著强相关 |
| 到最近镇驻地距离 | -0.083 | 不显著 | |
| 缺乏劳动力 | 0.887** | 显著极强相关 | |
| 夜间灯光 | -0.173** | 显著极弱相关 | |
| 低学历 | 0.986** | 显著极强相关 | |
| 经济因素 | 人均收入 | 0.107 | 不显著 |
注:**指0.01水平上显著;根据相关系数得分,分为极强相关(0.8, 1]、强相关(0.6, 0.8]、中等程度相关(0.4, 0.6]、弱相关(0.2, 0.4]、极弱相关[0, 2]。 |
表2 2013年永新县贫困指标的相关性分析Tab. 2 Correlation analysis of poverty indicatorsin Yongxin County in 2013 |
| 疾病 | 缺乏劳动力 | 低学历 | 坡度>8°面积占比 | 高程 | NDVI | |
|---|---|---|---|---|---|---|
| 疾病 | 1.000 | 0.786** | 0.737** | 0.149* | 0.164* | 0.159* |
| 缺乏劳动力 | 0.786** | 1.000 | 0.912** | 0.229** | 0.291** | 0.297** |
| 低学历 | 0.737** | 0.912** | 1.000 | 0.194** | 0.268** | 0.281** |
| 坡度>8°面积占比 | 0.149* | 0.229** | 0.194** | 1.000 | 0.686** | 0.397** |
| 高程 | 0.164* | 0.291** | 0.268** | 0.686** | 1.000 | 0.689** |
| NDVI | 0.159* | 0.297* | 0.281* | 0.397** | 0.689** | 1.000 |
注:**表示相关性在0.01上显著;* 表示相关性在0.05上显著。 |
表3 2013年永新县贫困指标的主成分分析Tab. 3 Principal component analysis of poverty indicatorsin Yongxin County in 2013 |
| 主成分 | 特征值 | 贡献率% | 累计贡献率% |
|---|---|---|---|
| 第一主成分 | 3.127 | 52.124 | 52.124 |
| 第二主成分 | 1.701 | 28.352 | 80.476 |
| 第三主成分 | 0.605 | 10.088 | 90.564 |
| 第四主成分 | 0.278 | 4.634 | 95.198 |
| 第五主成分 | 0.206 | 3.428 | 98.626 |
| 第六主成分 | 0.082 | 1.374 | 100 |
表4 2013年永新县各主成分的特征向量Tab. 4 Eigenvectors of each principal componentin Yongxin County in 2013 |
| 原始变量 | 第一主成分 | 第二主成分 | 第三主成分 |
|---|---|---|---|
| 疾病 | 0.619 | -0.005 | 0.094 |
| 缺乏劳动力 | 0.534 | 0.127 | 0.139 |
| 低学历 | 0.525 | 0.128 | 0.091 |
| 坡度>8°面积占比 | 0.055 | 0.136 | 1.232 |
| 高程 | 0.070 | 0.504 | 0.843 |
| NDVI | 0.078 | 0.728 | 0.235 |
表5 GWR模型贫困指标的局部VIF值统计Tab. 5 Local VIF statistics of poverty indicators of the GWR model |
| VIF统计 | 低学历 | 疾病 | 缺乏劳动力 | 高程 | NDVI | 坡度>8°面积占比 |
|---|---|---|---|---|---|---|
| VIF均值 | 4.94 | 2.53 | 6.05 | 3.16 | 2.02 | 2.01 |
| VIF最大值 | 7.32 | 3.64 | 8.69 | 3.86 | 2.30 | 2.55 |
| VIF最小值 | 3.66 | 2.08 | 4.51 | 2.58 | 1.78 | 1.55 |
表6 PCA-GWR模型各主成分的局部VIF统计Tab. 6 Local VIF statistics of the principal components of the PCA-GWR model |
| VIF统计 | 第一主成分 | 第二主成分 | 第三主成分 |
|---|---|---|---|
| VIF均值 | 1.02 | 1.03 | 1.03 |
| VIF最大值 | 1.06 | 1.15 | 1.19 |
| VIF最小值 | 1.00 | 1.00 | 1.00 |
表7 永新县村级贫困发生率全局自相关结果Tab. 7 Global autocorrelation results of the poverty incidence at village level in Yongxin County |
| 年份 | Moran's I | z值 | p值 |
|---|---|---|---|
| 2013 | 0.343 | 8.878 | 0.001 |
| 2014 | 0.288 | 7.487 | 0.001 |
| 2015 | 0.347 | 8.737 | 0.001 |
| 2016 | 0.248 | 6.269 | 0.001 |
| 2017 | -0.014 | 0.392 | -0.308 |
图7 2013—2017年永新县村级贫困发生率局部空间自相关结果Fig. 7 Results of local spatial autocorrelation of poverty incidence at village level in Yongxin county from 2013 to 2017 |
表8 2013—2017年永新县村级贫困发生率冷热点个数Tab. 8 Number of cold and hot spots of poverty incidence at village level in Yongxin county from 2013 to 2017 |
| 年份 | 热点个数 | 冷点个数 | 不显著个数 |
|---|---|---|---|
| 2013 | 16 | 31 | 185 |
| 2014 | 19 | 33 | 180 |
| 2015 | 23 | 36 | 173 |
| 2016 | 28 | 26 | 178 |
| 2017 | 22 | 11 | 199 |
| [1] |
联合国2030可持续发展目标[EB/OL]. https://sustainabledevelopment.un.org/?menu=130
[ United Nations 2030 sustainable development goals[EB/OL]. https://sustainabledevelopment.un.org/?menu=130
|
| [2] |
丁建军, 冷志明 . 区域贫困的地理学分析[J]. 地理学报, 2018,73(2):232-247.
[
|
| [3] |
刘艳华, 徐勇 . 中国农村多维贫困地理识别及类型划分[J]. 地理学报, 2015,70(6):993-1007.
[
|
| [4] |
王艳慧, 钱乐毅, 段福洲 . 县级多维贫困度量及其空间分布格局研究——以连片特困区扶贫重点县为例[J]. 地理科学, 2013,33(12):1489-1497.
[
|
| [5] |
邹薇, 方迎风 . 怎样测度贫困:从单维到多维[J]. 国外社会科学, 2012,2(7):63-69.
[
|
| [6] |
贾林瑞, 刘彦随, 刘继来 , 等. 中国集中连片特困地区贫困户致贫原因诊断及其帮扶需求分析[J]. 人文地理, 2018,33(1):85-93.
[
|
| [7] |
李平 . 东北贫困区多维致贫因素评价及实证分析[J]. 统计与决策, 2019,35(7):93-96.
[
|
| [8] |
张琦, 陈伟伟 . 连片特困地区扶贫开发成效多维动态评价分析研究——基于灰色关联分析法角度[J]. 云南民族大学学报(哲学社会科学版), 2015,32(1):136-142.
[
|
| [9] |
毛婧瑶, 葛咏, 赵中秋 , 等. 武陵山贫困片区扶贫成效评价与空间格局分析[J]. 地球信息科学学报, 2016,18(3):334-342.
[
|
| [10] |
陈烨烽, 王艳慧, 王小林 . 中国贫困村测度与空间分布特征分析[J]. 地理研究, 2016,35(12):2298-2308.
[
|
| [11] |
袁媛, 伍彬, 古叶恒 . 重庆市城市贫困空间特征和影响因素研究——兼论东西部城市的异同[J]. 人文地理, 2015,30(1):70-77.
[
|
| [12] |
文琦, 施琳娜, 马彩虹 等. 黄土高原村域多维贫困空间异质性研究——以宁夏彭阳县为例[J]. 地理学报, 2018,73(10):1850-1864.
[
|
| [13] |
徐孝勇, 封莎 . 中国14个集中连片特困地区自我发展能力测算及时空演变分析[J]. 经济地理, 2017,37(11):151-160.
[
|
| [14] |
童新华, 梁俏, 韦燕飞 . 广西县域贫困空间格局及影响因素分析[J]. 农村经济与科技, 2018,29(13):1-6.
[
|
| [15] |
王永明, 王美霞, 吴殿廷 , 等. 贵州省乡村贫困空间格局与形成机制分析[J]. 地理科学, 2017,37(2):217-227.
[
|
| [16] |
丁建军 . 中国11个集中连片特困区贫困程度比较研究——基于综合发展指数计算的视角[J]. 地理科学, 2014,34(12):1418-1427.
[
|
| [17] |
周蕾, 熊礼阳, 王一晴 , 等. 中国贫困县空间格局与地形的空间耦合关系[J]. 经济地理, 2017,37(10):157-166.
[
|
| [18] |
迟瑶, 王艳慧, 房娜 . 连片特困区贫困县农村基本公共服务与县域经济时空格局演变关系研究[J]. 地理研究, 2016,35(7):1243-1258.
[
|
| [19] |
罗庆, 樊新生, 高更和 , 等. 秦巴山区贫困村的空间分布特征及其影响因素[J]. 经济地理, 2016,36(4):126-132.
[
|
| [20] |
黄国勇, 张敏, 夏咏 , 等. 新疆边境贫困县自然地理环境影响因素实证分析[J]. 干旱区地理, 2015,38(4):814-820.
[
|
| [21] |
陈烨烽, 王艳慧, 赵文吉 , 等. 中国贫困村致贫因素分析及贫困类型划分[J]. 地理学报, 2017,72(10):1827-1844.
[
|
| [22] |
武鹏, 李同昇, 李卫民 . 县域农村贫困化空间分异及其影响因素——以陕西山阳县为例[J]. 地理研究, 2018,37(3):593-606.
[
|
| [23] |
马雄威 . 线性回归方程中多重共线性诊断方法及其实证分析[J]. 华中农业大学学报(社会科学版), 2008(2):78-81,85.
[
|
| [24] |
李平 . 东北贫困区多维致贫因素评价及实证分析[J]. 统计与决策, 2019,35(7):93-96.
[
|
| [25] |
李严洁 . 多元回归中的多重共线性及其存在的后果[J]. 中国卫生统计, 1992(1):24-27.
[
|
| [26] |
|
| [27] |
|
| [28] |
肖雪梦, 张应应 . 三种回归方法在消除多重共线性及预测结果的比较[J]. 统计与决策, 2015(24):75-78.
[
|
| [29] |
谢小韦 . 浅析多元线性回归中多重共线性问题的三种解决方法[J]. 科技信息, 2009(28):117-118.
[
|
| [30] |
张润楚 . 多元统计分析[M]. 北京: 科学出版社, 2006.
[
|
| [31] |
|
| [32] |
张松林, 张昆 . 全局空间自相关Moran指数和G系数对比研究[J]. 中山大学学报(自然科学版), 2007,46(4):93-97.
[
|
| [33] |
宋鸿, 陈晓玲 . 运用空间自相关分析中国入境旅游增长空间格局[J]. 世界地理研究, 2006(1):99-106.
[
|
/
| 〈 |
|
〉 |


