
Journal of Geo-information Science >
Method for Monitoring Daily Snow Cover based on Dynamic NDSI Thresholds
Received date: 2019-03-26
Request revised date: 2019-09-05
Online published: 2020-04-13
Supported by
National Key Research and Development Program of China(2017YFC0405802)
Copyright
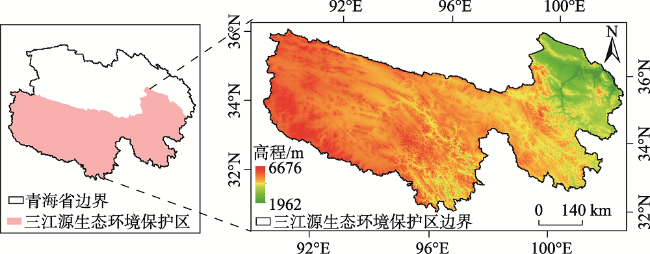
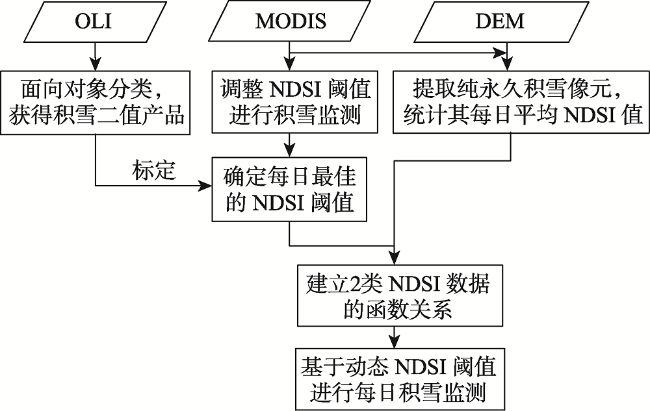
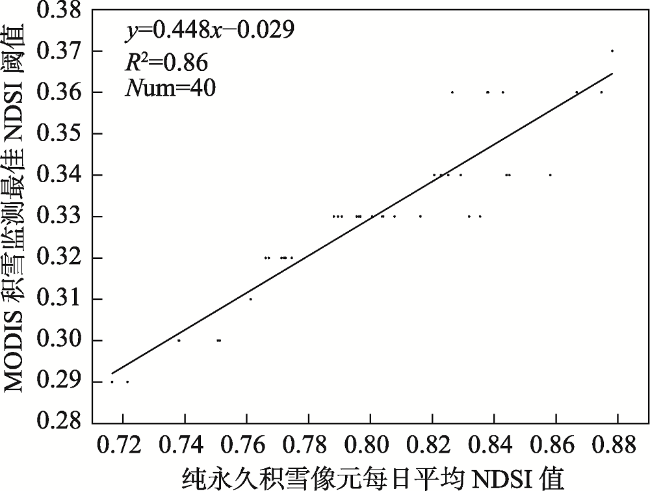
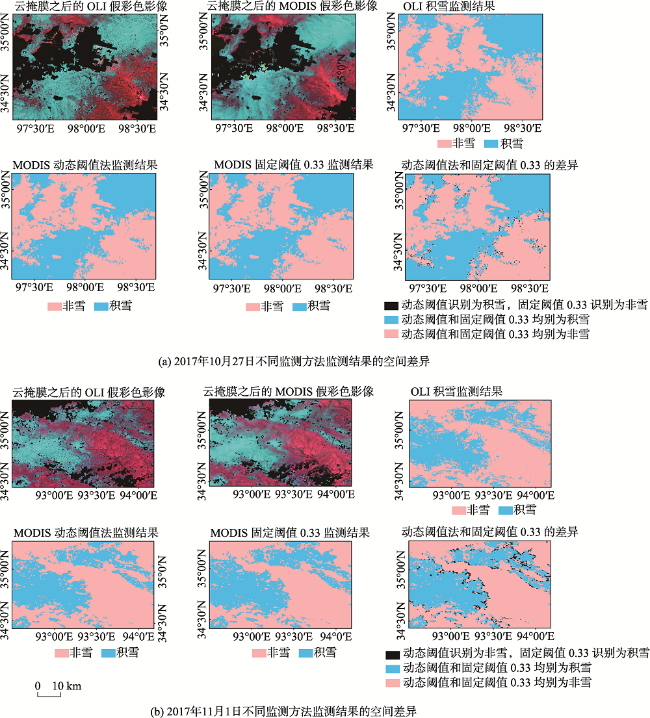
Accurate snow cover information is of great significance to the study of meteorology, hydrology, and global climate change. Remote sensing techniques play an important role in large-scale and high-frequency snow cover monitoring. Nowadays, SNOMAP algorithm is the most common method for remote sensing monitoring of snow, which mainly uses fixed NDSI (Normalized Difference Snow Index) thresholds to identify snow. However, this method ignores the temporal variations of snow spectral information, leading to monitoring errors of snow cover. In this study, we proposed an adjusted method to monitor snow cover by dynamic NDSI thresholds. This method adjusts fixed NDSI thresholds by using the average NDSI value of pure permanent snow as reference to reduce the influence of spectral fluctuations. Snow cover in the Sanjiangyuan area was identified and monitored by this method. There were four steps: (1) OLI and MODIS data of the same region, the same period and cloud-free were selected. The OLI NDSI threshold of the best snow cover recognition was determined by human-computer interaction. (2) The snow area monitored based on OLI data was used as the true value of the ground to calibrate the optimal MODIS NDSI threshold on the same day. (3) The average NDSI value of the pure permanent snow in the Sanjiangyuan area on the same day was counted. The elevation of the pure permanent snow pixels was more than 5800 meters and the FSC (Fractional Snow Cover) of them was 100%. (4) The functional relationship between the optimal MODIS NDSI threshold and the average NDSI value of the pure permanent snow was established. The dynamic MODIS NDSI threshold was obtained by the linear regression and varied with the average NDSI value of pure permanent snow. Results show that: (1) Based on daily MODIS data, there was a good linear relationship between the optimal NDSI threshold for snow cover monitoring and the average NDSI value of pure permanent snow on the same day, and the determinant coefficient R 2 reached 0.86. (2) The dynamic NDSI thresholds of Sanjiangyuan area were between 0.29 and 0.37, and the average value of NDSI threshold was about 0.33, indicating that 0.40 as the NDSI threshold would underestimate the snow cover area of the Sanjiangyuan area. (3) The average values of the approximation ratio, the overall classification accuracy, and F of dynamic NDSI threshold method were 96.61%, 94.62%, and 91.99%, respectively. Compared with the monitoring method with the fixed NDSI threshold of 0.33, they were improved by 5.17%, 0.70%, and 1.14%, respectively. Our findings demonstrate the effectiveness of the proposed method.

SUN Yuyan , ZHANG Lei , LU Shanlong , LIU Hongchao . Method for Monitoring Daily Snow Cover based on Dynamic NDSI Thresholds[J]. Journal of Geo-information Science, 2020 , 22(2) : 298 -307 . DOI: 10.12082/dqxxkx.2020.190139
表1 选用的Landsat8-OLI影像数据Tab. 1 Landsat8-OLI images used for this study |
| 编号 | 成像日期 | 行列号 | 编号 | 成像日期 | 行列号 |
|---|---|---|---|---|---|
| 01 | 2013-11-04 | 139036 | 02 | 2013-11-06 | 137035 |
| 03 | 2013-11-15 | 136035 | 04 | 2013-11-22 | 137036 |
| 05 | 2013-11-29 | 138036 | 06 | 2013-12-01 | 136037 |
| 07 | 2013-12-03 | 134036 | 08 | 2013-12-08 | 137035 |
| 09 | 2013-12-28 | 133036 | 10 | 2014-10-31 | 138036 |
| 11 | 2014-11-09 | 137035 | 12 | 2014-11-13 | 133036 |
| 13 | 2014-11-16 | 138035 | 14 | 2014-12-02 | 138035 |
| 15 | 2014-12-29 | 135037 | 16 | 2014-12-31 | 133036 |
| 17 | 2015-01-09 | 132036 | 18 | 2015-02-06 | 136037 |
| 19 | 2015-01-21 | 136037 | 20 | 2015-03-21 | 133036 |
| 21 | 2015-04-22 | 133035 | 22 | 2015-11-16 | 133036 |
| 23 | 2015-11-28 | 137036 | 24 | 2016-01-08 | 136036 |
| 25 | 2016-01-17 | 135037 | 26 | 2016-02-04 | 133036 |
| 27 | 2016-10-17 | 133036 | 28 | 2016-10-22 | 136037 |
| 29 | 2016-10-31 | 135037 | 30 | 2016-12-04 | 133037 |
| 31 | 2017-01-01 | 137036 | 32 | 2017-01-05 | 133036 |
| 33 | 2017-02-04 | 135037 | 34 | 2017-04-30 | 138036 |
| 35 | 2017-10-27 | 134036 | 36 | 2017-11-01 | 137036 |
| 37 | 2017-11-05 | 133036 | 38 | 2017-11-08 | 138036 |
| 39 | 2017-11-12 | 134036 | 40 | 2017-11-19 | 135036 |
| 41 | 2017-12-30 | 134035 | 42 | 2018-01-01 | 132036 |
| 43 | 2018-03-29 | 133036 | 44 | 2018-11-07 | 133037 |
| 45 | 2018-11-21 | 135037 | 46 | 2018-11-23 | 133036 |
| 47 | 2018-12-25 | 133036 | 48 | 2018-11-30 | 134036 |
| 49 | 2018-12-16 | 134035 | 50 | 2019-01-01 | 134036 |
表2 动态NDSI阈值和固定NDSI阈值0.33监测精度的对比Tab. 2 Monitoring accuracies based on dynamic NDSI thresholds versus the fixed NDSI threshold 0.33 (%) |
| 时间 | 精度指标 | 监测方法 | 动态比固定NDSI阈值 提高精度 | |
|---|---|---|---|---|
| 动态NDSI阈值 | 固定NDSI阈值0.33 | |||
| 2013-11-04 | 近似率 | 97.58 | 82.45 | 15.13 |
| 总体分类精度 | 94.59 | 93.71 | 0.88 | |
| F值 | 87.05 | 83.30 | 3.75 | |
| 2013-11-22 | 近似率 | 85.79 | 71.42 | 14.37 |
| 总体分类精度 | 90.95 | 88.33 | 2.62 | |
| F值 | 79.23 | 74.18 | 5.05 | |
| 2013-12-03 | 近似率 | 96.66 | 93.94 | 2.72 |
| 总体分类精度 | 92.07 | 91.75 | 0.32 | |
| F值 | 87.85 | 87.55 | 0.30 | |
| 2014-12-02 | 近似率 | 97.42 | 97.42 | 0.00 |
| 总体分类精度 | 95.85 | 95.85 | 0.00 | |
| F值 | 92.57 | 92.57 | 0.00 | |
| 2015-11-16 | 近似率 | 98.01 | 94.64 | 3.37 |
| 总体分类精度 | 95.10 | 94.63 | 0.47 | |
| F值 | 96.58 | 96.32 | 0.26 | |
| 2016-10-31 | 近似率 | 98.68 | 94.35 | 4.33 |
| 总体分类精度 | 98.83 | 98.15 | 0.68 | |
| F值 | 99.31 | 98.90 | 0.41 | |
| 2017-10-27 | 近似率 | 94.59 | 92.55 | 2.04 |
| 总体分类精度 | 93.58 | 93.12 | 0.46 | |
| F值 | 93.23 | 92.67 | 0.56 | |
| 2017-11-01 | 近似率 | 99.35 | 92.31 | 7.04 |
| 总体分类精度 | 92.30 | 91.85 | 0.45 | |
| F值 | 89.33 | 89.00 | 0.33 | |
| 2017-11-12 | 近似率 | 98.56 | 97.98 | 0.58 |
| 总体分类精度 | 96.84 | 96.70 | 0.14 | |
| F值 | 96.93 | 96.80 | 0.13 | |
| 2018-11-23 | 近似率 | 99.49 | 97.34 | 2.15 |
| 总体分类精度 | 96.13 | 95.15 | 0.98 | |
| F值 | 97.84 | 97.25 | 0.59 | |
| [1] |
李弘毅, 王建 . 积雪水文模拟中的关键问题及其研究进展[J]. 冰川冻土, 2013,35(2):430-437.
[
|
| [2] |
|
| [3] |
汪箫悦, 王思远, 尹航 , 等. 2002-2012年青藏高原积雪物候变化及其对气候的响应[J]. 地球信息科学学报, 2016,18(11):1573-1580.
[
|
| [4] |
|
| [5] |
|
| [6] |
张学通 . 青海省积雪监测与青南牧区雪灾预警研究[D]. 兰州:兰州大学, 2010.
[
|
| [7] |
隋琦, 王瑛, 李婷 , 等. 多源信息结合的雪灾交通风险评估研究[J]. 地球信息科学学报, 2018,20(11):1571-1578.
[
|
| [8] |
肖雄新, 张廷军 . 基于被动微波遥感的积雪深度和雪水当量反演研究进展[J]. 地球科学进展, 2018,33(6):590-605.
[
|
| [9] |
吴晓晨, 孟令奎, 张东映 , 等. 冰雪遥感监测方法综述[J]. 水利信息化, 2013,27(1):35-39.
[
|
| [10] |
王建 . 卫星遥感制图方法对比与分析[J]. 遥感技术与应用, 1999,14(4):29-36.
[
|
| [11] |
|
| [12] |
|
| [13] |
|
| [14] |
刘畅, 李震, 张平 , 等. 基于Google Earth Engine评估新疆西南部MODIS积雪产品[J]. 遥感技术与应用, 2018,33(4):584-592.
[
|
| [15] |
王轩, 郝晓华, 王建 , 等. 中国地区AVHRR长时间序列积雪范围产品精度评估[J]. 遥感技术与应用, 2018,33(6):994-1003.
[
|
| [16] |
|
| [17] |
魏文寿, 秦大河, 刘明哲 . 中国西北地区季节性积雪的性质与结构[J]. 干旱区地理, 2001,24(4):310-313.
[
|
| [18] |
郝晓华, 王建, 李弘毅 . MODIS雪盖制图中NDSI阈值的检验——以祁连山中部山区为例[J]. 冰川冻土, 2008,30(1):132-138.
[
|
| [19] |
王玮 . 青藏高原牧区积雪监测研究[D]. 兰州:兰州大学, 2010.
[
|
| [20] |
何咏琪, 黄晓东, 方金 , 等. 基于HJ-1B卫星遥感数据的积雪面积制图算法研究[J]. 冰川冻土, 2013,35(1):65-73.
[
|
| [21] |
蒋熹 . 冰雪反照率研究进展[J]. 冰川冻土, 2006,28(5):728-738.
[
|
| [22] |
王剑庚, 冯学智, 肖鹏峰 , 等. 雪粒径对积雪双向反射率的影响[J]. 红外与毫米波学报, 2013,32(3):283-288.
[
|
| [23] |
|
| [24] |
|
| [25] |
|
| [26] |
|
| [27] |
邱玉宝, 张欢, 除多 , 等. 基于MODIS的青藏高原逐日无云积雪产品算法[J]. 冰川冻土, 2017,39(3):515-526.
[
|
| [28] |
|
| [29] |
|
/
| 〈 |
|
〉 |