
Journal of Geo-information Science >
Study on Urban Spatiotemporal Expansion Pattern of Three First-class Urban Agglomerations in China Derived from Integrated DMSP-OLS and NPP-VIIRS Nighttime Light Data
Received date: 2019-11-23
Request revised date: 2019-12-06
Online published: 2020-07-25
Supported by
National Natural Science Foundation of China(41471127)
Graduate Student Innovation Ability Cultivation Support Project of Hebei Normal University(CXZZSS2019074)
Copyright
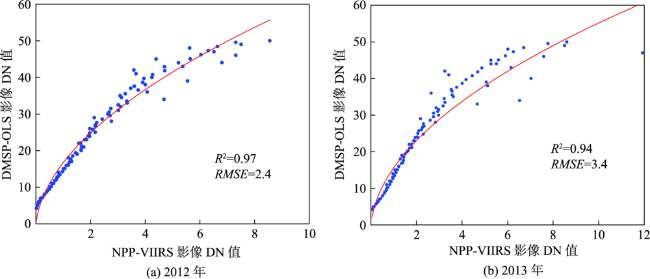
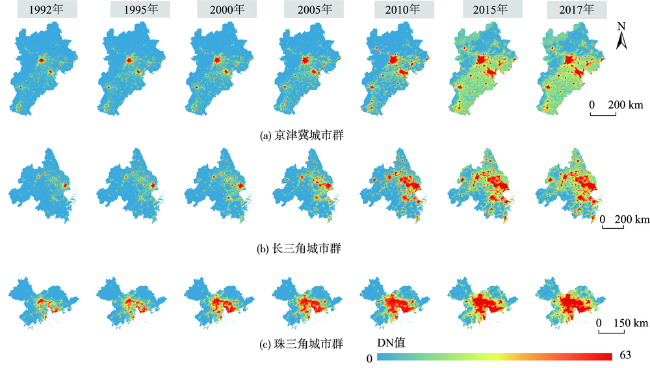
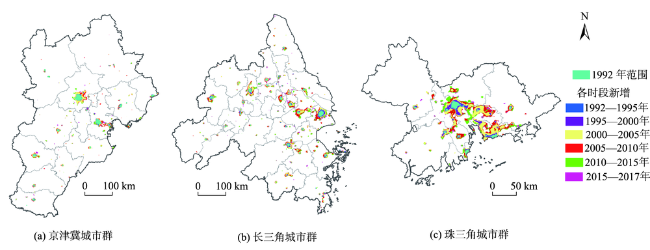
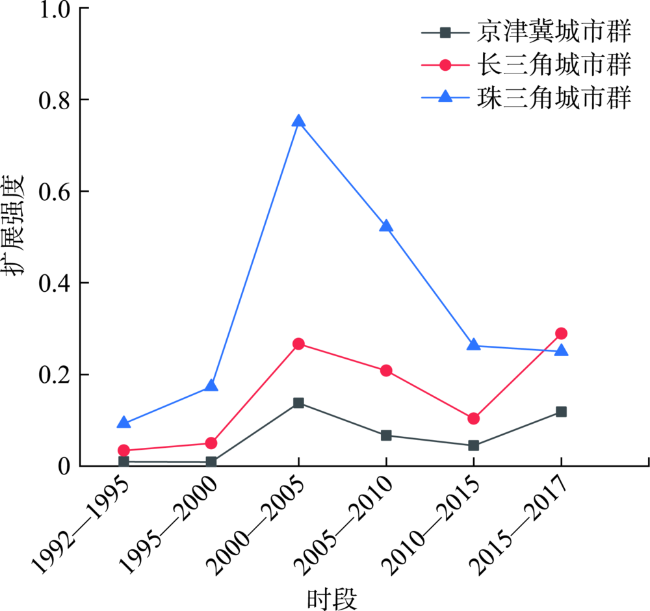
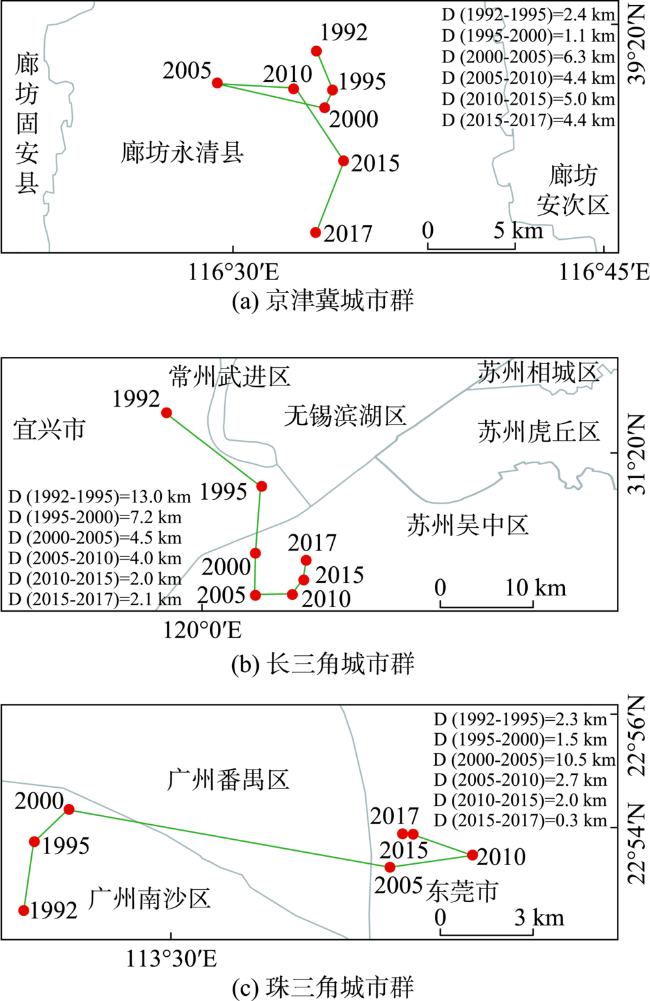
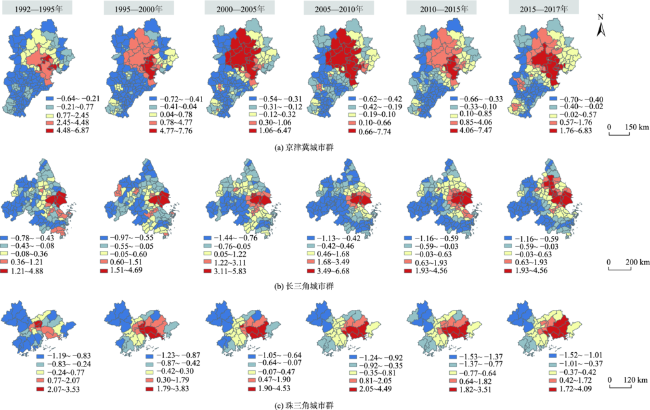
This study took Beijing-Tianjin-Hebei, the Yangtze River Delta, and the Pearl River Delta as study areas. Based on correlation analysis of overlapping years in 2012 and 2013, a power function model was used to transform NPP-VIIRS NTL data(2012—2017) to simulate DMSP-OLS NTL data. We generated a temporally consistent NTL dataset of study areas from 1992 to 2017 (consisting of 1992—2013 DMSP-OLS NTL data and 2014—2017 NPP-VIIRS NTL data). By referring to the statistical data of urban built-up area, the optimal threshold of nighttime light was determined to extract urban scope. Based on this method, urban scope with insufficient economic vitality contained in the statistical data was effectively stripped off, while those low-grade,high-vitality urban areas that did not belong to the statistical scope were identified, which innovated the perspective of data application. Results show that: ① The contribution of county-level towns and cities of the municipal level to the economic vitality in three first-class urban agglomerations was different. The Beijing-Tianjin-Hebei had a vast hinterland, and county-level towns were an important part of the regional economic vitality. As a whole, they had the largest contribution in three first-class urban agglomerations. In the early 1990s, some county-level towns in the Yangtze River Delta had strong economic vitality. After 2005, it was lower than the Beijing-Tianjin-Hebei with the process of transforming county into urban district. Affected by the socioeconomic development and the division of administrative units, the contribution of county-level towns to the urban scope in the Pearl River Delta was always the smallest in three urban agglomerations. ② There were differences in the imbalanced characteristics of urban spatial expansion in three first-class urban agglomerations. The urban spatial expansion of the Beijing-Tianjin-Hebei was led by Beijing and Tianjin, which has formed a "dual-core" model. It has not yet formed a sophisticated urban system. The Yangtze River Delta and the Pearl River Delta had obvious urban agglomeration characteristics and stronger equilibrium. The path, direction, and distance of center of gravity migration reflected the different expansion intensity and behavioral model in three first-class urban agglomerations; ③ On the whole, urban spatial expansion pattern presented the characteristics of continuously expanding hot-spot regions and shrinking cold-spot regions. Specifically, hot-spot regions and cold-spot regions were relatively stable in the Beijing-Tianjin-Hebei, and the hot-spot regions had a strong centripetal agglomeration effect. The spatial patterns of the Yangtze River Delta and the Pearl River Delta has changed greatly and the regional core cities had a stronger driving role.

DONG Hesong , LI Renjie , LI Jianming , LI Shuai . Study on Urban Spatiotemporal Expansion Pattern of Three First-class Urban Agglomerations in China Derived from Integrated DMSP-OLS and NPP-VIIRS Nighttime Light Data[J]. Journal of Geo-information Science, 2020 , 22(5) : 1161 -1174 . DOI: 10.12082/dqxxkx.2020.190711
表1 基于传感器的影像相互校正回归模型系数Tab. 1 Regression model coefficients for images mutual correction based on sensors |
| 数据集 | a | b | c | R |
|---|---|---|---|---|
| F16→F15 | -0.001 447 | 1.091 | 0.913 | 0.9309 |
| F15→F14 | -0.003 202 | 1.093 | 1.766 | 0.8646 |
| F14→F12 | 0.003 413 | 0.628 | 2.717 | 0.9564 |
| F12→F10 | 0.001 906 | 0.832 | 0.886 | 0.9171 |
| F16→F18 | 0.004 262 | 0.673 | 0.766 | 0.8955 |
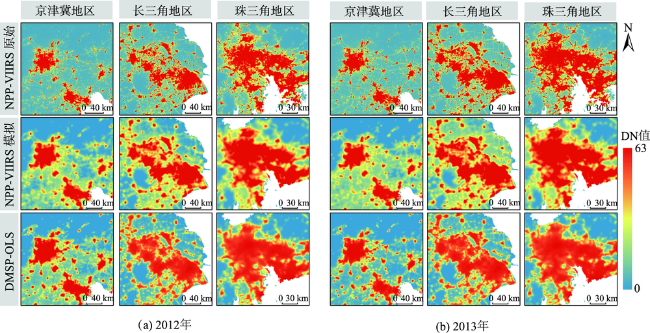
图2 2012年和2013年三大城市群典型区域NPP-VIIRS原始、NPP-VIIRS模拟和DMSP-OLS影像对比Fig. 2 Spatial pattern of DMSP-OLS and NPP-VIIRS simulated data for part of the Beijing-Tianjin-Hebei, part of the Yangtze River Delta, part of the Pearl River Delta in 2012, 2013 |
表2 NPP-VIIRS影像模拟前后与DMSP-OLS影像的相关分析Tab. 2 Correlation analysis between DMSP-OLS and NPP-VIIRS |
| 年份 | 校正前 | 校正后 | |||
|---|---|---|---|---|---|
| r | RMSE | r | RMSE | ||
| 2012 | 0.66 | 18.8 | 0.88 | 5.3 | |
| 2013 | 0.67 | 18.1 | 0.85 | 6.1 | |
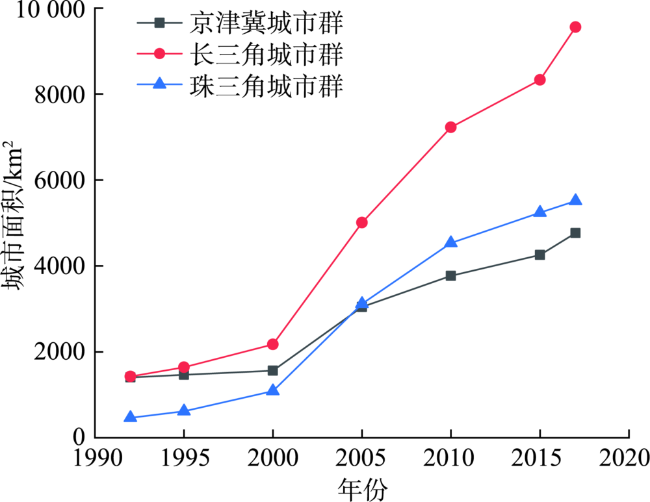
表3 夜间灯光拟合城市空间规模与统计数据差值Tab. 3 Urban scale and extraction error from integrated nighttime light data (km2,km2,%,km2,%) |
| 年份 | 京津冀城市群 | 长三角城市群 | 珠三角城市群 | ||||||||||||||
|---|---|---|---|---|---|---|---|---|---|---|---|---|---|---|---|---|---|
| 统计 | 全部 | 差值 | 仅市 | 差值 | 统计 | 全部 | 差值 | 仅市 | 差值 | 统计 | 全部 | 差值 | 仅市 | 差值 | |||
| 1992 | 1389 | 1402 | 0.94 | 1390 | -0.86 | 1398 | 1427 | 2.07 | 1405 | -1.54 | 464 | 466 | 0.43 | 466 | 0.00 | ||
| 1995 | 1452 | 1464 | 0.83 | 1452 | -0.82 | 1576 | 1643 | 4.25 | 1613 | -1.83 | 543 | 617 | 13.63 | 617 | 0.00 | ||
| 2000 | 1582 | 1560 | -1.39 | 1537 | -1.47 | 2166 | 2174 | 0.37 | 2147 | -1.24 | 1073 | 1086 | 1.21 | 1085 | -0.09 | ||
| 2005 | 3032 | 3046 | 0.46 | 2956 | -2.95 | 4959 | 5008 | 0.99 | 4859 | -2.98 | 3111 | 3119 | 0.26 | 3118 | -0.03 | ||
| 2010 | 3564 | 3770 | 5.78 | 3624 | -3.87 | 6897 | 7225 | 4.76 | 6957 | -3.71 | 4236 | 4532 | 6.99 | 4502 | -0.66 | ||
| 2015 | 4231 | 4254 | 0.54 | 4039 | -5.05 | 8096 | 8329 | 2.88 | 8006 | -3.88 | 4809 | 5243 | 9.02 | 5238 | -0.10 | ||
| 2017 | 4653 | 4765 | 2.41 | 4438 | -6.86 | 8777 | 9560 | 8.92 | 9167 | -4.11 | 5068 | 5514 | 8.80 | 5488 | -0.47 | ||
| 合计 | 19 903 | 20 261 | 1.80 | 19 436 | -4.07 | 33 869 | 35 366 | 4.42 | 34154 | -3.43 | 19304 | 20 577 | 6.59 | 20 514 | -0.31 | ||
注:“全部”,表示统计城市群中所有灯光数据识别的城市;“仅市”,表示只统计城市群中属于市级及以上的行政区内灯光数据识别的城市。 |
| [1] |
方创琳, 王振波, 马海涛. 中国城市群形成发育规律的理论认知与地理学贡献[J]. 地理学报, 2018,73(4):651-665.
[
|
| [2] |
马双, 曾刚. 网络视角下中国十大城市群区域创新模式研究[J]. 地理科学, 2019,39(6):905-911.
[
|
| [3] |
曹诗颂, 胡德勇, 赵文吉, 等. 不透水地表盖度视角下中美城市群空间结构对比——以“京津冀”与“波士华”为例[J]. 地理学报, 2017,72(6):1017-1031.
[
|
| [4] |
刘飞, 郑新奇, 黄晴. 基于空间分形特征的城市群实体空间识别方法[J]. 地理科学进展, 2017,36(6):677-684.
[
|
| [5] |
|
| [6] |
|
| [7] |
|
| [8] |
|
| [9] |
毛炜圣, 钟业喜. 长江中游城市群城市活力水平空间格局及影响因素[J]. 世界地理研究, 2020,29(1):86-95.
[
|
| [10] |
|
| [11] |
梁泽, 黄姣, 韦飞黎, 等. 基于夜光遥感影像与百度POI数据的中国城市群空间范围识别方法[J]. 地理研究, 2020,39(1):92-102.
[
|
| [12] |
周亮, 赵琪, 杨帆. 基于POI与NPP/VIIRS灯光数据的城市群边界定量识别[J]. 地理科学进展, 2019,38(6):840-850.
[
|
| [13] |
刘浩, 马琳, 李国平. 1990s以来京津冀地区经济发展失衡格局的时空演化[J]. 地理研究, 2016,35(3):471-481.
[
|
| [14] |
|
| [15] |
|
| [16] |
|
| [17] |
|
| [18] |
|
| [19] |
陈晋, 卓莉, 史培军, 等. 基于DMSP/OLS数据的中国城市化过程研究——反映区域城市化水平的灯光指数的构建[J]. 遥感学报, 2003(3):168-175,241.
[
|
| [20] |
何春阳, 史培军, 李景刚, 等. 基于DMSP/OLS夜间灯光数据和统计数据的中国大陆20世纪90年代城市化空间过程重建研究[J]. 科学通报, 2006,51(7):856-861.
[
|
| [21] |
|
| [22] |
陈昕, 彭建, 刘焱序, 等. 基于DMSP/OLS夜间灯光数据的京津冀地区城市空间扩展与空间关联测度[J]. 地理研究, 2018,37(5):898-909.
[
|
| [23] |
许礼华. 基于NPP-VIIRS数据长三角城市群城市扩张时空演变研究[D]. 上海:上海师范大学, 2019.
[
|
| [24] |
马瑞峰. 珠三角城市群空间扩展格局及其驱动力因子分析——基于DMSP/OLS和NPP/VIIRS影像[J]. 宝鸡文理学院学报(自然科学版), 2018,38(3):68-75.
[
|
| [25] |
|
| [26] |
|
| [27] |
|
| [28] |
曹子阳, 吴志峰, 匡耀求, 等. DMSP/OLS夜间灯光影像中国区域的校正及应用[J]. 地球信息科学学报, 2015,17(9):1092-1102.
[
|
| [29] |
国家统计局城市社会经济调查司. 中国城市统计年鉴[M]. 北京: 中国统计出版社,1993- 2018.
[ Cities Socioeconomic survey office National bureau of statistics. China city statistics yearbook[M]. Beijing: China Statistics Press, 1993- 2018. ]
|
| [30] |
张梦琪, 何宗宜, 樊勇. DMSP/OLS稳定夜间灯光影像的校正方法[J]. 测绘通报, 2017(12):58-62,76.
[
|
| [31] |
|
| [32] |
胡忆东, 吴志华, 熊伟, 等. 城市建成区界定方法研究——以武汉市为例[J]. 城市规划, 2008(4):88-91,96.
[
|
| [33] |
舒松, 余柏蒗, 吴健平, 等. 基于夜间灯光数据的城市建成区提取方法评价与应用[J]. 遥感技术与应用, 2011,26(2):169-176.
[
|
| [34] |
王利伟, 冯长春. 转型期京津冀城市群空间扩展格局及其动力机制——基于夜间灯光数据方法[J]. 地理学报, 2016,71(12):2155-2169.
[
|
| [35] |
杨任飞. 基于DMSP/OLS与NPP/VIIRS整合数据的城市群发育过程研究[D]. 重庆:西南大学, 2018.
[
|
| [36] |
刘纪远, 张增祥, 庄大方, 等. 20世纪90年代中国土地利用变化时空特征及其成因分析[J]. 地理研究, 2003,22(1):1-12.
[
|
| [37] |
刘纪远, 张增祥, 徐新良, 等. 21世纪初中国土地利用变化的空间格局与驱动力分析[J]. 地理学报, 2009,64(12):1411-1420.
[
|
/
| 〈 |
|
〉 |