
Journal of Geo-information Science >
Discovery of Urban Human Mobility Patterns from Smart Card Transactions and Taxi GPS Trajectories: A Comparative Study
Received date: 2019-06-18
Request revised date: 2019-12-27
Online published: 2020-08-25
Supported by
National Key Research and Development Program of China(2017YFB0503601)
National Natural Science Foundation of China(41971353)
National Natural Science Foundation of China(41601410)
Innovation Drive Program of Central South University(2018CX015)
Copyright
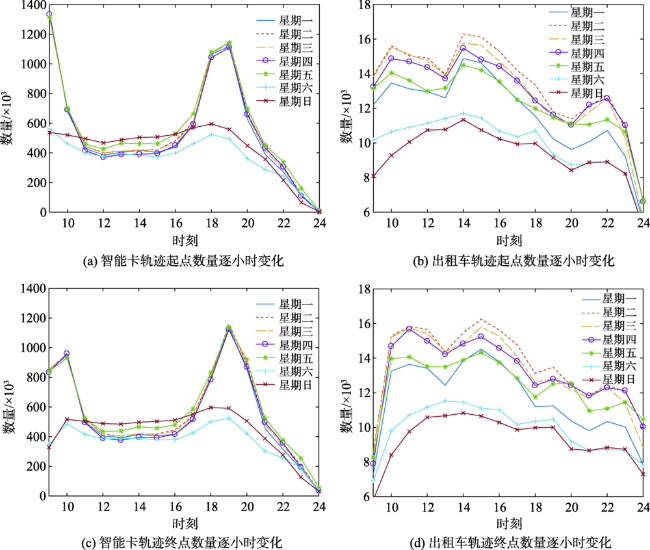
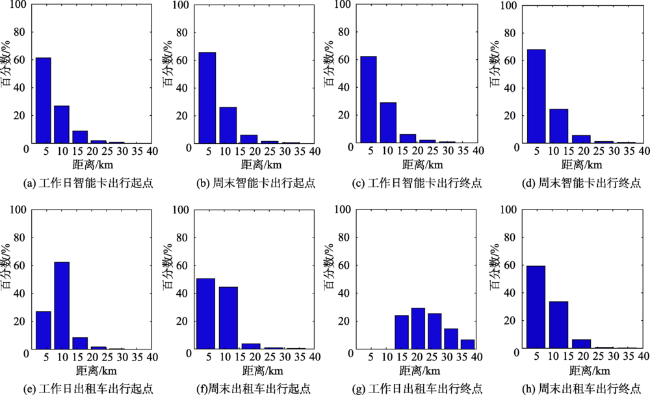
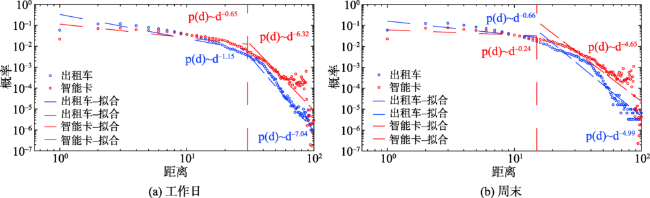
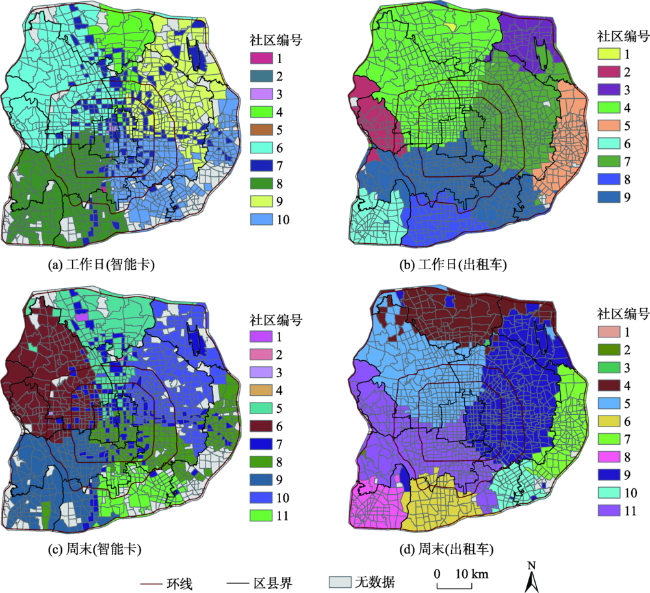
In the era of big data, traffic flows play an important role in understanding our socioeconomic environment. In recent years, two types of traffic flows, smart card transactions and taxi GPS trajectories, have been widely but usually separately utilized to understand human mobility in big cities. To date, although numerous research achievements have been made, the relationship between these two types of traffic flows that occur in the same area and in the same time period is still poorly understood. Thus, the pattern of urban human mobility may be biased by using a single type of traffic flow. In this study, we aimed to compare the urban human mobility patterns derived from the two traffic flows, i.e., smart card transactions and taxi GPS trajectories. Taking the area within the Sixth Ring Road of Beijing as study area, we collected the smart card transactions and taxi GPS trajectories data from May 9th to May 15th in 2016. Specifically, we compared: ① the spatio-temporal distributions of public transit and taxi usage; ② the travel distance of public transition and taxi usage and the distance-decay effects, and ③ the spatial community structures discovered from the two traffic flows. Our results show that: ① the spatial distributions of travel demand revealed by two traffic flows are highly correlated. However, the correlations between origin and destination time series extracted from the two traffic flows were very weak; ② the usages of public transit and taxi had spatial heterogeneity, and the spatial difference between the usages of public transit and taxi cannot be fully explained by the number of intersections, the number of points of interest, and the average distance to the nearest city center, shopping center, hospital and subway; ③ the travel distances extracted from taxi GPS trajectories decayed faster than that extracted from public transit, indicating that public transit was more important in facilitating long-distance travel, and ④ spatial communities discovered from the two traffic flows both reflected the polycentric spatial structure of the city. However, the differences in spatial community structures indicated that the two traffic flows played different roles in spatial interactions in the city. The quantitative comparison between smart card transactions and taxi GPS trajectories could improve our understanding of human mobility in Beijing, which also demonstrates the potential biases by using a single traffic flow to study urban system dynamic. Our results suggest integrating multi-source traffic flows to understand urban human mobility patterns in future.

ZHENG Xiaolin , LIU Qiliang , LIU Wenkai , WU Zhihui . Discovery of Urban Human Mobility Patterns from Smart Card Transactions and Taxi GPS Trajectories: A Comparative Study[J]. Journal of Geo-information Science, 2020 , 22(6) : 1268 -1281 . DOI: 10.12082/dqxxkx.2020.190312
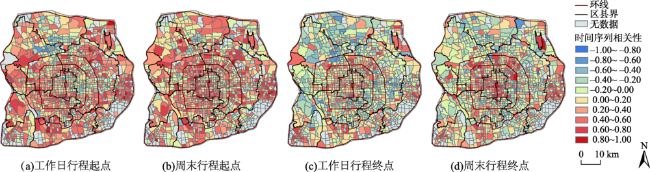
图2 2种交通流在工作日和周末的行程起点和终点时间序列相关性对比Fig. 2 The correlation between origin and destination time series oftwo traffic flowson weekdays and weekends |
表1 依据2种交通流时间相关性对交通分析小区分类统计Tab. 1 Classification of traffic analysis zones based on the temporal correlation between two kinds of traffic flow |
| 相关性 | 交通分析小区数量/个 | |||
|---|---|---|---|---|
| 工作日 行程起点 | 周末 行程起点 | 工作日 行程终点 | 周末 行程终点 | |
| -1.0~ -0.8 | 0 | 0 | 2 | 1 |
| -0.8~ -0.6 | 9 | 3 | 28 | 12 |
| -0.6~ -0.4 | 30 | 13 | 89 | 63 |
| -0.4~ -0.2 | 80 | 65 | 170 | 171 |
| -0.2~0.0 | 354 | 409 | 480 | 481 |
| 0.0~0.2 | 246 | 248 | 264 | 243 |
| 0.2~0.4 | 324 | 293 | 231 | 224 |
| 0.4~0.6 | 289 | 266 | 138 | 162 |
| 0.6~0.8 | 109 | 136 | 46 | 76 |
| 0.8~1.0 | 10 | 18 | 3 | 18 |
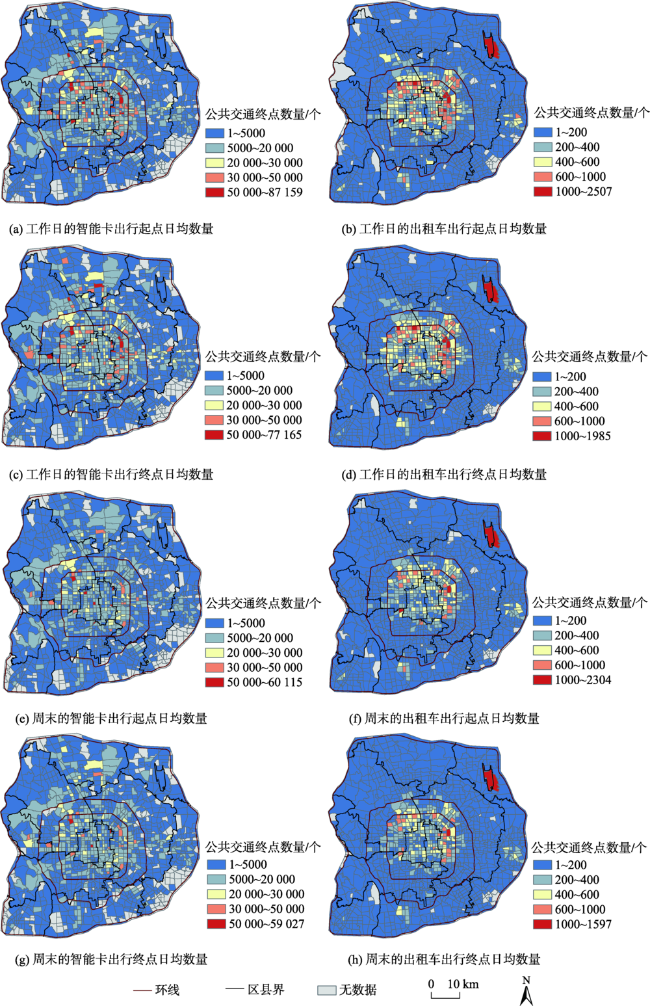
图3 2种数据集提取的平均每日行程需求的空间分布Fig. 3 Spatial distributions of average daily trips extracted from smart card transactions and taxi GPS trajectories |
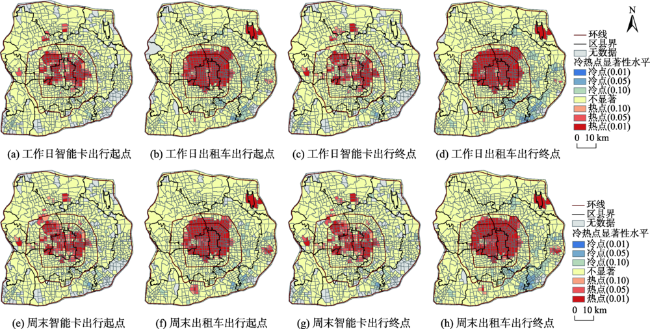
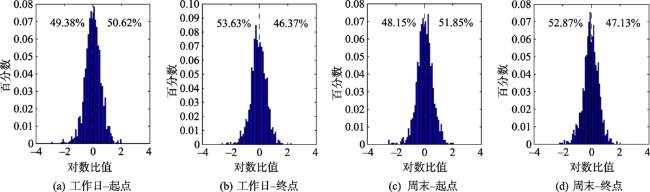
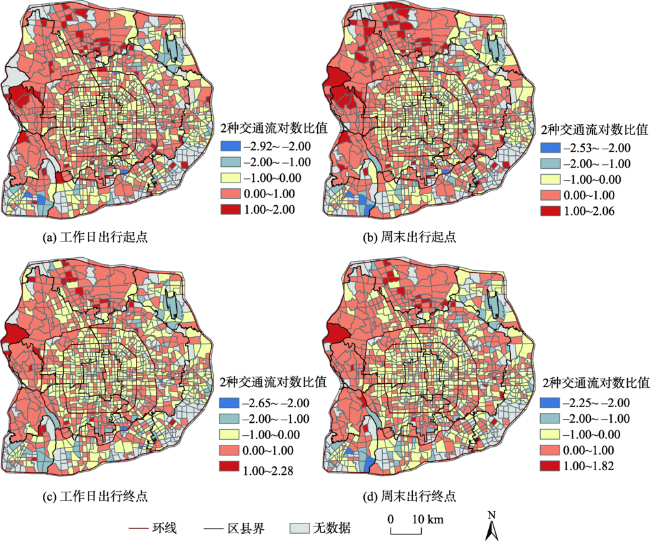
图5 分别采用2种交通流出行起点和终点计算的对数比值的直方图注:直方图中左边数值表示对数比值小于0的比例,右边数值表示对数比值大于0的比例。 Fig. 5 Histograms of log odds ratio based on each combination of trip category (outgoing vs. incoming) and type of day (weekdays vs. weekends) |
| [1] |
|
| [2] |
|
| [3] |
|
| [4] |
郑宇. 城市计算概述[J]. 武汉大学学报·自然科学版, 2015,40(1):1-13.
[
|
| [5] |
|
| [6] |
|
| [7] |
|
| [8] |
|
| [9] |
龙瀛, 张宇, 崔承印. 利用公交刷卡数据分析北京职住关系和通勤出行[J]. 地理学报, 2012,67(10):1339-1352.
[
|
| [10] |
|
| [11] |
|
| [12] |
|
| [13] |
|
| [14] |
|
| [15] |
|
| [16] |
杨喜平, 方志祥. 移动定位大数据视角下的人群移动模式及城市空间结构研究进展[J]. 地理科学进展, 2018,37(7):18-27.
[
|
| [17] |
|
| [18] |
龙瀛, 孙立君, 陶遂. 基于公共交通智能卡数据的城市研究综述[J]. 城市规划学刊, 2015,223(3):70-77.
[
|
| [19] |
|
| [20] |
|
| [21] |
|
| [22] |
|
/
| 〈 |
|
〉 |