
Journal of Geo-information Science >
Assessment of Smart City Development Status in China based on Multi-source Data
Received date: 2019-11-20
Request revised date: 2020-01-19
Online published: 2020-08-25
Supported by
Strategic Priority Research Program of the Chinese Academy of Sciences(XDA19040402)
Copyright
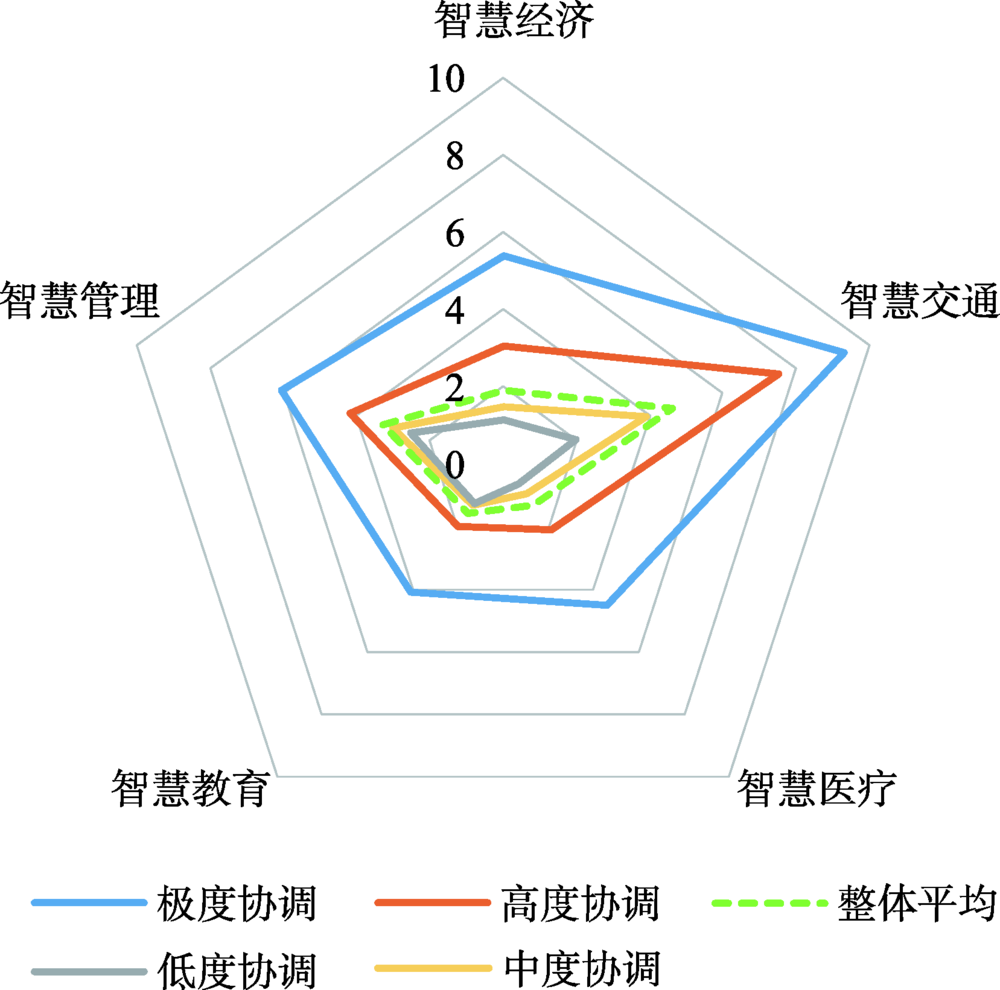
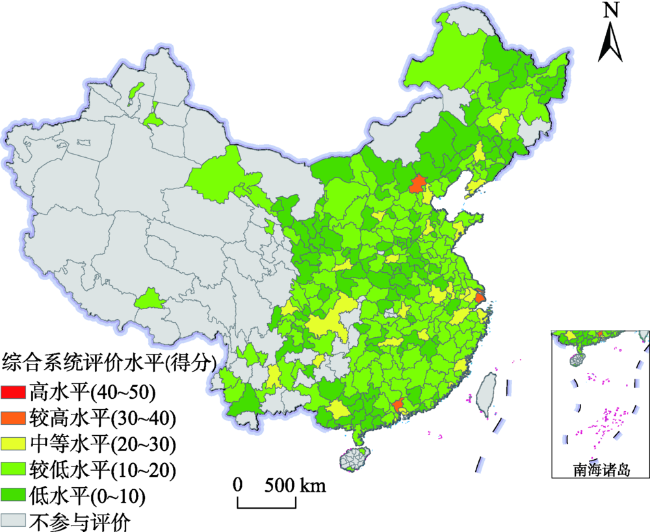
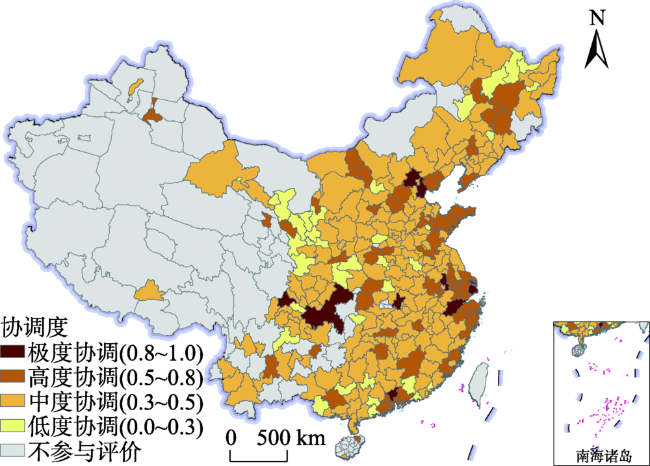
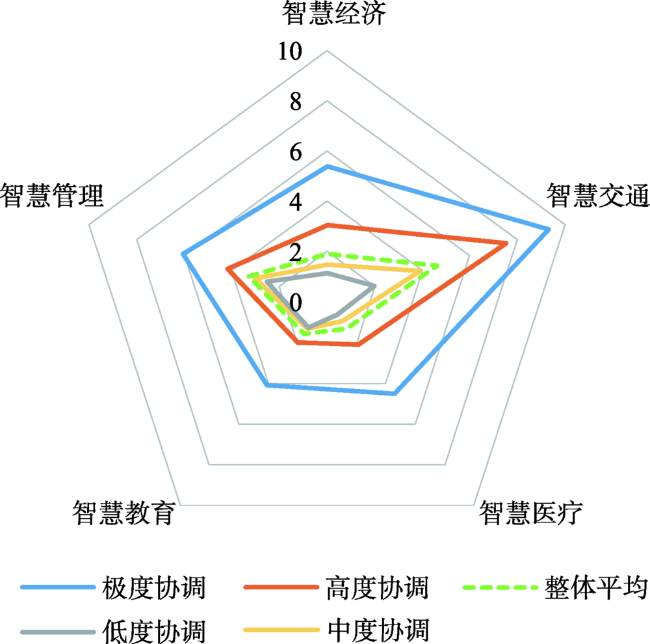
With the development of information and communication technology, such as mobile internet, cloud computing, and big data, smart city has gradually become the important development tendency of urban construction. During the period of the 13 th five-year plan, cities have formulated their smart city construction (or development) plans and regarded these plans as key part of their medium- and long-term urban development strategies. Because smart city involves various context and massive indexes, the assessment of smart cities is undergoing continuous development and improvement. Thus, so far, an unified assessment standard is still lacking. Based on this, we compare the domestic and international index systems to assess smart city development. With the objectives including improving cities' capability of sustainable development, implementing efficient and fair management, and ensuring urban residents' wellbeing, this paper proposes an assessment index system with multiple layers and five sub-systems including smart economy, smart transport, smart healthcare, smart education, and smart management. This paper employs text, webpage, and statistic data and conducts a comprehensive, uniform, and multi-layer assessment to evaluate smart city development status for Chinese cities. finally, we offer constructive suggestion on smart city development from the perspective of sub-system coordination. Main findings are shown here. First, except 8 cities, namely Beijing, Shanghai, Guangzhou, Wuhan, Chengdu, Hangzhou, Tianjin, and Nanjing, most cities are at a relatively low level of smart city development. Second, based on the spatial pattern, cities in the coastland are at a relatively higher level of smart city development than those in the inland. Municipalities and provincial capitals are at an obviously higher smart development level than the other cities. Third, from the coordination perspective, five sub-systems are not coordinated well with more than 70% cities showing moderate- to low-level coordination. Overall, the average development level of smart education and smart healthcare are the lowest among all sub-systems. More than 80% of cities have disadvantages in the two sub-systems. Based on these findings, this paper provides some policy implications for the future development of cities. The government should pay more attention to the coordination of sub-systems, such as smart education and smart healthcare. For smart transport, most cities have already had a high level of development, and the efficiency and fairness of transport development will be more important in the future. Innovation and global development have become the key factors restricting the development of smart economy and should be considered in future policy-making. In addition, government and the relevant departments should strengthen the top-level design, module construction, and index statistics of the smart management.
DU Delin , HUANG Jie , WANG Jiaoe . Assessment of Smart City Development Status in China based on Multi-source Data[J]. Journal of Geo-information Science, 2020 , 22(6) : 1294 -1306 . DOI: 10.12082/dqxxkx.2020.190702
表1 智慧城市指标体系评价重点对比Tab. 1 A comparison of focuses insmart city assessment index systems |
| 指标 | IBM | 欧盟 | IESE | Frost & Sullivan | Cohen | 中国标准 | 总计 |
|---|---|---|---|---|---|---|---|
| 政府/治理/管理 | √ | √ | √ | √ | √ | 5 | |
| 能源 | √ | √ | 2 | ||||
| 建筑 | √ | √ | √ | √ | 4 | ||
| 交通/移动 | √ | √ | √ | √ | √ | √ | 6 |
| 基础设施 | √ | √ | √ | √ | 4 | ||
| 科技 | √ | √ | 2 | ||||
| 医疗 | √ | √ | √ | 3 | |||
| 市民/人力/教育 | √ | √ | √ | √ | √ | √ | 6 |
| 经济 | √ | √ | √ | √ | √ | 5 | |
| 环保 | √ | √ | √ | 3 | |||
| 国际影响力 | √ | 1 | |||||
| 社会凝聚力 | √ | 1 | |||||
| 公共服务 | √ | √ | √ | 3 | |||
| 社会保障 | √ | √ | 2 |
表2 智慧城市评价指标体系Tab. 2 The smart city assessment index system |
| 一级 指标 | 二级 指标 | 三级指标 | 一级 指标 | 二级 指标 | 三级指标 | ||||
|---|---|---|---|---|---|---|---|---|---|
| 指标名称 | 编号 | 权重 | 指标名称 | 编号 | 权重 | ||||
| 智慧 经济 A1 | 经济发展活力指数B1 | GDP总量 | C1 | 0.073 | 智慧 教育 A4 | 高等教育优质指数B11 | 双一流学校数量 | C38 | 0.027 |
| GDP增长率 | C2 | 0.035 | 普通高等学校专任教师数 | C39 | 0.111 | ||||
| 人均GDP | C3 | 0.104 | 普通高等学校在校生数 | C40 | 0.118 | ||||
| 第三产业产值 | C4 | 0.055 | 普通高等学校师生比 | C41 | 0.029 | ||||
| 第二产业产值 | C5 | 0.104 | 义务教育普及指数B12 | 普通中学专任教师数 | C42 | 0.050 | |||
| 二三产业比例 | C6 | 0.047 | 普通小学专任教师数 | C43 | 0.052 | ||||
| 人民生活水平指数B2 | 城镇人均可支配收入 | C7 | 0.117 | 每万人普通中学数量 | C44 | 0.067 | |||
| 农村居民人均可支配收入 | C8 | 0.049 | 每万人普通小学数量 | C45 | 0.099 | ||||
| 创新能力指数B3 | R&D内部经费支出 | C9 | 0.042 | 普通中学师生比 | C46 | 0.05 | |||
| R&D人员数量 | C10 | 0.047 | 普通小学师生比 | C47 | 0.105 | ||||
| 专利授权量 | C11 | 0.063 | 职业技术教育发展指数B13 | 中等职业教育学校数 | C48 | 0.103 | |||
| 每亿元GDP专利授权量 | C12 | 0.079 | 中等职业教育专任教师数 | C49 | 0.091 | ||||
| 每万人专利授权量 | C13 | 0.097 | 中等职业教育在校生人数 | C50 | 0.063 | ||||
| 商标注册量 | C14 | 0.040 | 中等职业教育师生比 | C51 | 0.035 | ||||
| 全球化发展 指数B4 | 进出口贸易总额 | C15 | 0.048 | 智慧 管理 A5 | 通信网络高效化指数B14 | 移动电话用户数 | C52 | 0.100 | |
| 智慧 交通 A2 | 城市对外交通发展指数B5 | 机场* | C16 | 0.153 | 互联网宽带接入用户数 | C53 | 0.103 | ||
| 国际机场* | C17 | 0.141 | 移动电话用户比例 | C54 | 0.072 | ||||
| 高铁站* | C18 | 0.109 | 互联网宽带接入用户比例 | C55 | 0.056 | ||||
| 高速公路* | C19 | 0.002 | 电信业务收入 | C56 | 0.044 | ||||
| 港口* | C20 | 0.132 | 城市管理指数B15 | 建成区绿化覆盖率 | C57 | 0.067 | |||
| 高铁发车量 | C21 | 0.024 | 人均公园绿地面积 | C58 | 0.049 | ||||
| 航班吞吐数量 | C22 | 0.017 | 污水处理厂集中处理率 | C59 | 0.054 | ||||
| 城市交通便捷指数B6 | 地铁里程 | C23 | 0.012 | 生活垃圾无害化处理率 | C60 | 0.052 | |||
| 城市公路里程 | C24 | 0.025 | 电子政务信息化指数B16 | 百度搜索年均指数 | C61 | 0.118 | |||
| 建成区路网密度 | C25 | 0.018 | 市政府政务公开网站* | C62 | 0.011 | ||||
| 互联网+交通普及度* | C26 | 0.159 | 居民素质指数B17 | 城镇人口比重 | C63 | 0.108 | |||
| 城市交通拥挤指数— | C27 | 0.040 | 每万人高校在校生人数 | C64 | 0.166 | ||||
| 快递物流时效指数B7 | 顺丰可达* | C28 | 0.002 | ||||||
| 小区智能快递提取点* | C29 | 0.166 | |||||||
| 智慧 医疗 A3 | 就医可达性指数B8 | 百万人医院数 | C30 | 0.122 | |||||
| 百万人医院床位数 | C31 | 0.103 | |||||||
| 百万人医师数 | C32 | 0.086 | |||||||
| 城镇职工基本医疗保险参保人数 | C33 | 0.097 | |||||||
| 高质量就医指数B9 | 三甲医院比重 | C34 | 0.254 | ||||||
| 三甲医院数量 | C35 | 0.113 | |||||||
| 养老普惠性指数B10 | 养老院数量 | C36 | 0.109 | ||||||
| 城镇职工基本养老保险参保人数 | C37 | 0.116 | |||||||
注:表中权重根据3.1节计算而得;*为逻辑数据,即0/1;—为负向指标,其余为正向指标。 |
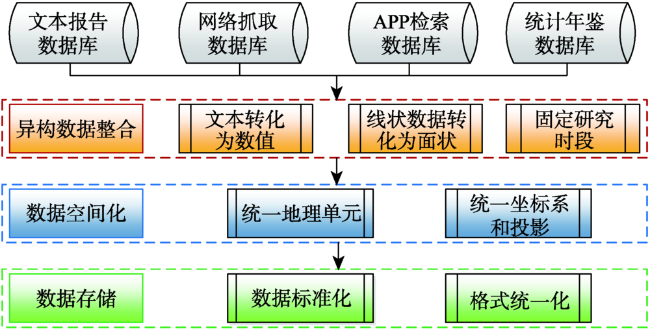
表3 智慧城市评价指标数据来源Tab. 3 Data source of the smart city assessment index |
| 数据类型 | 指标 | 数据来源 |
|---|---|---|
| 文本报告数据 | C14、C27 | 《中国商标品牌战略年度发展报告》[33]、《中国主要城市交通分析报告》[34] |
| 网络抓取数据 | C16-C22、C34-C36、C38、C61、C62 | 12306铁路服务网、Flightradar24网站、国家卫健委网站、教育部官网、养老网、各地政府公开网站、百度检索等 |
| APP数据检索 | C26、C28、C29 | 支付宝、ofo/摩拜等共享单车APP、百度地图等 |
| 统计数据 | C1-C13、C15、C23-C25、C30-C33、C37、C39-C60、C63、C64 | 《中国城市统计年鉴》[35]、《中国城市建设统计年鉴》[36]、《从统计看民航》[37]、各省市的统计年鉴和国民经济与社会发展统计公报等 |
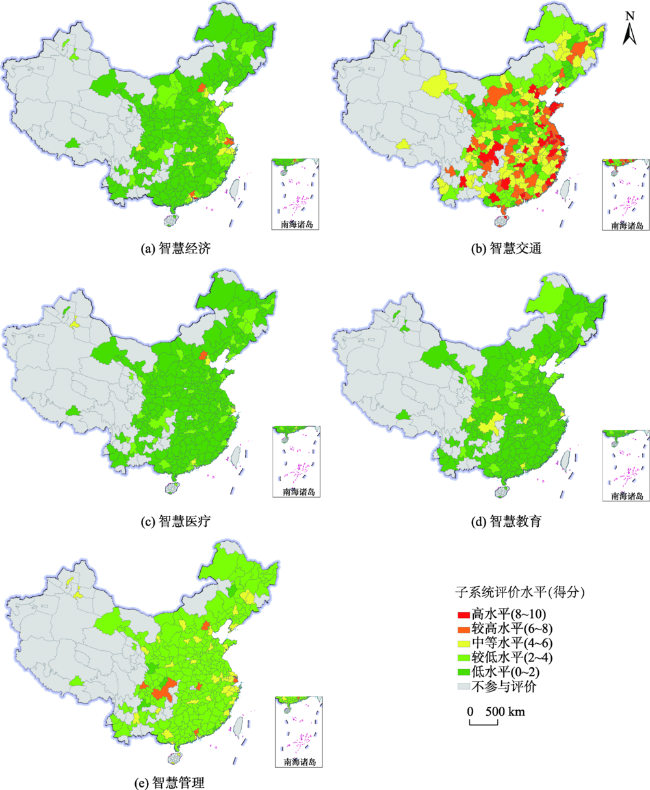
表4 2017年中国智慧城市综合评价结果统计特征Tab. 4 Statistics of evaluation results ofChinesesmart city assessment index system in 2017 |
| 统计指标 | 智慧经济 | 智慧交通 | 智慧医疗 | 智慧教育 | 智慧管理 | 综合系统 |
|---|---|---|---|---|---|---|
| 平均值 | 1.90 | 4.62 | 1.31 | 1.58 | 3.31 | 12.71 |
| 最大值 | 8.16 | 9.43 | 6.83 | 5.48 | 6.92 | 35.68 |
| 最小值 | 0.63 | 0.48 | 0.18 | 0.67 | 1.72 | 5.55 |
| 变异系数 | 0.62 | 0.53 | 0.73 | 0.47 | 0.26 | 0.42 |
表5 2017年中国分类城市数量和占比统计Tab. 5 Statistics of city numbers and proportions based on thedevelopment levelsin China in 2017 (个(%)) |
| 类型 | 综合系统 | 智慧经济 | 智慧交通 | 智慧医疗 | 智慧教育 | 智慧管理 |
|---|---|---|---|---|---|---|
| 高水平 | 0(0.0) | 1(0.3) | 32(11.2) | 0(0.0) | 0(0.0) | 0(0.0) |
| 较高水平 | 3(1.0) | 4(1.4) | 54(18.9) | 1(0.3) | 0(0.0) | 6(2.1) |
| 中等水平 | 28(9.8) | 14(4.9) | 74(25.9) | 4(1.4) | 8(2.8) | 40(14.0) |
| 较低水平 | 152(53.1) | 60(21.0) | 83(29.0) | 40(14.0) | 38(13.3) | 235(82.2) |
| 低水平 | 103(36.0) | 207(72.4) | 43(15.0) | 241(84.3) | 240(83.9) | 5(1.7) |
表6 2017年智慧城市评价得分前20名城市Tab. 6 Top 20 cities based on the evaluation results in China in 2017 |
| 指标 | 城市 |
|---|---|
| 综合系统 | 北京、上海、广州、重庆、深圳、武汉、成都、天津、杭州、南京、西安、郑州、长沙、南昌、济南、青岛、厦门、宁波、苏州、昆明 |
| 智慧经济 | 深圳、北京、上海、苏州、广州、杭州、东莞、宁波、无锡、天津、南京、佛山、中山、成都、绍兴、珠海、武汉、青岛、长沙、常州 |
| 智慧交通 | 广州、北京、上海、南京、深圳、武汉、扬州、重庆、桂林、天津、无锡、揭阳、杭州、成都、济南、常州、青岛、徐州、厦门、长沙 |
| 智慧医疗 | 北京、上海、广州、天津、乌鲁木齐、东莞、武汉、佛山、南京、杭州、太原、西宁、厦门、深圳、南昌、成都、西安、贵阳、沈阳、长春 |
| 智慧教育 | 重庆、郑州、北京、广州、西安、武汉、成都、上海、石家庄、天津、南宁、哈尔滨、昆明、太原、长春、南京、济南、沈阳、杭州、长沙 |
| 智慧管理 | 广州、北京、上海、成都、重庆、武汉、郑州、西安、南京、杭州、南昌、兰州、长沙、苏州、济南、天津、乌鲁木齐、深圳、珠海、昆明 |
| [1] |
|
| [2] |
吴志峰, 柴彦威, 党安荣, 等. 地理学碰上大数据:热反应与冷思考[J]. 地理研究, 2016,34(12):2207-2221.
[
|
| [3] |
曹阳, 甄峰. 基于智慧城市的可持续城市空间发展模型总体架构[J]. 地理科学进展, 2015,34(4):430-437.
[
|
| [4] |
中共中央国务院.国家新型城镇化规划(2014-2020年)[EB/OL]. http://www.gov.cn/gongbao/content/2014/content_2644805.htm, 2014.
|
| [5] |
国家发展改革委,中央网信办.关于继续开展新型智慧城市建设评价工作深入推动新型智慧城市健康快速发展的通知[EB/OL]. http://info.hebei.gov.cn/eportal/fileDir/hbszfxxgk/resource/cms/2019/01/2019012311124372140.pdf, 2019.
|
| [6] |
|
| [7] |
|
| [8] |
|
| [9] |
|
| [10] |
|
| [11] |
刘杨, 龚烁, 刘晋媛. 欧美智慧城市最新实践与参考[J].上海城市规划,2018(1):12-19.
[
|
| [12] |
甄峰, 席广亮, 秦萧. 基于地理视角的智慧城市规划与建设的理论思考[J]. 地理科学进展, 2015,34(4):402-409.
[
|
| [13] |
柴彦威, 申悦, 陈梓烽. 基于时空间行为的人本导向的智慧城市规划与管理[J]. 国际城市规划, 2014,29(6):31-37.
[
|
| [14] |
王丰龙, 王冬根. 主观幸福感度量研究进展及其对智慧城市建设的启示[J]. 地理科学进展, 2015,34(4):482-493.
[
|
| [15] |
马捷, 葛岩, 蒲泓宇, 等. 基于多源数据的智慧城市数据融合框架[J]. 图书情报工作, 2019,63(15):6-12.
[
|
| [16] |
滕吉文, 司芗, 刘少华. 当代新型智慧城市属性、理念、构筑与大数据[J]. 科学技术与工程, 2019,19(36):1-20.
[
|
| [17] |
费明明, 黄健. 中国城市化进程与智慧城市建设的探讨[J]. 资源与产业, 2013,15(3):100-104.
[
|
| [18] |
巫细波, 杨再高. 智慧城市理念与未来城市发展[J]. 城市发展研究, 2010,17(11):56-60.
[
|
| [19] |
韦颜秋, 李瑛. 新型智慧城市建设的逻辑与重构[J]. 城市发展研究, 2019,26(6):108-113.
[
|
| [20] |
|
| [21] |
|
| [22] |
|
| [23] |
|
| [24] |
尹丽英, 张超. 中国智慧城市理论研究综述与实践进展[J].电子政务,2019(1):111-121.
[
|
| [25] |
|
| [26] |
Smartcity. IESE uncovers world's smartest cities of the year 2018[EB/OL]. https://www.smartcity.press/iese-top-10-smart-cities-2018/.
|
| [27] |
Frost & Sullivan. IBM 2014 global best-in-class smart city integrator visionaryinnovation leadership award[R]. Palgrave Macmillan, 2014: 1-7.
|
| [28] |
|
| [29] |
中华人民共和国住房和城乡建设部办公厅.住房城乡建设部办公厅关于开展国家智慧城市试点工作的通知[EB/OL]. http://www.mohurd.gov.cn/wjfb/201212/t20121204_212182.html, 2012.
[ General Office of the Ministry of Housing and Urban-Rural Development of the People's Republic of China. Notice of the General Office of the Ministry of Housing and Urban-Rural Development on the pilot work of national smart cities [EB/OL]. http://www.mohurd.gov.cn/wjfb/201212/t20121204_212182.html, 2012.]
|
| [30] |
国家发展改革委办公厅,中央网信办秘书局,国家标准委办公室.关于组织开展新型智慧城市评价工作务实推动新型智慧城市健康快速发展的通知[EB/OL]. http://www.smartcityjs.com/index.php?route=i- nformation/news&news_id=6, 2016.
[ General Office of the National Development and Reform Commission, Secretariat of Cyberspace Administration of China, Standardardization Administration of the People's Republic of China. Notice on organizing the evaluation of new smart city and promoting the healthy and rapid development of new smart city [EB/OL]. http://www.smartcityjs.com/index.php?route=i- nformation/news&news_id=6, 2016.]
|
| [31] |
陈桂龙. 中国智慧城市发展水平评估报告发布——我国智慧城市建设离散趋势显著[J].中国建设信息化,2016(23):38-47.
[
|
| [32] |
中华人民共和国国家质量监督检验检疫总局,中国国家标准化管理委员会.智慧城市评价模型及基础评价指标体系第1部分:总体框架及分项评价指标制定的要求[EB/OL]. http://openstd.samr.gov.cn/bzgk/gb/newGbInfo? h-cno=94A3D226FB1D802A5F2E348B0C4BEDBC, 2017.
[ General Administration of Quality Supervision, Inspection and Quarantine of the People's Republic of China, Standardardization Administration of the People's Republic of China.Smart city evaluation model and basic evaluation index system, Part1: requirements for overall framework and sub evaluation index formulation [EB/OL]. http://openstd.samr.gov.cn/bzgk/gb/newGbInfo? h-cno=94A3D226FB1D802A5F2E348B0C4BEDBC, 2017.]
|
| [33] |
国家工商行政管理总局商标局商标评审委员会. 中国商标品牌战略年度发展报告(2017版)[R].北京: 中国工商出版社, 2018.
[ Trademark Office/Trademark Review and Adjudication Board of The State Administration for Industry and Commerce. Annual development report on China's trademark strategy 2017[R]. Beijing: China Industry & Commerce Press, 2018. ]
|
| [34] |
高德地图. 2017年度中国主要城市交通分析报告[R]. 北京:高德地图, 2018.
[ AutoNavi Traffic. Traffic analysis reports for major cities in China[R]. Beijing: AutoNavi Traffic, 2018. ]
|
| [35] |
国家统计局城市社会经济调查司. 中国城市统计年鉴[M]. 北京: 中国统计出版社, 2018.
[ Urban Social and Economic Investigation Department of National Provincial Bureau of Statistics. China City Statistical Yearbook[M]. Beijing: China Statistics Press, 2018. ]
|
| [36] |
中华人民共和国住房和城乡建设部. 中国城市建设统计年鉴[M]. 北京: 中国统计出版社, 2017.
[ Ministry of Housing and Urban-Rural Development of the People's Republic of China. China Urban Construction Statistical Yearbook[M]. Beijing: China Statistics Press, 2017. ]
|
| [37] |
中国民用航空局发展计划司. 从统计看民航[M]. 北京: 中国民航出版社, 2018.
[ Development and planning department of CAAC. Statistical data oncivil aviation of China[M]. Beijing: China Civil Aviation Publishing House: 2018. ]
|
| [38] |
于伟, 吕晓, 宋金平. 山东省城镇化包容性发展的时空格局[J]. 地理研究, 2018,37(2):319-332.
[
|
| [39] |
姜磊, 柏玲, 吴玉鸣. 中国省域经济、资源与环境协调分析——兼论三系统耦合公式及其扩展形式[J]. 自然资源学报, 2017,32(5):788-799.
[
|
| [40] |
马丽, 金凤君, 刘毅. 中国经济与环境污染耦合度格局及工业结构解析[J]. 地理学报, 2012,67(10):1299-1307.
[
|
/
| 〈 |
|
〉 |