
Journal of Geo-information Science >
Correction of DMSP/OLS Stable Night Light Images in China
Received date: 2019-07-25
Request revised date: 2019-11-11
Online published: 2020-10-25
Supported by
National Natural Science Foundation of China(41430637)
Copyright
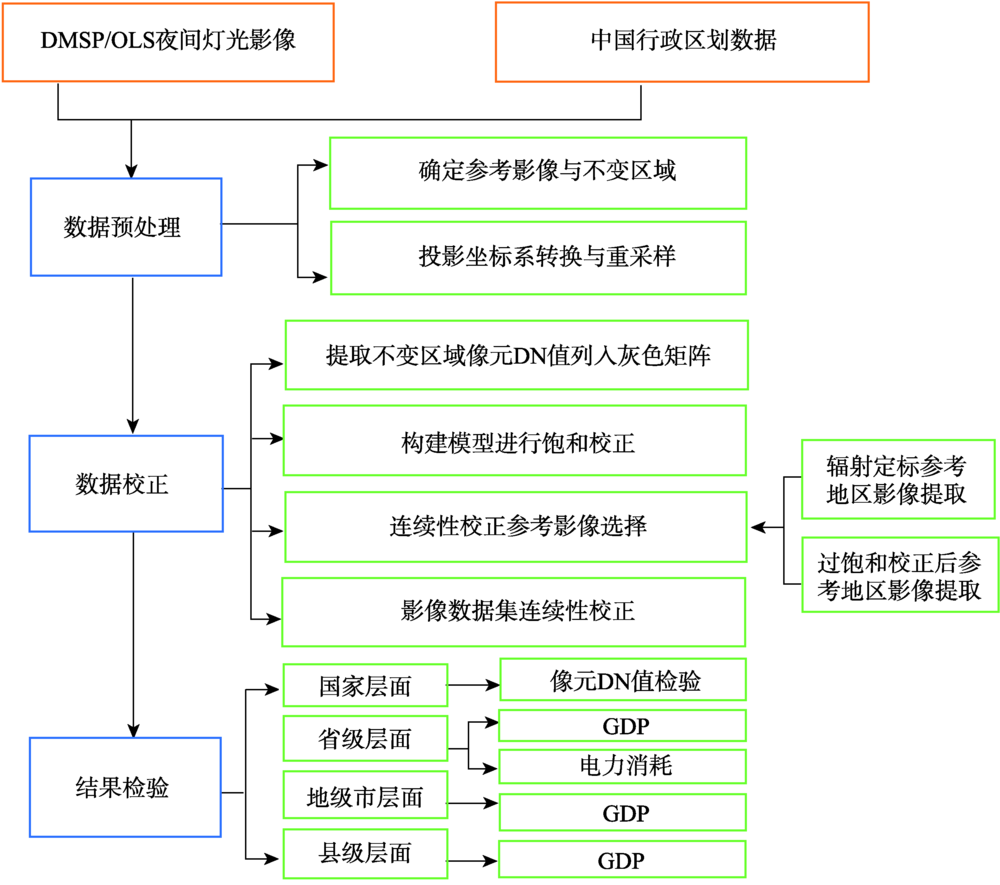
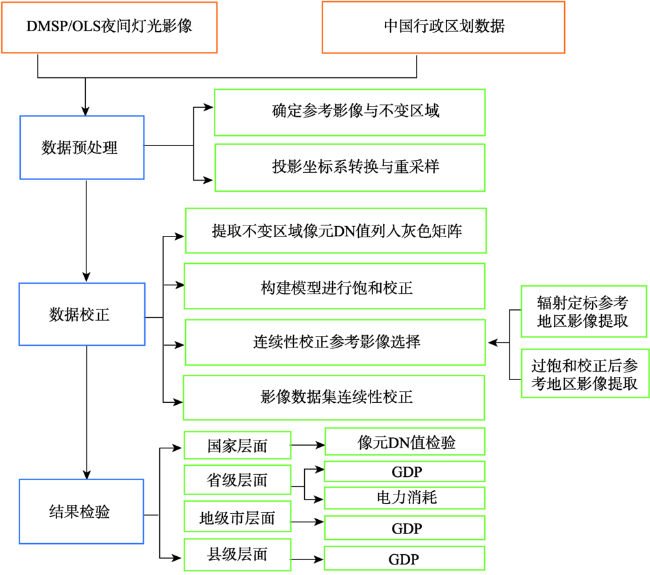
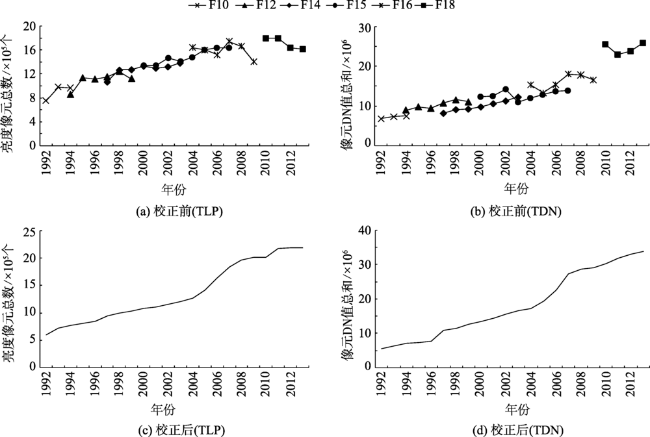
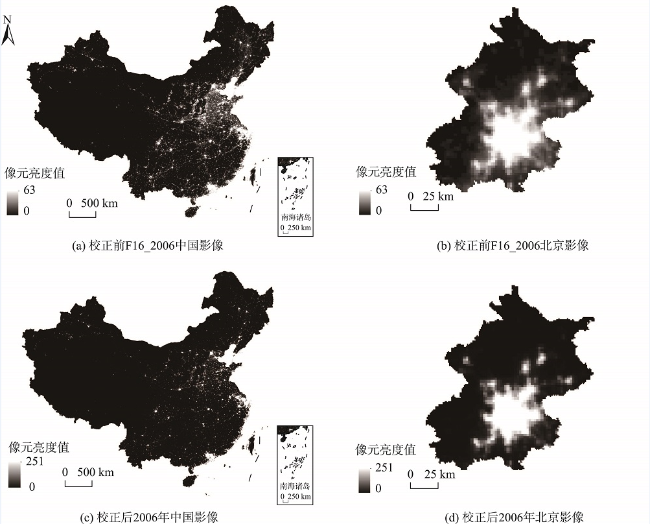
With the rapid development of remote sensing technology, the night light image of Defense Meteorological Satellite Program Scanning System (DMSP/OLS) has been more and more applied in the research of humanist economics. Since there are many problems in the original images, such as the saturation of DN value and inter-annual discontinuity, it is necessary to correct those data before using them. "Traditional invariant region method" is a widely-using correction method, but there are still some problems, such as not taking into account the weak changes from the prospect of a long-time scale of the target region and the selection of the reference year in a continuous correction. In this paper, the traditional invariant region method was improved. In order to reduce the impact on correction results, caused by the small changes of the target region in a long time scale, and to improve the saturation of the original images, the stable night light images of DMSP/OLS were saturation corrected with the help of selecting three group data (F12_1999, f14-15_2003 and F16_2006) as reference images. By the comparison between saturation corrected images and reference images, the reasonable reference year, F15_2006 (after the saturation correction), with the minimum error was selected, so as to carry out the continuous correction of the saturation corrected images. To verify the correction precision of images, in this paper, pixel DN value test was carried out at the national level. And linear regression test was carried out in the corresponding TDN value between GDP at the provincial level, electricity consumption at the provincial level, GDP at the prefecture-level and at the county level, at the same time, compared with the other published correction results such as Cao Z Y[25], results shew that the average fit R² between the improved DMSP/OLS stable night light images TDN and the city's GDP was 0.85 while the average fit R² between the results with the traditional invariant region method and with city GDP was only 0.53. As time goes by, the fitting degree of the traditional invariant region method gradually decreased to 0.40 in 2013. However, the fitting degree using the improved correction method did not decrease. In 2013, the R² was 0.88, which indicated that compared with the traditional invariant region method, the correction accuracy was significantly improved and the saturation problem was greatly improved. At the same time, the fitting degree of TDN and GDP on the county scale was about 0.6, indicating that the night light image data set on the county scale also had certain applicability. However, this approach did not completely solve the problem of pixel saturation. How to solve this problem perfectly is the core in the application research of noctilucent data in the future.
ZHANG Baifa , MIAO Changhong , SONG Yaning , WANG Juanjuan . Correction of DMSP/OLS Stable Night Light Images in China[J]. Journal of Geo-information Science, 2020 , 22(8) : 1679 -1691 . DOI: 10.12082/dqxxkx.2020.190397
表1 鹤岗市各年份原始影像DN值线性相关关系Tab. 1 linear correlation between DN values of original images in Hegang city in each year |
| 影像1 | 影像2 | R² |
|---|---|---|
| F12_1992 | F14_2003 | 0.8296 |
| F12_1992 | F15_2003 | 0.8194 |
| F14_2003 | F18_2013 | 0.8067 |
| F15_2003 | F18_2013 | 0.8040 |
| F12_1992 | F18_2013 | 0.7849 |
表2 每一期影像的相互校正模型参数Tab. 2 Mutual correction model parameters of each phase of images |
| 参考影像 | 卫星序号 | 年份 | a | b | c | R2 |
|---|---|---|---|---|---|---|
| F12_1999 | F10 | 1992 | 0.0289 | 0.4592 | 0.5964 | 0.9141 |
| 1993 | 0.0337 | 0.6344 | 0.2009 | 0.9317 | ||
| 1994 | 0.0297 | 0.6427 | 0.3139 | 0.9462 | ||
| F12 | 1994 | 0.0268 | 0.5495 | 0.6740 | 0.9118 | |
| 1995 | 0.0251 | 0.5003 | 0.4986 | 0.9197 | ||
| 1996 | 0.0282 | 0.4277 | 0.6795 | 0.9169 | ||
| 1997 | 0.0261 | 0.6148 | 0.5313 | 0.9223 | ||
| 1998 | 0.0243 | 0.4029 | 0.5352 | 0.9237 | ||
| 1999 | 0.0233 | 0.5681 | 0.4711 | 0.9295 | ||
| F14-15_2003 | F14 | 1997 | 0.0718 | 1.0731 | 0.9221 | 0.8809 |
| 1998 | 0.0698 | 0.6516 | 0.6792 | 0.8673 | ||
| 1999 | 0.0703 | 0.9668 | 0.3548 | 0.8886 | ||
| 2000 | 0.0614 | 0.3592 | 0.7600 | 0.8686 | ||
| 2001 | 0.0539 | 0.5547 | 0.6327 | 0.8660 | ||
| 2002 | 0.0481 | 0.5704 | 0.7558 | 0.8253 | ||
| 2003 | 0.0450 | 0.7220 | 0.5305 | 0.8504 | ||
| F15 | 2000 | 0.0604 | 0.0747 | 0.9920 | 0.8028 | |
| 2001 | 0.0583 | 0.2804 | 0.8407 | 0.8267 | ||
| 2002 | 0.0533 | 0.2138 | 0.6170 | 0.8584 | ||
| 2003 | 0.0521 | 0.7015 | 0.8924 | 0.8551 | ||
| 2004 | 0.0555 | 0.2121 | 0.9536 | 0.8418 | ||
| 2005 | 0.054 | 0.3883 | 0.8141 | 0.8012 | ||
| 2006 | 0.0606 | 0.1536 | 0.9569 | 0.8488 | ||
| 2007 | 0.0586 | 0.5257 | 0.6138 | 0.8426 | ||
| F16_2006 | F16 | 2004 | 0.0313 | 0.3529 | 0.3995 | 0.8252 |
| 2005 | 0.0302 | 0.7243 | 0.3269 | 0.8515 | ||
| 2006 | 0.0323 | 0.6195 | 0.3945 | 0.8639 | ||
| 2007 | 0.0320 | 0.5127 | 0.3281 | 0.8626 | ||
| 2008 | 0.0345 | 0.3021 | 0.3709 | 0.8275 | ||
| 2009 | 0.0360 | -0.0223 | 0.5689 | 0.7892 | ||
| F18 | 2010 | 0.0335 | -0.2870 | 0.6554 | 0.7384 | |
| 2011 | 0.0302 | 0.0554 | 0.5498 | 0.7219 | ||
| 2012 | 0.0367 | -0.1889 | 0.6730 | 0.7997 | ||
| 2013 | 0.0335 | -0.2636 | 0.7255 | 0.7279 |
表3 校正后影像2006年与辐射定标2006年城市亮度平均值误差Tab. 3 Error of urban brightness mean value between corrected images in 2006 and radiometric calibration in 2006 |
| |误差|<5 | |误差|<3 | |误差|<1 | |误差|<0.1 | |误差|>5 | |
|---|---|---|---|---|---|
| 比例/% | 96.68 | 93.63 | 67.31 | 11.91 | 3.32 |
表4 省级尺度上夜间灯光TDN与GDP线性回归拟合度Tab. 4 Linear regression fitting degree of night light TDN and GDP at provincial scale |
| 年份 | 校正前 | 校正后 | |||||
|---|---|---|---|---|---|---|---|
| F10 | F12 | F14 | F15 | F16 | F18 | ||
| 1992 | 0.7744 | 0.7441 | |||||
| 1993 | 0.6613 | 0.7468 | |||||
| 1994 | 0.6642 | 0.7406 | 0.7508 | ||||
| 1995 | 0.7423 | 0.7691 | |||||
| 1996 | 0.7319 | 0.7578 | |||||
| 1997 | 0.7457 | 0.7545 | 0.7720 | ||||
| 1998 | 0.7549 | 0.7621 | 0.7880 | ||||
| 1999 | 0.7811 | 0.7938 | 0.7754 | ||||
| 2000 | 0.7470 | 0.7767 | 0.7964 | ||||
| 2001 | 0.7692 | 0.7647 | 0.8266 | ||||
| 2002 | 0.8205 | 0.7894 | 0.8811 | ||||
| 2003 | 0.8440 | 0.8581 | 0.8941 | ||||
| 2004 | 0.8470 | 0.7884 | 0.8967 | ||||
| 2005 | 0.8188 | 0.7984 | 0.9135 | ||||
| 2006 | 0.8395 | 0.8173 | 0.9163 | ||||
| 2007 | 0.8461 | 0.8210 | 0.9179 | ||||
| 2008 | 0.8180 | 0.9126 | |||||
| 2009 | 0.7288 | 0.8944 | |||||
| 2010 | 0.7263 | 0.8925 | |||||
| 2011 | 0.8021 | 0.8843 | |||||
| 2012 | 0.7623 | 0.8660 | |||||
| 2013 | 0.7927 | 0.8694 | |||||
表5 省级层面夜间灯光影像校正前和校正后TDN与电力消费量线性回归拟合度Tab. 5 Linear regression fitting degree of TDN and electricity consumption before and after night light image correction at provincial level |
| 年份 | 校正前 | 校正后 | |||||
|---|---|---|---|---|---|---|---|
| F10 | F12 | F14 | F15 | F16 | F18 | ||
| 2002 | 0.8479 | 0.8372 | 0.8554 | ||||
| 2003 | 0.8711 | 0.8810 | 0.8732 | ||||
| 2004 | 0.8842 | 0.9220 | 0.8778 | ||||
| 2005 | 0.9406 | 0.8354 | 0.9048 | ||||
| 2006 | 0.8536 | 0.8449 | 0.8791 | ||||
| 2007 | 0.8716 | 0.8655 | 0.8979 | ||||
| 2008 | 0.8572 | 0.8947 | |||||
| 2009 | 0.7550 | 0.8736 | |||||
| 2010 | 0.7263 | 0.8759 | |||||
| 2011 | 0.8021 | 0.8581 | |||||
| 2012 | 0.7623 | 0.8697 | |||||
| 2013 | 0.7927 | 0.8789 | |||||
表6 市级层面夜间灯光影像校正前与校正后TDN与GDP线性回归拟合度Tab. 6 Linear regression fitting degree of TDN and GDP before and after municipal level night light image correction |
| 年份 | 校正前 | 校正后 | |||||
|---|---|---|---|---|---|---|---|
| F10 | F12 | F14 | F15 | F16 | F18 | ||
| 1992 | — | — | |||||
| 1993 | — | — | |||||
| 1994 | 0.6389 | 0.6838 | 0.7612 | ||||
| 1995 | 0.6732 | 0.7639 | |||||
| 1996 | 0.6589 | 0.6442 | |||||
| 1997 | 0.6767 | 0.7142 | 0.7875 | ||||
| 1998 | 0.6906 | 0.7191 | 0.8012 | ||||
| 1999 | 0.7069 | 0.7491 | 0.8118 | ||||
| 2000 | 0.7174 | 0.7269 | 0.8308 | ||||
| 2001 | 0.7306 | 0.7249 | 0.8470 | ||||
| 2002 | 0.7975 | 0.7533 | 0.8780 | ||||
| 2003 | 0.8063 | 0.8272 | 0.8877 | ||||
| 2004 | 0.8177 | 0.7471 | 0.8850 | ||||
| 2005 | 0.7931 | 0.7706 | 0.9125 | ||||
| 2006 | 0.7913 | 0.7570 | 0.9112 | ||||
| 2007 | 0.7761 | 0.7366 | 0.9045 | ||||
| 2008 | 0.7430 | 0.9045 | |||||
| 2009 | 0.6667 | 0.9015 | |||||
| 2010 | 0.6548 | 0.8994 | |||||
| 2011 | 0.7101 | 0.8895 | |||||
| 2012 | 0.6790 | 0.8804 | |||||
| 2013 | 0.6829 | 0.8798 | |||||
表7 县域层面夜间灯光影像校正前与校正后TDN与GDP线性回归拟合度Tab. 7 Linear regression fitting degree of TDN and GDP before and after night light image correction at county level |
| 年份 | 校正前 | 校正后 | ||||
|---|---|---|---|---|---|---|
| F12 | F14 | F15 | F16 | F18 | ||
| 1995 | 0.5259 | 0.6260 | ||||
| 2000 | 0.5205 | 0.4955 | 0.6125 | |||
| 2005 | 0.5042 | 0.4944 | 0.6208 | |||
| 2010 | 0.0125 | 0.6116 | ||||
| [1] |
|
| [2] |
|
| [3] |
李德仁, 李熙. 论夜光遥感数据挖掘[J]. 测绘学报, 2015,44(6):591-601.
[
|
| [4] |
李德仁, 李熙. 夜光遥感技术在人道主义灾难评估中的应用[J]. 自然杂志, 2018,40(3):169-176.
[
|
| [5] |
范俊甫, 何惠馨, 胡桃英, 等. 一种叙利亚战争城市破坏程度的评估方法[J]. 测绘科学, 2018,43(9):129-134.
[
|
| [6] |
曹丽琴, 李平湘, 张良培. 基于DMSP/OLS夜间灯光数据的城市人口估算——以湖北省各县市为例[J]. 遥感信息, 2009(1):83-87.
[
|
| [7] |
陈乐, 李郇, 姚尧, 等. 人口集聚对中国城市经济增长的影响分析[J]. 地理学报, 2018,73(6):1107-1120.
[
|
| [8] |
|
| [9] |
王明明, 王卷乐. 基于夜间灯光与土地利用数据的山东省乡镇级人口数据空间化[J]. 地球信息科学学报, 2019,21(5):699-709.
[
|
| [10] |
潘竟虎, 赵宏宇, 董磊磊. 基于DMSP-OLS数据和可持续生计的中国农村多维贫困空间识别[J]. 生态学报, 2018,38(17):1-13.
[
|
| [11] |
沈丹, 周亮, 王培安. 基于夜间灯光数据的六盘山连片特困区贫困空间分异特征分析[J]. 遥感信息, 2018,33(4):42-48.
[
|
| [12] |
林中立, 徐涵秋, 黄绍霖. 基于DMSP/OLS夜间灯光影像的中国东部沿海地区城市扩展动态监测[J]. 地球信息科学学报, 2019,21(7):1074-1085.
[
|
| [13] |
陈昕, 彭建, 刘焱序, 等. 基于DMSP/OLS夜间灯光数据的京津冀地区城市空间扩展与空间关联测度[J]. 地理研究, 2018,37(5):898-909.
[
|
| [14] |
陈晋, 卓莉, 史培军, 等. 基于DMSP/OLS数据的中国城市化过程研究—反映区域城市化水平的灯光指数的构建[J]. 遥感学报, 2003,7(3):168-175.
[
|
| [15] |
高亚红, 顾羊羊, 乔旭宁, 等. 基于夜间灯光数据的南京城镇用地提取[J]. 测绘科学, 2017,42(6):93-98.
[
|
| [16] |
赵晓伟, 孟治国, 郑兴明, 等. 夜间灯光数据的东三省城市群发展特征研究[J]. 测绘科学, 2019(4):1-13.
[
|
| [17] |
杨雪, 张文忠. 基于栅格的区域人居自然和人文环境质量综合评价—以京津冀地区为例[J]. 地理学报, 2016,71(12):2141-2154.
[
|
| [18] |
刘焱序, 吴文恒, 温晓金, 等. 晋陕蒙能源区城镇化过程及其对生态环境的影响[J]. 地理研究, 2013,32(11):2009-2020.
[
|
| [19] |
徐翀崎, 李锋, 韩宝龙, 等. 动态适应性生态经济区划模型及其应用[J]. 生态学报, 2017,37(5):1740-1748.
[
|
| [20] |
张鹏强, 余旭初, 刘智, 等. 多时相遥感图像相对辐射校正[J]. 遥感学报, 2006,10(3):339-344.
[
|
| [21] |
|
| [22] |
|
| [23] |
邹进贵, 陈艳华, 田径, 等. 基于ArcGIS的DMSP/OLS夜间灯光影像校正模型的构建[J]. 测绘地理信息, 2014,39(4):33-37.
[
|
| [24] |
张梦琪, 何宗宜, 樊勇. DMSP/OLS稳定夜间灯光影像的校正方法[J]. 测绘通报, 2017(12):58-62.
[
|
| [25] |
曹子阳, 吴志峰, 匡耀求, 等. DMSP/OLS夜间灯光影像中国区域的校正及应用[J]. 地球信息科学学报, 2015,17(9):1092-1102.
[
|
| [26] |
吴健生, 李双, 张曦文. 中国DMSP-OLS长时间序列夜间灯光遥感数据饱和校正研究[J]. 遥感学报, 2018,22(4):621-632.
[
|
| [27] |
卓莉, 张晓帆, 郑璟, 等. 基于EVI指数的DMSP/OLS夜间灯光数据去饱和方法[J]. 地理学报, 2015,70(8):1339-1350.
[
|
| [28] |
郑子豪, 陈颖彪, 吴志峰, 等. 单元路网长度的DMSP/OLS夜间灯光数据去饱和方法[J]. 遥感学报, 2018,22(1):161-173.
[
|
| [29] |
National Geophysical Data Center[DB/OL]. https://ngdc.noaa.gov/eog/dmsp.
|
| [30] |
国家基础地理信息中心. 全国地理信息资源目录服务系统[DB/OL]. http://www.webmap.cn/commres.do?method=data Download.
[ National Geomatics Center of China. National Catalogue Service for Geographic Information[DB/OL]. http://www.webmap.cn/commres.do?method=data Download.]
|
| [31] |
中国经济社会大数据平台. 统计年鉴[EB/OL]. http://data.cnki.net/Yearbook/Navi?type=type&code=A.
[ Economic and Social Big Data Research Platform of China. Statistical Yearbook[EB/OL]. http://data.cnki.net/Yearbook/Navi?type=type&code=A.]
|
| [32] |
|
| [33] |
|
/
| 〈 |
|
〉 |