
Journal of Geo-information Science >
Three-dimensional Dynamic Noise Map based on Traffic Trajectory Data
Received date: 2020-03-25
Request revised date: 2020-05-05
Online published: 2020-11-25
Supported by
National Natural Science Foundation of China(41531180)
Supported by the National Key Research and Development Program of China(2017YFB0503500)
Copyright
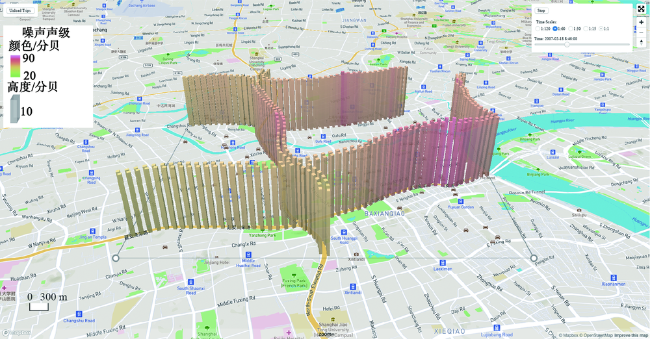
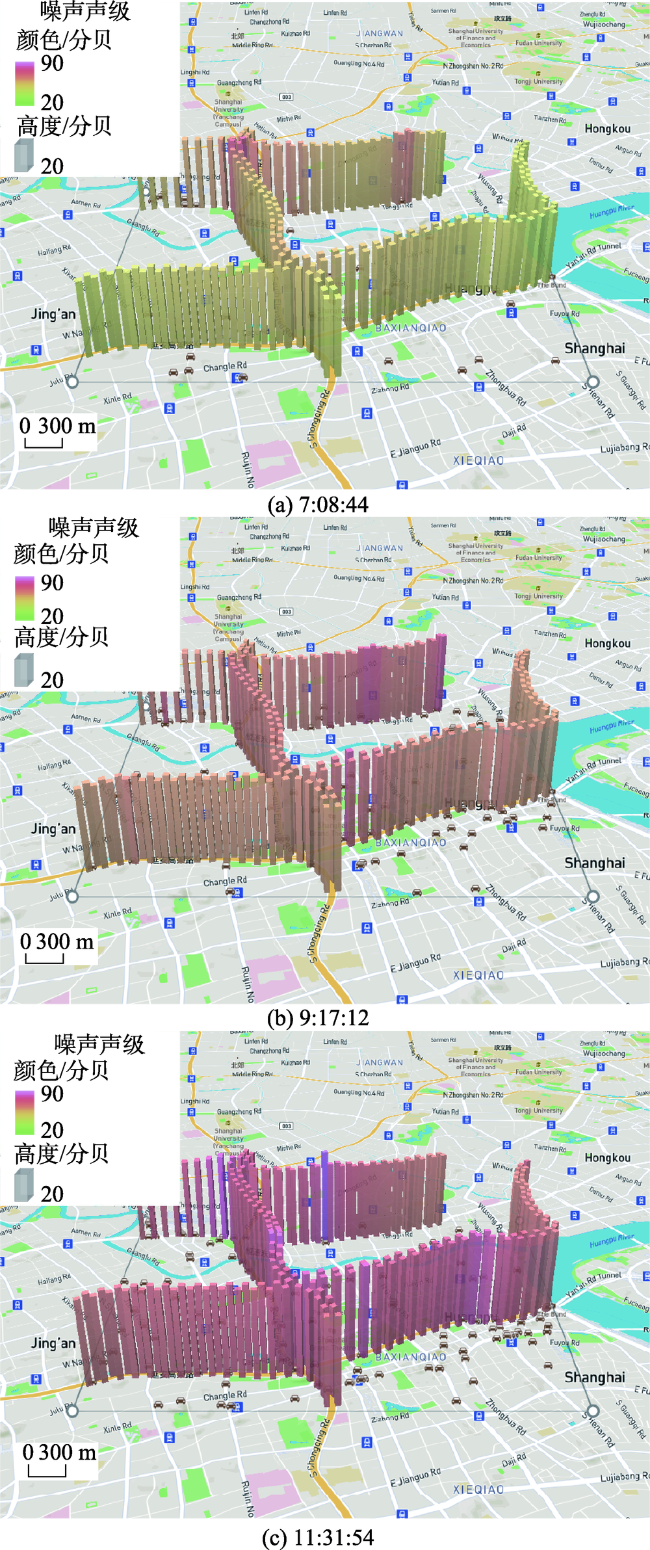
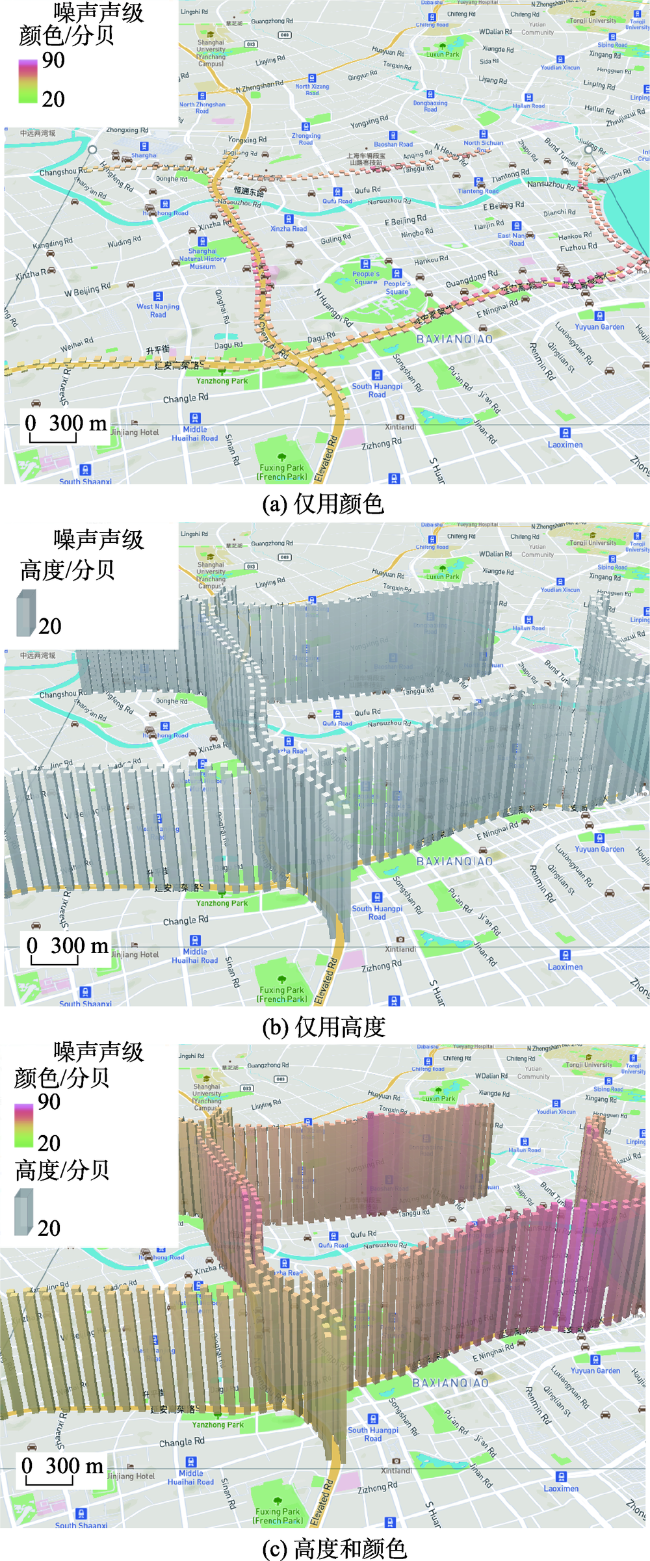
The key characteristics of noise information are spatial propagation and distance attenuation. Traditional noise maps are dominated by two-dimensional and static representations, similar to the heat maps. The researches in the past were focused on the ways to get data or evaluating the accuracy of data, resulting that noise map visualization and noise symbols were less studied. The traditional drawing methods are usually used like color grading which makes noise maps have simple symbolic form such as flat color blocks corresponding to different values. It is difficult to show its spatial features. Thus, this paper proposed a new expression method of noise maps in three-dimensional dynamic visualization for the spatial distribution and intensity change of noise. Based on the Bertin symbol parameters, the new method integrates the characteristics of size, color in the visual variables, and the rate and order of change in the dynamic parameters, and it can convey noise information dynamically by using height-variable and color-changing square bars as noise symbols. Three-dimensional dynamic noise maps can present relevant information on different scales, and they contain corresponding symbol sizes and positioning arrangements in different map levels in order to show the multi-granularity of the maps. So as to represent the attenuation and addition of noise during propagation, gave some examples of a single-point sound source and multi-point sound sources with graphics and data, and multi-level information expression was briefly exemplified. In this paper, we simulated and expressed the road traffic noise in a certain period and area of Huangpu District, Shanghai. In addition, noise data was calculated from traffic noise models and the taxi GPS trajectory data. The specific noise map was deployed in Web browser, using the base map provided by Mapbox. As expected, the three-dimensional dynamic expression expands the performance dimension of noise data. Compared with the flat color symbols used in traditional two-dimensional noise maps, multi-parameter stereo symbols can not only accurately describe the distribution and intensity of noise, but also improve the audience's interest and concentration from the visual perception. Simultaneously, compared with the static maps which can only show the final results, the three-dimensional dynamic noise maps are able to display the processes of information changes, which could help users find subtle anomalies and provide more accurate references for noise prevention and control. Furthermore, three-dimensional dynamic noise maps proposed in this paper can provide a better visual reference for the analysis of spatial rules such as hot spots distribution and transmission trends of noise.

FU Leyi , AI Tinghua , HUANG Li'na , XIN Rui . Three-dimensional Dynamic Noise Map based on Traffic Trajectory Data[J]. Journal of Geo-information Science, 2020 , 22(9) : 1789 -1798 . DOI: 10.12082/dqxxkx.2020.200140
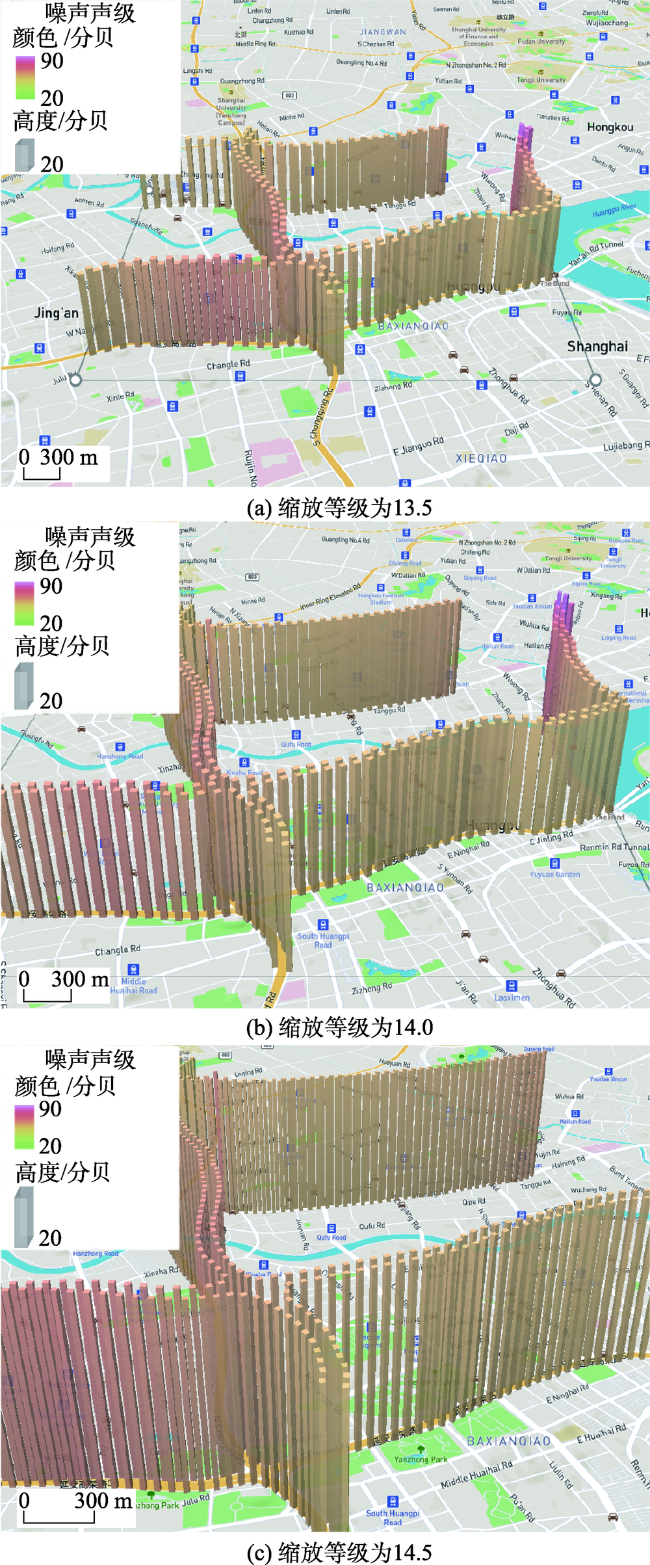
表1 地图缩放等级与像素表达、地图比例尺的对应关系Tab. 1 Correspondence between map zoom levels, pixel expression and map resolutions |
| 缩放等级 | 像素大小/mm | 像素表达/(m/px) | 比例尺 |
|---|---|---|---|
| 13.5 | 0.275 | 5.777 | 1:24563 |
| 14.0 | 0.275 | 4.085 | 1:17369 |
| 14.5 | 0.275 | 2.888 | 1:12281 |
表2 地图缩放等级与符号等分间隔和符号底图尺寸的对应关系Tab. 2 Correspondence between map zoom levels, symbol equal intervals and symbol base map sizes |
| 细节层次 | 缩放等级 | 等分间隔/m | 符号底面正方形边长/m |
|---|---|---|---|
| LOD1 | 13.5 | 120.0 | 50.0 |
| LOD2 | 14.0 | 80.0 | 35.0 |
| LOD3 | 14.5 | 50.0 | 20.0 |
| [1] |
田玉军, 巨天珍, 任正武. 国内城市环境噪声污染研究进展[J]. 重庆环境科学, 2003(3):37-39,49-61.
[
|
| [2] |
|
| [3] |
凡宸, 汪涛, 周波涛. 噪声地图的研究进展[J]. 环境工程, 2016,34(S1):1095-1098.
[
|
| [4] |
|
| [5] |
|
| [6] |
|
| [7] |
|
| [8] |
|
| [9] |
|
| [10] |
|
| [11] |
|
| [12] |
|
| [13] |
|
| [14] |
|
| [15] |
|
| [16] |
丁媛媛. 点源噪声空间扩散模拟研究[D]. 南京:南京师范大学, 2008.
[
|
| [17] |
中华人民共和国环境保护部. HJ2.4-2009环境影响评价技术导则声环境[S]. 北京: 中国环境科学出版社, 2010.
[ Ministry of Environmental Protection of the People’s Republic of China. HJ2.4-2009 Technical guidelines for noise impact assessment [S]. Beijing: China Environmental Science Press, 2010. ]
|
| [18] |
中华人民共和国交通部. JTGB03-2006公路建设项目环境影响评价规范[S]. 北京: 人民交通出版社, 2006.
[ Ministry of Transport of the People's Republic of China. JTGB03-2006 Specification for environmental impact assessment of highways[S]. Beijing: China Communications Press, 2006. ]
|
| [19] |
|
| [20] |
祝国瑞, 徐智勇, 吴小芳. 基于多重变换组合的动态地图符号设计[J]. 武汉大学学报(信息科学版), 2006(6):548-551.
[
|
| [21] |
艾廷华. 动态符号与动态地图[J]. 武汉测绘科技大学学报, 1998(1):49-53.
[
|
| [22] |
Smart City Research Group[EB/OL]. http://www.cse.ust.hk/scrg, 2010-05-01.
|
| [23] |
徐智勇, 艾廷华, 危拥军. 三维地图符号视觉参量研究[J]. 武汉大学学报·信息科学版, 2006,31(6):557-560.
[
|
| [24] |
苗蕾. 地图可视化中动态与交互特性的认知研究[D]. 武汉:武汉大学, 2004.
[
|
/
| 〈 |
|
〉 |