
Journal of Geo-information Science >
Big-data Oriented Commuting Distribution Model and Application in Large Cities
Received date: 2020-06-29
Request revised date: 2020-07-26
Online published: 2020-10-21
Supported by
National Natural Science Foundation of China(41925003)
Copyright
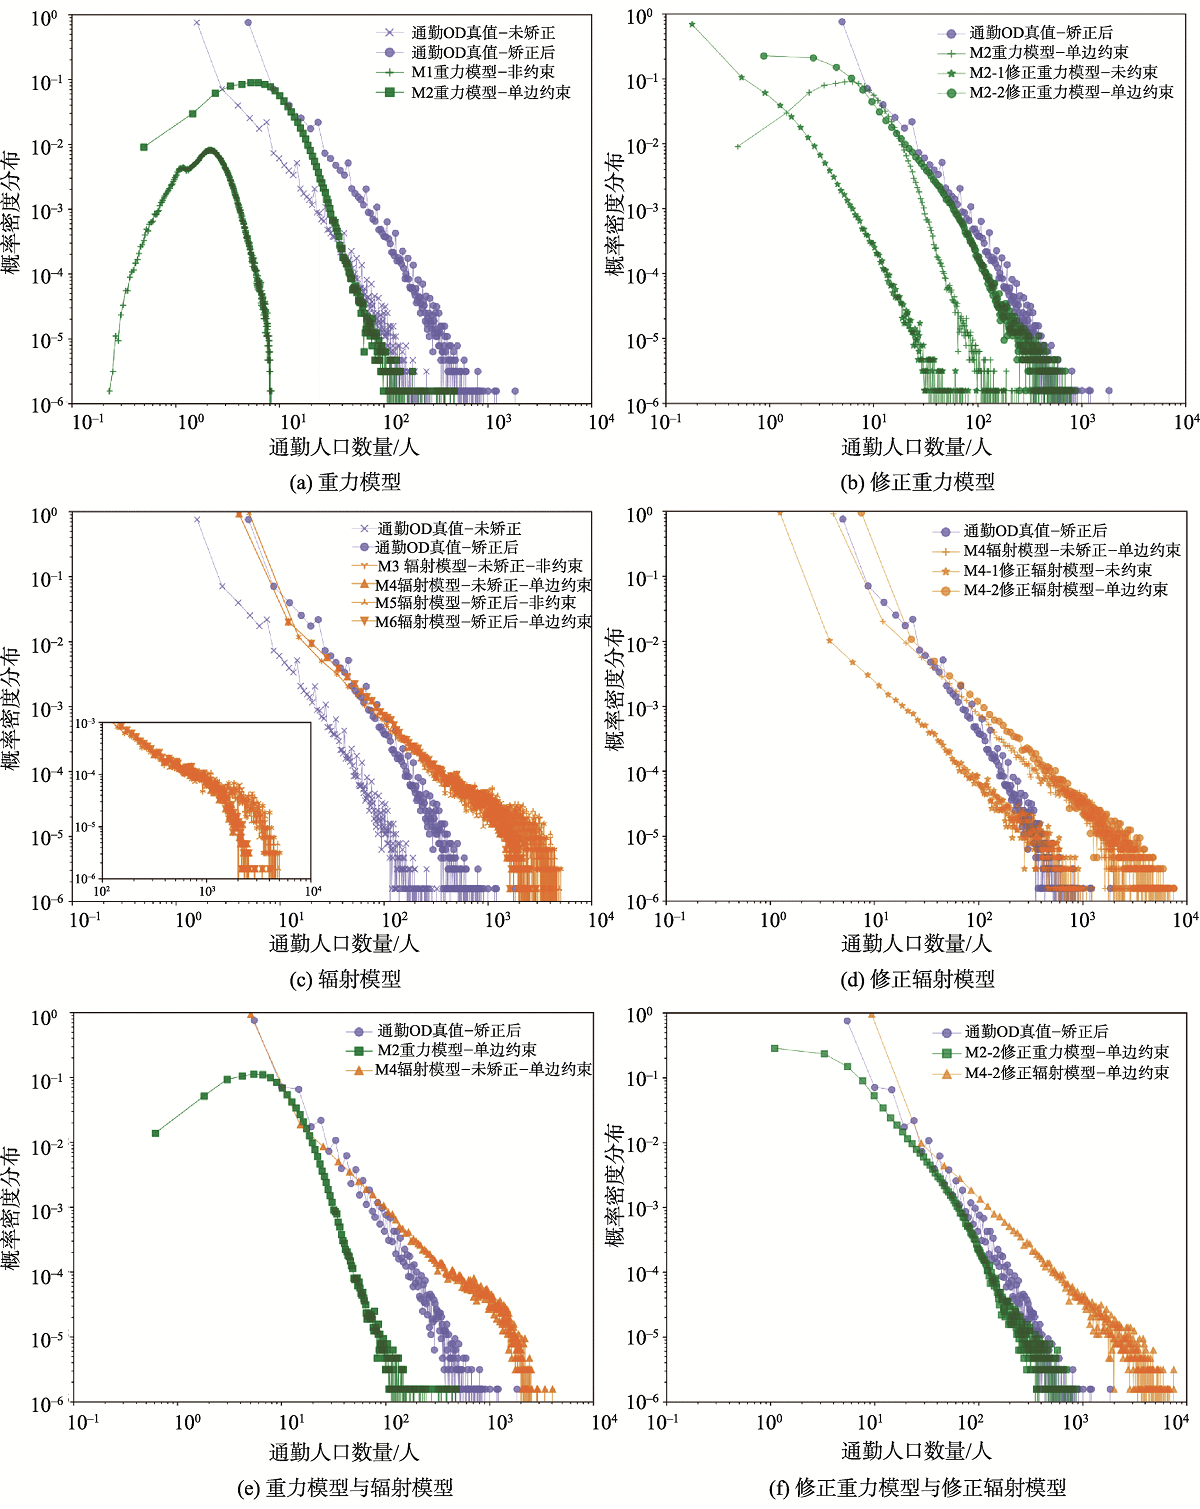
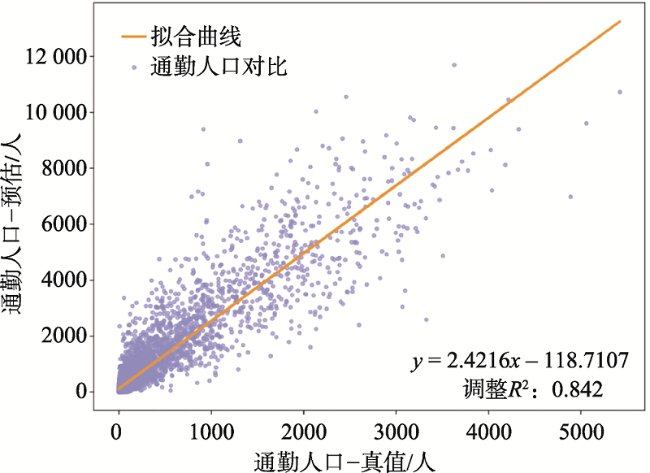
In recent years, big data has been widely applied in traffic analysis. However, they are mostly used for data visualization and phenomenon description. There is a lack of big-data oriented transport modeling, which leads to limited application of big-data in transportation planning. In this study, we propose a Location-Space Dependent Indicator (LSDI) based on the time-space interaction between transportation and land use. Based on this indicator, the urban commuting distribution model is developed, which improves the traditional gravity model. Taking Beijing as a study case, the developed model is applied and verified using mobile phone signaling big data derived from the communication service of an operator in September 2017. Travel generation and distribution models are constructed and verified respectively. Our results show that: (1) For the travel generation model simulations, commuter population and resident population show a good linear relationship. This model generates a significant prediction with a goodness of fit of 0.84; (2) For the travel distribution model simulations, a comparison analysis is conducted between gravity model, radiation model, and modified model with LSDI. The gravity model corrected by real commuting data performs best in regression analysis with a goodness of fit of 0.94. But large errors occur in the probability density distribution. The radiation model performs normal in regression analysis with a goodness of fit of 0.37. It has a better accuracy in the probability density distribution. The modified gravity model with LSDI has the best overall performance. The underestimation phenomenon is optimized in the commuter population distribution with a highest goodness of fit (0.85). Our findings provide new insights in developing big-data oriented transport prediction models and contribute to promote the application of big data in transport planning.
LIU Yunshu , ZHAO Pengjun , LV Di . Big-data Oriented Commuting Distribution Model and Application in Large Cities[J]. Journal of Geo-information Science, 2021 , 23(7) : 1185 -1195 . DOI: 10.12082/dqxxkx.2021.200334
表1 通勤居民与通勤出行识别Tab. 1 Identification of commuters and commute travel |
| 流程阶段 | 规则定义 |
|---|---|
| 月度驻留信息汇总 | 将统计时段分为工作日白天、工作日夜晚、周末白天和周末夜晚;分别统计居民在所有驻留网格中的月度累计驻留时长。 |
| 居住地与工作地定义 | 居住地是指居民在工作日夜晚和周末夜晚累计驻留时长最长的网格;工作地是指除了居住地之外,居民在工作日白天累计驻留时长最长,并且在60%以上的工作日均在此地发生过驻留的网格。 |
| 通勤居民筛选 | 居民年龄在19~59岁之间;在一个月的研究时段内,驻留行为在研究区内累计出现10 d以上;可以识别出工作地位置。 |
| 通勤出行识别 | 从居住地到工作地的出行行为;出发时间早于中午12:00;包括多段出行信息的拼接。 |
注:根据居民的工作时段特征,将白天时段定义为8:00-21:00。 |
表2 2017年北京市通勤出行分布预测模型Tab. 2 Trip distribution prediction model of commuting in Beijing in 2017 |
| 模型类型 | 模型名称 | 计算公式 |
|---|---|---|
| 重力模型 | 非约束重力模型M1 | |
| 单边约束重力模型M2 | ||
| 辐射模型 | 未矫正非约束辐射模型M3 | |
| 未矫正单边约束辐射模型M4 | ||
| 矫正后非约束辐射模型M5 | ||
| 矫正后单边约束辐射模型M6 | ||
| 修正模型 | 修正重力模型(以M1为例) | |
| 修正辐射模型(以M3为例) |
表3 2017年北京市通勤出行分布预测模型参数Tab. 3 Parameters of trip distribution prediction model of commuting in Beijing in 2017 |
| 参数名称 | 参数定义 |
|---|---|
| 从 区到 区的手机用户通勤人口 | |
| 重力模型归一化因子 | |
| , | 区与 区的手机用户常住人口 |
| 区与 区几何中心之间的直线距离 | |
| 重力模型矫正因子,表征空间质量和距离对通勤出行的影响作用 | |
| 平衡因子,对通勤产生总量进行约束 | |
| 区的手机用户通勤人口 | |
| 以 区几何中心点为圆心,以 为半径的圆形区域内手机用户常住人口总和(未包含出发和到达网格的手机用户常住人口) | |
| 总的手机用户常住人口 | |
| 区位空间依赖因子,表征交通流在 地区与 地区之间的空间分布常态惯性 |
图3 2017年北京市通勤人口预测与真值对比Fig. 3 Commuting population prediction and validation of Beijing in 2007 |
表4 通勤人口对比OLS回归分析Tab. 4 OLS analysis of commuting population validation |
| coef | std err | t | P>|t| | [0.025 | 0.975] | |
|---|---|---|---|---|---|---|
| Intercept | 118.7107 | 5.174 | 22.943 | 0.000 | 108.568 | 128.853 |
| 2.4216 | 0.010 | 231.131 | 0.000 | 2.401 | 2.442 |
注: 为基于手机信令数据筛选的真实通勤用户。 |
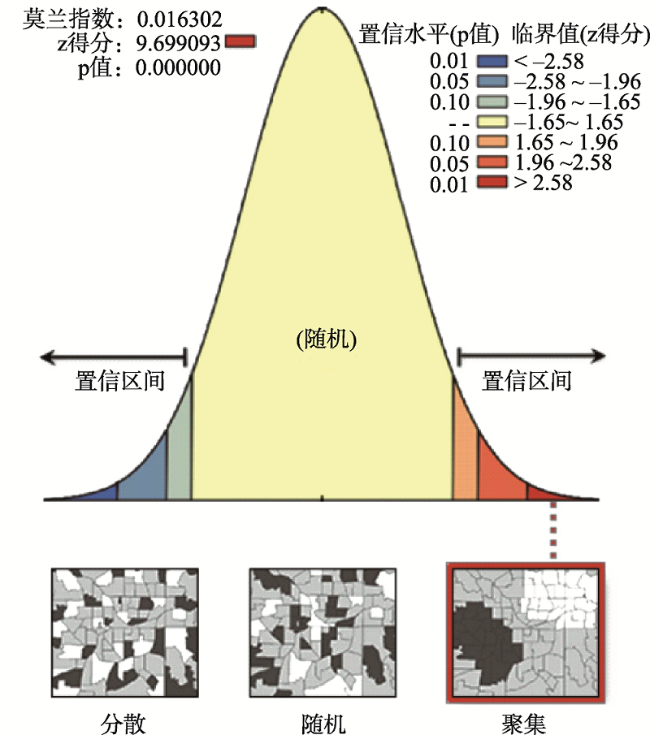
图4 2017年北京市通勤人口预测误差空间自相关检验结果分布(全局莫兰指数)Fig. 4 Spatial autocorrelation test result (Global Moran's I) of commuting population prediction error in Beijing in 2017 |
表5 2017年北京市通勤人口预测误差全局莫兰指数统计指标Tab. 5 Statistics of Global Moran’s I of commuting population prediction error in Beijing in 2017 |
| 统计指标 | 数值 |
|---|---|
| Moran's Index | 0.016 302 |
| Expected Index | -0.000 100 |
| Variance | 0.000 003 |
| z得分 | 9.699 093 |
| p值 | 0.000 000 |
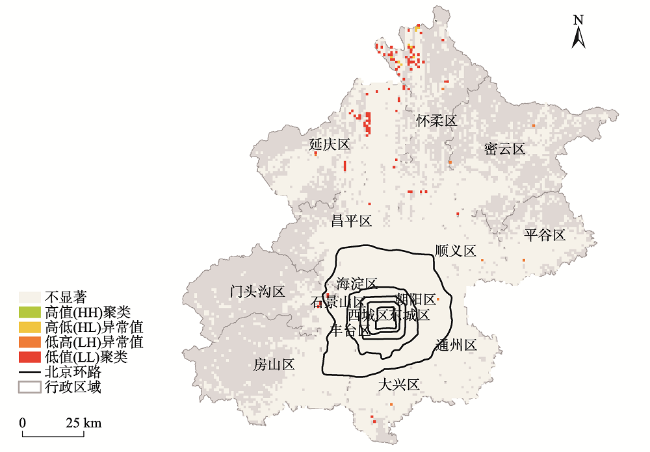
图5 2017年北京市通勤人口预测误差空间异质性(局部莫兰指数)Fig. 5 Spatial heterogeneity of commuting population prediction error (Local Moran's I) in Beijing in 2017 |
表6 2017年北京市通勤人口预测误差空间集聚类型统计Tab. 6 Statistics of spatial agglomeration types of commuting population prediction error in Beijing in 2017 |
| 空间集聚情况 | 集聚数量 | 集聚数量占比/% |
|---|---|---|
| 不显著 | 9878 | 98.889 |
| 高值(HH)聚类 | 0 | 0.000 |
| 高低(HL)异常值 | 9 | 0.090 |
| 低高(LH)异常值 | 8 | 0.080 |
| 低值(LL)聚类 | 94 | 0.941 |
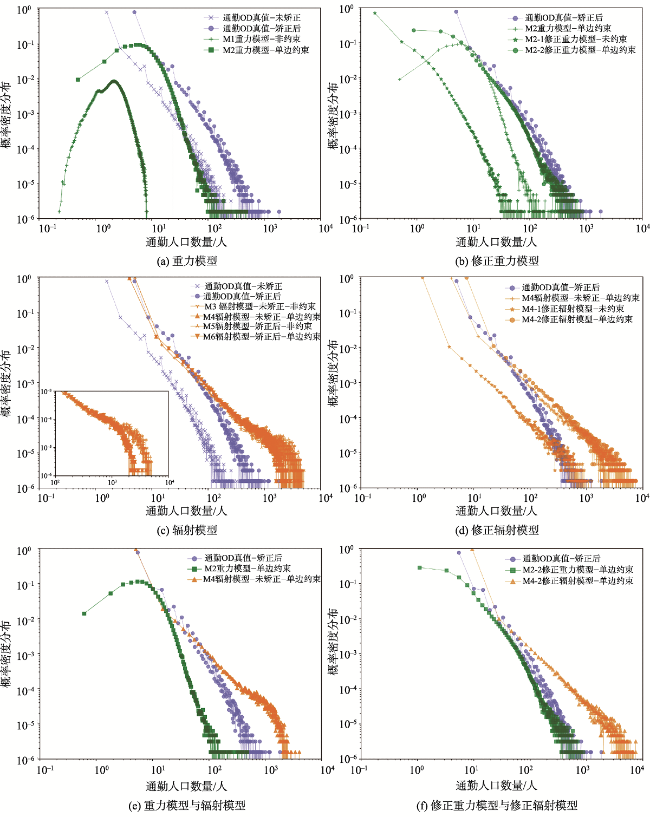
表7 2017年北京市通勤OD人口比率回归分析Tab. 7 Regression analysis of commuting OD population ratio of Beijing in 2017 |
| 预测模型 | 模型名称 | 拟合优度(调整R2) |
|---|---|---|
| 重力模型 | 单边约束重力模型M2 | 0.94 |
| 辐射模型 | 未矫正单边约束辐射模型M4 | 0.37 |
| 修正模型 | 修正单边约束重力模型M2-2 | 0.85 |
| 修正未矫正单边约束辐射模型M4-2 | 0.34 |
表8 2017年北京市通勤出行预测模型综合评价Tab. 8 Comprehensive evaluation of commuting models of Beijing in 2017 |
| 模型名称 | 评价指标 | |
|---|---|---|
| 通勤人口数量分布 | 通勤人口比率 | |
| 重力模型 | - | + |
| 辐射模型 | + | - |
| 修正重力模型 | + | + |
| 修正辐射模型 | + | - |
注:+表示效果好;-表示效果差。 |
| [1] |
交通运输部. 城市公共交通“十三五”发展纲要[EB/OL]. http://www.gov.cn/xinwen/2016-07/25/content_5094575.htm,2016-07-25.
[Ministry of Transport. The 13th five-year plan for urban public transport development[EB/OL]. http://www.gov.cn/xinwen/2016-07/25/content_5094575.htm,2016-07-25, 2016-07-25.]
|
| [2] |
刘云舒, 赵鹏军, 梁进社. 基于位置服务数据的城市活力研究——以北京市六环内区域为例[J]. 地域研究与开发, 2018, 37(6):64-69,87.
[
|
| [3] |
郭文伯, 张艳, 柴彦威, 等. 基于GPS数据的城市郊区居民日常活动时空特征——以北京天通苑、亦庄为例[J]. 地域研究与开发, 2013, 32(6):159-164.
[
|
| [4] |
龙瀛, 张宇, 崔承印. 利用公交刷卡数据分析北京职住关系和通勤出行[J]. 地理学报, 2012, 67(10):1339-1352.
[
|
| [5] |
海晓东, 刘云舒, 赵鹏军, 等. 基于手机信令数据的特大城市人口时空分布及其社会经济属性估测——以北京市为例[J]. 北京大学学报(自然科学版), 2020, 56(3):518-530.
[
|
| [6] |
杨飞, 裘炜毅. 基于手机定位的实时交通数据采集技术[J]. 城市交通, 2005(4):67-72.
[
|
| [7] |
冉斌. 手机数据在交通调查和交通规划中的应用[J]. 城市交通, 2013, 11(1):72-81,32.
[
|
| [8] |
|
| [9] |
|
| [10] |
王西点. 基于手机位置的实时交通信息采集技术[J]. 中国交通信息产业, 2009(1):128-130.
[
|
| [11] |
|
| [12] |
|
| [13] |
杨飞. 基于手机定位的交通OD数据获取技术[J]. 系统工程, 2007(1):42-48.
[
|
| [14] |
|
| [15] |
肖秋生, 徐慰慈. 城市交通规划[M]. 北京: 人民交通出版社, 1990.
[
|
| [16] |
|
| [17] |
|
| [18] |
|
| [19] |
|
| [20] |
|
| [21] |
|
| [22] |
|
| [23] |
李涵. 组团城市出行分布模型优化研究[D]. 重庆:重庆交通大学, 2012.
[
|
| [24] |
北京市统计局. 北京统计年鉴2018[EB/OL]. http://nj.tjj.beijing.gov.cn/nj/main/2018-tjnj/zk/indexch.htm.
[Beijing Municipal Bureau of Statistics. Beijing statistical yearbook in 2018[EB/OL]. http://nj.tjj.beijing.gov.cn/nj/main/2018-tjnj/zk/indexch.htm]
|
| [25] |
北京交通发展研究院. 2018年北京交通发展年报[EB/OL]. http://www.bjtrc.org.cn/List/index/cid/7.html.
[Beijing Transport Institute. Beijing transportation development annual report in 2008[EB/OL]. http://www.bjtrc.org.cn/List/index/cid/7.html.]
|
| [26] |
高德地图. 2017 年度中国主要城市交通分析报告[EB/OL].
[AutoNavi. China major city traffic analysis report in 2017[EB/OL]. https://trp.autonavi.com/download.do. ]
|
| [27] |
|
| [28] |
赵鹏军, 万婕. 城市交通与土地利用一体化模型的核心算法进展及技术创新[J]. 地球信息科学学报, 2020, 22(4):792-804.
[
|
| [29] |
赵鹏军, 万婕. 城市交通与土地利用一体化模型的理论基础与发展趋势[J]. 地理科学, 2020, 40(1):12-21.
[
|
| [30] |
|
| [31] |
|
| [32] |
|
| [33] |
|
| [34] |
|
| [35] |
|
/
| 〈 |
|
〉 |