
Journal of Geo-information Science >
Patterns of Phytoplankton Phenology and Its Response to Temperature of Water Surface in Lake Taihu based on MODIS Data
Received date: 2020-04-28
Request revised date: 2020-08-12
Online published: 2020-12-25
Supported by
National Key Research and Development Program of China(2017YFB0503902)
Copyright
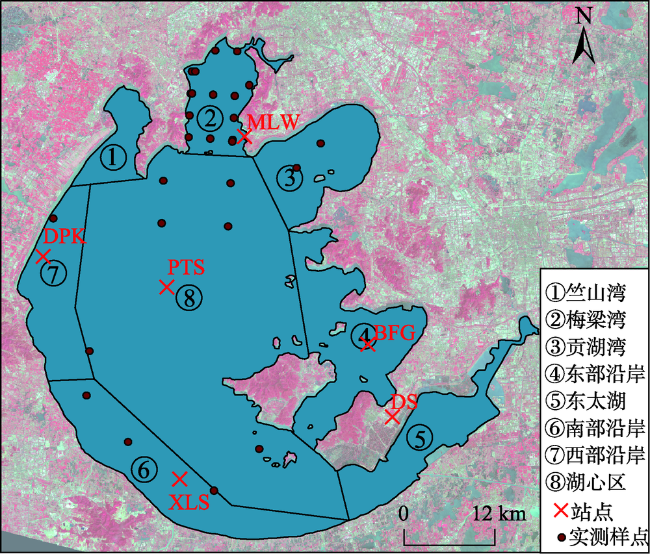
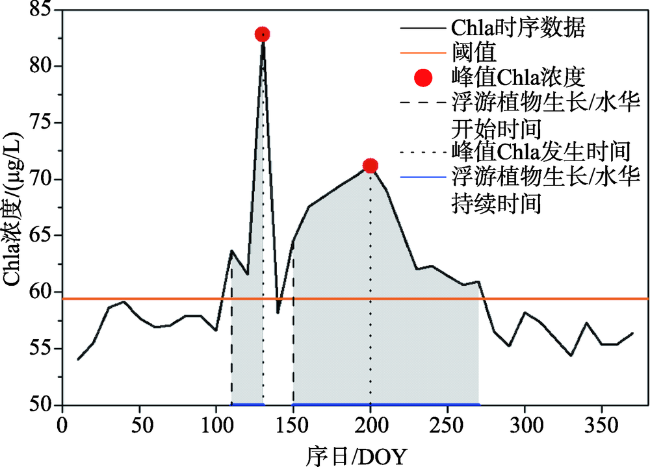
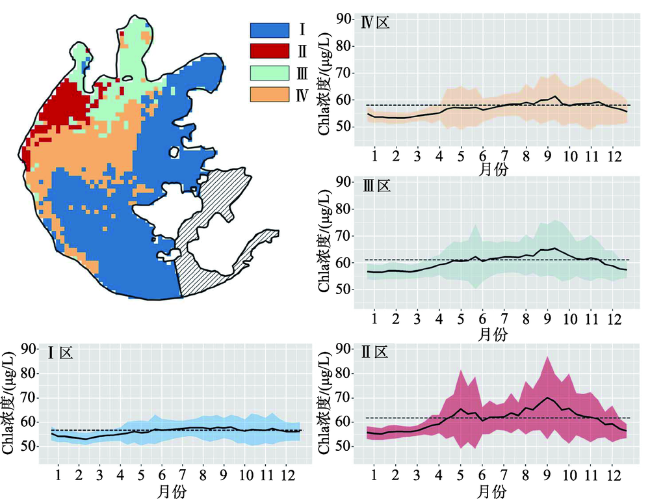
Due to the influence of water temperature and nutrient concentration, phytoplankton phenology can reflect the growth of phytoplankton and the changes of lake ecosystem. Because of the serious eutrophication in Lake Taihu, the effect of water temperature on phytoplankton growth is more and more significant. Thus, it is of great significance to study the relationship between phenology and water temperature for understanding, controlling and improving the ecosystem of Lake Taihu. This study firstly calculated the phytoplankton phenology metrics and the Temperature of Water Surface (LSWT) by MODIS data from 2003 to 2018, and then explored the phenological characteristics of different regions by analyzing the temporal-spatial distribution variation of phytoplankton phenology. At last, the response of phytoplankton phenology to LSWT change was revealed by combining the LSTW and the phenological characteristics. The results showed that: ① Different phytoplankton phenological indexes had different spatial distribution characteristics. The number of blooms, the peak value of Chlorophyll a (Chla) concentration and the total duration of algal blooms showed a decreasing trend from the western coast to the center of lake; the dates when the phytoplankton began to grow and the Chla peak appeared were complex in the lake. However, the date was relatively early in the coastal area; ② Lake Taihu could be divided into four types of areas with different phenological characteristics. The Type I area was mainly located in Gonghu Bay, eastern coast and the central part of Lake Taihu, where the fluctuation of Chla concentration (50~60 μg/L) was gentle, the number of blooms was the lowest, the start date was the latest, and the duration was the shortest. Type II area was mainly distributed along the western coast, with the violently fluctuating Chla concentration (50~90 μg/L), the most frequent blooms, the earliest onset, and the longest duration. Types III and IV were the transition areas. The former was mainly distributed in Meiliang Bay, Zhushan Bay and their exits, while the latter was mainly located in the southern coast and central lake. ③ The response of phytoplankton phenology to LSWT changes was affected by the level of nutrients. When the nutrient level was high, the promotion effect of LSWT on phytoplankton growth was more significant. The increasing trend of inter-annual LSWT had obvious influence on the advance of phytoplankton phenology and the increase of biomass. On the contrary, the effect of LSWT on the growth of phytoplankton was weakened.

HONG Tianlin , LI Yunmei , LV Heng , MENG Bin , BI Sun , ZHOU Ling . Patterns of Phytoplankton Phenology and Its Response to Temperature of Water Surface in Lake Taihu based on MODIS Data[J]. Journal of Geo-information Science, 2020 , 22(10) : 1935 -1945 . DOI: 10.12082/dqxxkx.2020.200206
图3 2003—2018年太湖水华发生次数空间分布Fig. 3 Spatial distribution of the number of blooms in Lake Taihu from 2003 to 2018 |
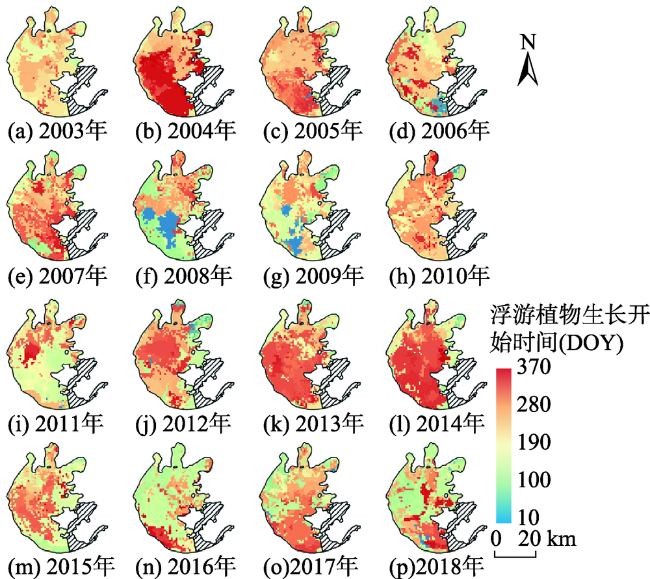
图4 2003—2018年太湖浮游植物生长开始时间空间分布Fig. 4 Spatial distribution of phytoplankton growth start date in Lake Taihu from 2003 to 2018 |
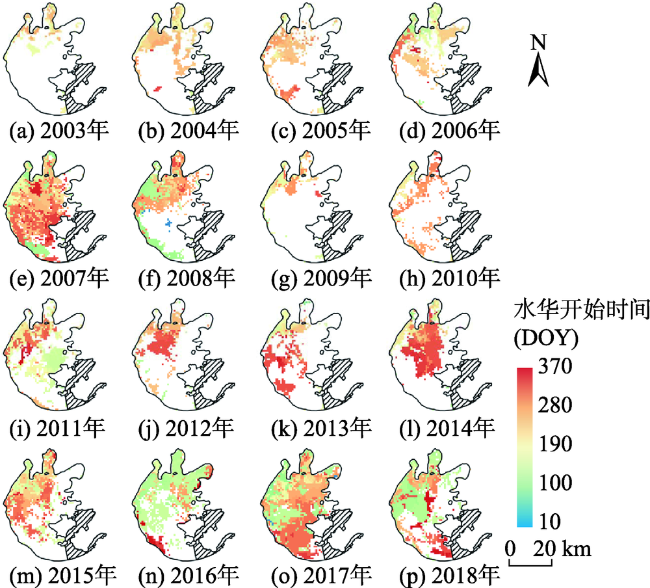
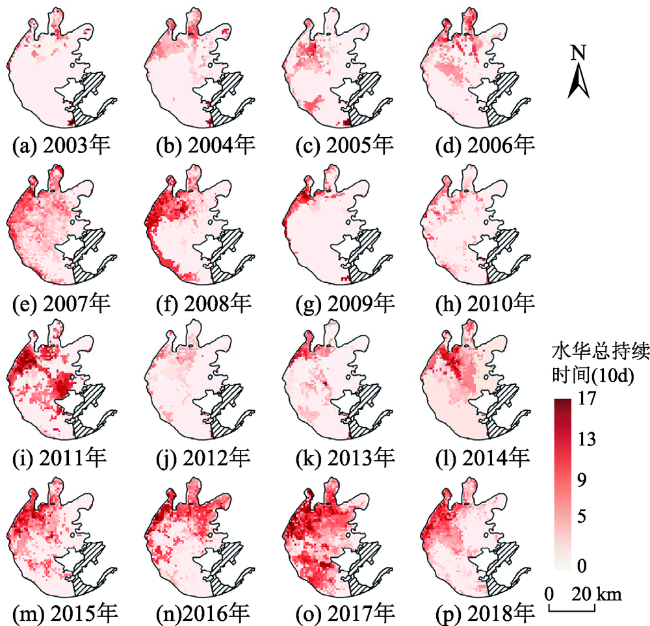
图5 2003—2018年太湖水华开始时间空间分布Fig. 5 Spatial distribution of bloom start date in Lake Taihu from 2003 to 2018 |
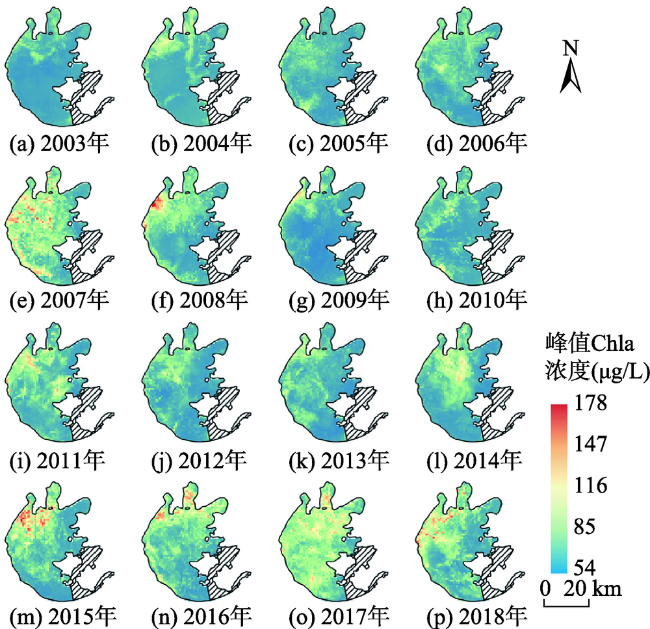
图6 2003—2018年太湖峰值Chla浓度空间分布Fig. 6 Spatial distribution of chla concentration peak in Lake Taihu from 2003 to 2018 |
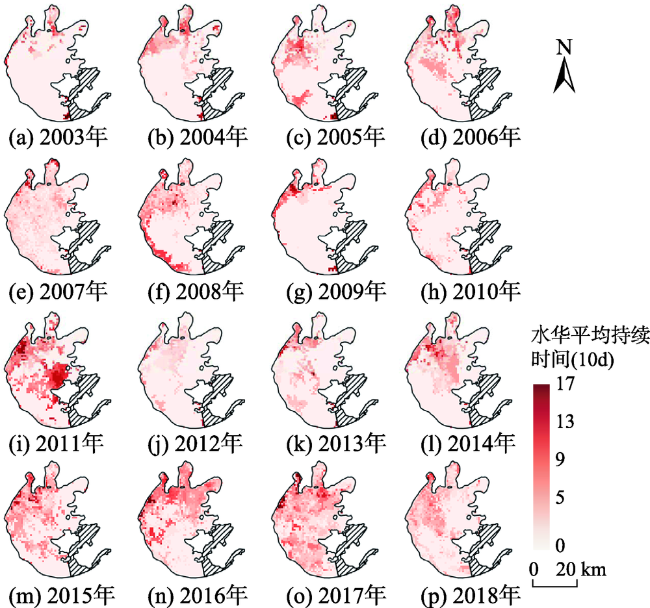
图7 2003—2018年太湖水华平均持续时间空间分布Fig. 7 Spatial distribution of average bloom duration in Lake Taihu from 2003 to 2018 |
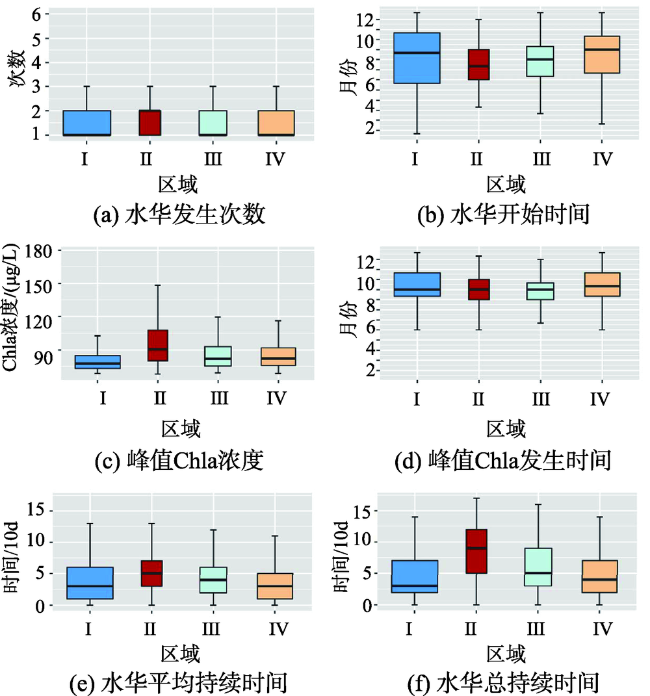
图10 太湖各区域不同浮游植物物候指标箱型图(水华事件)Fig. 10 Box plots of different phytoplankton phenology metrics in various regions of Lake Taihu (blooming events) |
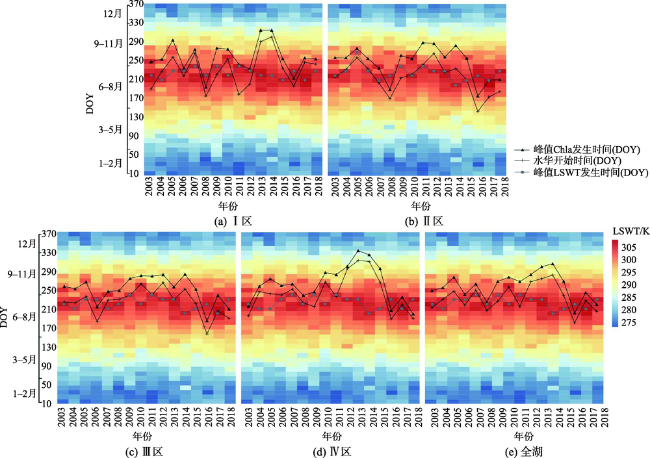
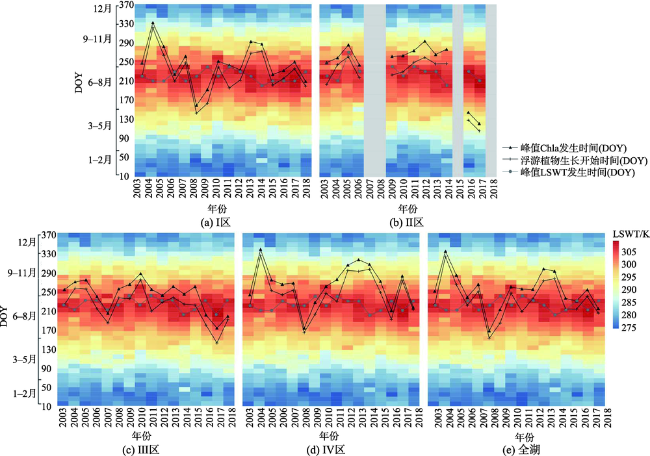
图13 2003—2018年LSWT下的水华开始时间和峰值Chla发生时间(水华事件)Fig. 13 Bloom start date and peak Chla occurrence time under LSWT from 2003 to 2018 (blooming events) |
| [1] |
成小英, 李世杰. 长江中下游典型湖泊富营养化演变过程及其特征分析[J]. 科学通报, 2006(7):848-855.
[
|
| [2] |
秦伯强. 我国湖泊富营养化及其水环境安全[J]. 科学对社会的影响, 2007(3):17-23.
[
|
| [3] |
项文华, 张玉超, 林珊, 等. 湖泊水面温度遥感定量反演研究综述[J]. 四川环境, 2011,30(6):116-122.
[
|
| [4] |
王志强, 崔爱花, 缪建群, 等. 淡水湖泊生态系统退化驱动因子及修复技术研究进展[J]. 生态学报, 2017,37(18):6253-6264.
[
|
| [5] |
邓建明, 秦伯强. 全球变暖对淡水湖泊浮游植物影响研究进展[J]. 湖泊科学, 2015,27(1):1-10.
[
|
| [6] |
|
| [7] |
|
| [8] |
|
| [9] |
|
| [10] |
|
| [11] |
徐祎凡, 施勇, 李云梅. 基于环境一号卫星高光谱数据的太湖富营养化遥感评价模型[J]. 长江流域资源与环境, 2014,23(8):1111-1118.
[
|
| [12] |
黄君, 庄严, 宋挺, 等. 3S技术在太湖富营养化和蓝藻水华分布规律中的应用研究[J]. 环境污染与防治, 2014,36(12):31-37,42.
[
|
| [13] |
孔繁翔, 马荣华, 高俊峰, 等. 太湖蓝藻水华的预防、预测和预警的理论与实践[J]. 湖泊科学, 2009,21(3):314-328.
[
|
| [14] |
张艳会, 李伟峰, 陈求稳. 太湖水华程度及其生态环境因子的时空分布特征[J]. 生态学报, 2016,36(14):4337-4345.
[
|
| [15] |
|
| [16] |
|
| [17] |
覃志豪, 高懋芳, 秦晓敏, 等. 农业旱灾监测中的地表温度遥感反演方法——以MODIS数据为例[J]. 自然灾害学报, 2005,14(4):64-71.
[
|
| [18] |
|
| [19] |
|
| [20] |
|
| [21] |
张晨, 来世玉, 高学平, 等. 气候变化对湖库水环境的潜在影响研究进展[J]. 湖泊科学, 2016,28(4):691-700.
[
|
| [22] |
吴攀, 邓建明, 秦伯强, 等. 水温和营养盐增加对太湖冬、春季节藻类生长的影响[J]. 环境科学研究, 2013,26(10):1064-1071.
[
|
/
| 〈 |
|
〉 |
