
Journal of Geo-information Science >
Delineation of Urban Growth Boundary based on Improved FLUS Model Considering Dynamic Data
Received date: 2020-07-15
Request revised date: 2020-10-03
Online published: 2021-02-25
Supported by
National Natural Science Foundation of China(51478470)
Social Science Foundation of Hunan Province(18YBQ106)
Scientific Research Project of Hunan Education Department(19B480)
Copyright
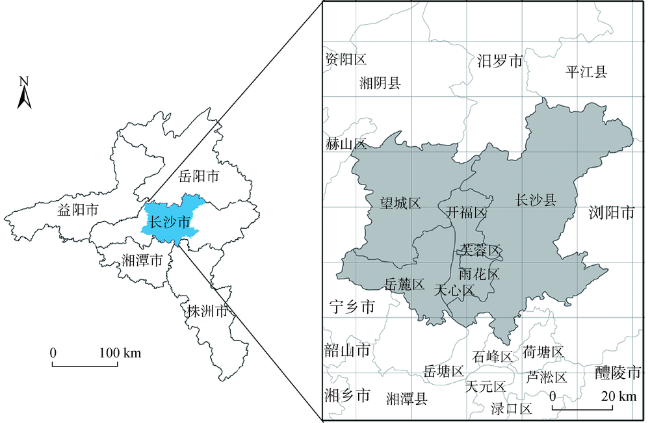
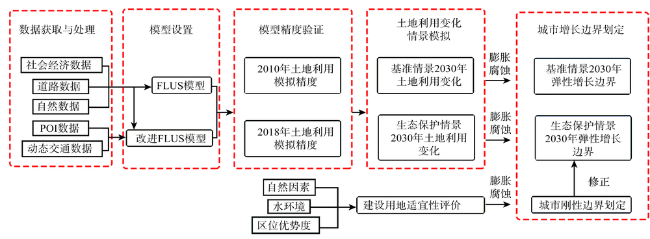
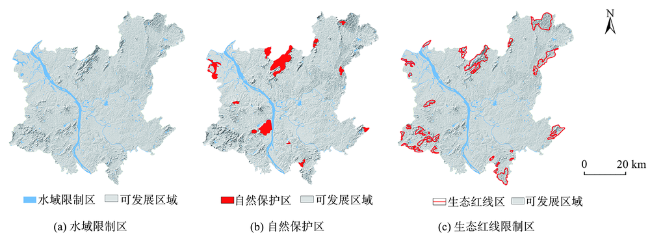
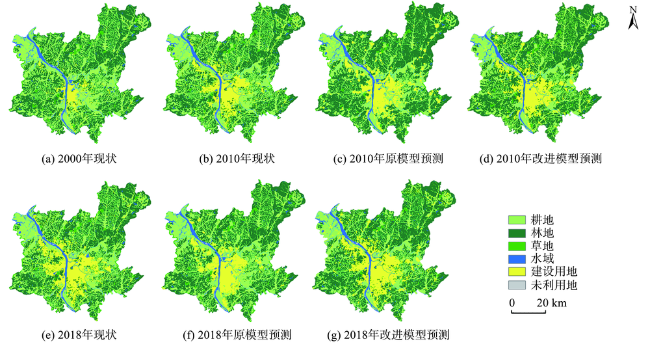
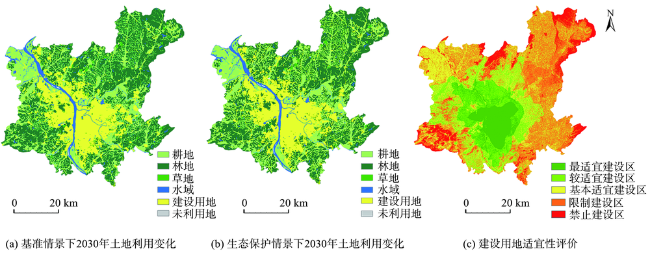
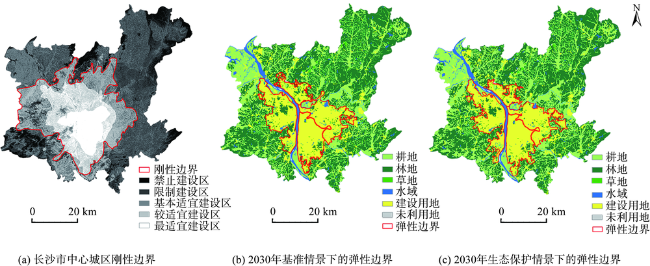
Measuring the urban growth boundary is important to control the disorderly expansion of urban constructed land. How to define the urban growth boundary scientifically is a hot topic of current researches. This study attempts to introduce Baidu dynamic traffic data and POI data to improve the FLUS model to simulate land use changes. Taking the central of Changsha city as an example, the simulation accuracy of the improved FLUS model is first verified by comparing with the land use data of 2000, 2010, and 2018. Then, the land use of central Changsha in 2030 is simulated based on two scenarios using the improved FLUS model. The urban growth boundary is finally defined based on land suitability evaluation. The results show that: (1) Compared with the original FLUS model, the kappa coefficient of the improved FLUS model with dynamic data increases by 2.90% and 2.74% in 2010 and 2018, respectively, and the overall accuracy increases by 1.79% and 1.83%, respectively, which indicates a higher simulation accuracy of the improved model; (2) Based on the simulated land use of central Changsha in 2030, the area of constructed land is 930.06 km2 and 881.36 km2 respectively in benchmark scenario and ecological protection scenario. The largest proportion of land converted to construction land is cultivated land; (3) The area within the rigid growth boundary of central Changsha is 1479.59 km2, accounting for 37.38% of the total area of the central city. These areas include Furong District, Tianxin District, Yuhua District, Yuelu District, and Kaifu District; (4) The area within the elastic growth boundary of central Changsha is 799.35 km2 and 742.92 km2 under the benchmark scenario and ecological protection scenario, respectively. The expanded construction mainly occurs in Changsha County and Wangcheng District, which is consistent with the development direction of 2010 Changsha urban master plan. The improved FLUS model with dynamic data can simulate the urban growth boundary in multiple scenarios, which provides a scientific basis for future planning decision.
WANG Zhiyuan , ZHANG Kao , DING Zhipeng , WU Suiyi , HUANG Chunhua . Delineation of Urban Growth Boundary based on Improved FLUS Model Considering Dynamic Data[J]. Journal of Geo-information Science, 2020 , 22(12) : 2326 -2337 . DOI: 10.12082/dqxxkx.2020.200373
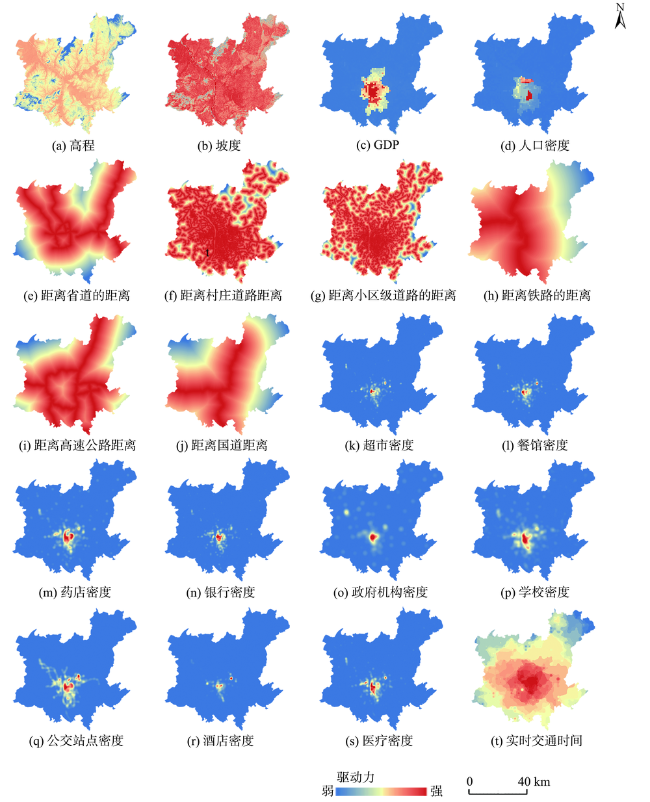
表1 空间驱动数据来源与处理Tab. 1 Space-driven data sources and processing |
| 数据类型 | 数据名称 | 数据来源 | 处理方式 |
|---|---|---|---|
| 道路数据 | 各级城市道路 | OSM地图 | 采取2018年城市道路数据利用ArcGIS欧式距离模块计算,并进行归一化处理 |
| 自然数据 | 高程 | 地理空间数据云 | 采取ASTER GDEM V2 30 m分辨率DEM数据利用ArcGIS进行归一化处理 |
| 坡度 | 地理空间数据云DEM数据计算 | 利用ArcGIS坡度模块计算,并进行归一化处理 | |
| 公共服务 设施数据 | 公共服务设施点 | 百度地图 | 采取2018年公共服务设施数据利用ArcGIS核密度模块计算,并进行归一化处理 |
| 动态交通 数据 | 距离各区县中心等时圈数据 | 百度地图 | 利用ArcGIS构建30 m×30 m渔网并提取点要素作为目标点,通过python编程向百度地图批量请求2019年12月5日—11日到达长沙市各行政区中心所需交通时间的时间点导航数据,选择预计驾车所能到达目标点最小时耗作为构建交通等时圈,并将各地区数据进行权重叠加 |
表2 邻域权重设置Tab. 2 Neighborhood weight setting |
| 土地利用类型 | 水域 | 耕地 | 林地 | 草地 | 建设用地 | 未利用地 |
|---|---|---|---|---|---|---|
| 邻域权重 | 0.32 | 0.60 | 0.48 | 0.80 | 1 | 0 |
表3 2000—2018年长沙中心城区建设用地面积变化Tab. 3 Change of construction land area in Changsha central city from 2000 to 2018 |
| 区县 | 2000—2010年建设用地扩张面积/km2 | 2010—2018年建设用地扩张面积/km2 |
|---|---|---|
| 芙蓉区 | 13.24 | 3.34 |
| 开福区 | 37.79 | 11.20 |
| 天心区 | 17.67 | 3.47 |
| 望城区 | 47.14 | 48.50 |
| 雨花区 | 46.86 | 10.80 |
| 岳麓区 | 52.25 | 36.91 |
| 长沙县 | 71.90 | 50.41 |
表4 改进FLUS模型与原模型精度对比Tab. 4 Accuracy comparison between improved FLUS model and original model |
| 年份 | 预测模型 | Kappa | 提高值/% | 总体精度/% | 提高值/% |
|---|---|---|---|---|---|
| 2010 | 原模型 | 0.7570 | 2.90 | 84.55 | 1.79 |
| 改进模型 | 0.7860 | 86.34 | |||
| 2018 | 原模型 | 0.7899 | 2.74 | 86.12 | 1.83 |
| 改进模型 | 0.8173 | 87.95 |
| [1] |
程永辉, 刘科伟, 赵丹, 等. “多规合一”下城市开发边界划定的若干问题探讨[J]. 城市发展研究, 2015,22(7):52-57.
[
|
| [2] |
刘海龙. 从无序蔓延到精明增长:美国“城市增长边界”概念述评[J]. 城市问题, 2005(3):67-72.
[
|
| [3] |
冯科, 吴次芳, 韦仕川, 等. 城市增长边界的理论探讨与应用[J]. 经济地理, 2008,28(3):425-429.
[
|
| [4] |
|
| [5] |
《城市规划编制办法》.中华人民共和国建设部,第146号, 2006.
[ Urban Planning Formulation Means, order of the Ministry of construction of the people's Republic of China,No.146, 2006. ]
|
| [6] |
龙瀛, 韩昊英, 毛其智. 利用约束性CA制定城市增长边界[J]. 地理学报, 2009,64(8):999-1008.
[
|
| [7] |
付玲, 胡业翠, 郑新奇. 基于BP神经网络的城市增长边界预测——以北京市为例[J]. 中国土地科学, 2016,30(2):22-30.
[
|
| [8] |
祝仲文, 莫滨, 谢芙蓉. 基于土地生态适宜性评价的城市空间增长边界划定——以防城港市为例[J]. 规划师, 2009,25(11):40-44.
[
|
| [9] |
王玉国, 尹小玲, 李贵才. 基于土地生态适宜性评价的城市空间增长边界划定——以深汕特别合作区为例[J]. 城市发展研究, 2012,19(11):76-82.
[
|
| [10] |
周锐, 王新军, 苏海龙, 等. 基于生态安全格局的城市增长边界划定——以平顶山新区为例[J]. 城市规划学刊, 2014 ( 4):57-63.
[
|
| [11] |
孟成, 卢新海, 彭明军, 等. 基于Markov-C 5.0的CA城市用地布局模拟预测方法[J]. 中国土地科学, 2015,29(6):82-88.
[
|
| [12] |
|
| [13] |
王丽萍, 金晓斌, 杜心栋, 等. 基于灰色模型-元胞自动机模型的佛山市土地利用情景模拟分析[J]. 农业工程学报, 2012,28(3):237-242.
[
|
| [14] |
刘小平, 黎夏, 艾彬, 等. 基于多智能体的土地利用模拟与规划模型[J]. 地理学报, 2006,61(10):1101-1112.
[
|
| [15] |
米媛, 姜博, 陈颜, 等. 基于SLEUTH模型的鄂尔多斯城市扩张模拟分析[J]. 中国农业大学学报, 2019,24(2):183-190.
[
|
| [16] |
|
| [17] |
|
| [18] |
|
| [19] |
|
| [20] |
黄康, 戴文远, 黄万里, 等. 基于FLUS模型与动能定理的城镇用地增长边界划定[J]. 地球信息科学学报, 2020,22(3):557-567.
[
|
| [21] |
招晖, 陈昌勇. FLUS模型对佛山城镇建设适宜性评价的验证与修正分析[J]. 规划师, 2020,36(3):86-92.
[
|
| [22] |
薛峰, 李苗裔, 马妍, 等. 基于FLUS模型的江西省国土空间开发模拟与评估[J]. 规划师, 2020,36(8):12-19.
[
|
| [23] |
|
| [24] |
张经度, 梅志雄, 吕佳慧, 等. 纳入空间自相关的FLUS模型在土地利用变化多情景模拟中的应用[J]. 地球信息科学学报, 2020,22(3):531-542.
[
|
| [25] |
|
| [26] |
王雅竹, 段学军, 杨清可, 等. 近30年江苏省建设用地扩张的时空特征、模式与驱动因素研究[J]. 长江流域资源与环境, 2019,28(7):1531-1540.
[
|
| [27] |
刘纪远, 匡文慧, 张增祥, 等. 20世纪80年代末以来中国土地利用变化的基本特征与空间格局[J]. 地理学报, 2014,69(1):3-14.
[
|
| [28] |
|
| [29] |
王保盛, 廖江福, 祝薇, 等. 基于历史情景的FLUS模型邻域权重设置——以闽三角城市群2030年土地利用模拟为例[J]. 生态学报, 2019,39(12):4284-4298.
[
|
| [30] |
赵林峰, 刘小平, 刘鹏华, 等. 基于地理分区与FLUS模型的城市扩张模拟与预警[J]. 地球信息科学学报, 2020,22(3):517-530.
[
|
| [31] |
吴欣昕, 刘小平, 梁迅, 等. FLUS-UGB多情景模拟的珠江三角洲城市增长边界划定[J]. 地球信息科学学报, 2018,20(4):532-542.
[
|
| [32] |
朱寿红, 孙玉杰, 舒帮荣, 等. 规划政策影响下区域生态用地演变模拟研究——以南京市溧水区为例[J]. 地理与地理信息科学, 2019,35(4):83-90.
[
|
| [33] |
张韶月, 刘小平, 闫士忠, 等. 基于“双评价”与FLUS-UGB的城镇开发边界划定——以长春市为例[J]. 热带地理, 2019,39(3):377-386.
[
|
/
| 〈 |
|
〉 |