
Journal of Geo-information Science >
Study on Agglomeration, Evolution and Autocorrelation Effects of Spatio-temporal of COVID-19 Epidemic in Prefecture-level Cities in China during Government's Strict Control Period
Received date: 2020-07-09
Revised date: 2020-09-23
Online published: 2021-04-25
Supported by
Program of National Social Science Foundation of China(20BTJ055)
Youth Program of National Natural Science Foundation of China(41801167)
Copyright
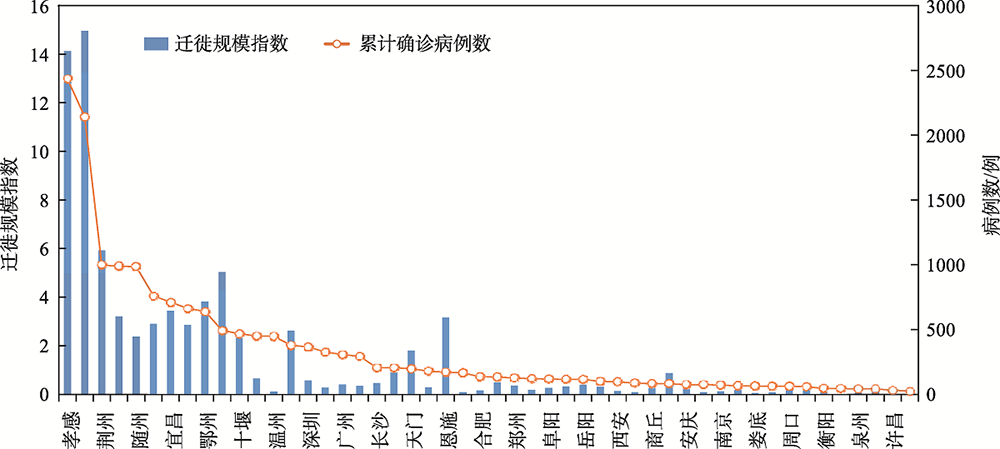
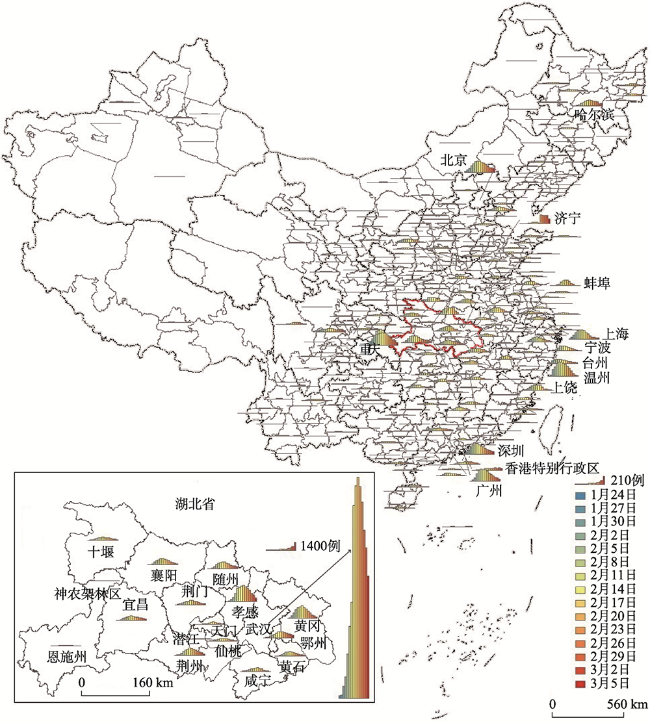
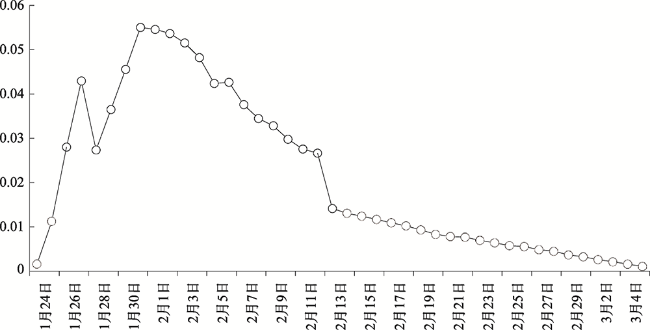
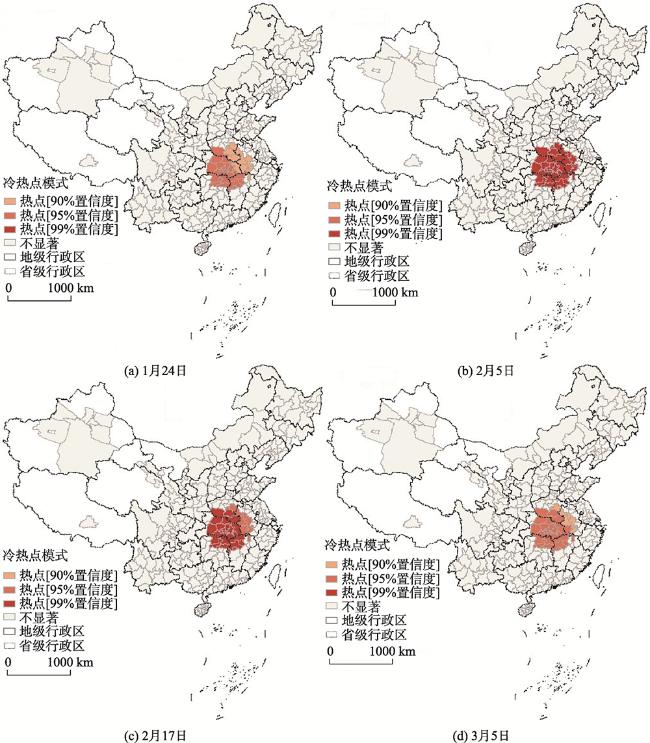
The spatio-temporal evolution of major public infectious epidemics during government's strict control period in prefecture-level city can effectively reflect china's comprehensive emergency prevention and control capabilities. Based on statistical data including number of active cases, total confirmed, deaths of COVID-19 in 312 cities in China from January 24 to March 5, 2020, this paper uses methods including exploratory spatial data analysis, optimized hot spot analysis, spatial Markov chain, spatial panel data model to analyze spatio-temporal evolution characteristics of COVID-19 epidemic in China under government's strict control.The study found that: (1) The number of active cases of COVID-19 in China experienced characteristics of "rapid growth and diffusion, basic control, gradual decline, and complete control in some areas" and reached its peak on February 17, with an average daily growth rate of 17.5% during rising period and an average daily decline rate of 5.1% during falling period, and the epidemic change characteristics of most cities are similar to Nationwide's situation;(2) The high population mobility during Spring Festival transportation period is main reason for rapid expansion of epidemic. The Baidu's migration scale index for the 14 days prior to Wuhan closure was significantly correlated with total confirmed cases of COVID-19 in some cities; (3) The method called optimized hot spot analysis has identified that spatial distribution of hot spots of epidemic is stable and mainly distributed in 36 cities with Wuhan as the center and a radius of about 350 kilometers, while no statistically significant cold spot cities were identified; (4) The results of Markov chain transfer probability matrix analysis of active cased of COVID-19 in 312 cities show that various types are more stable and the probability of maintaining original type is greater than 0.85. The average probability of downward transfer is significantly higher than the probability of upward transfer. The probability of each type of transition changes significantly under the influence of different spatial lag types; (5) The estimation results of the spatial panel data model show that the number of active cases of COVID-19 in cites has spatial-temporal autocorrelation. This paper analyzed spatio-temporal evolution characteristics of COVID-19 epidemic during government's strict control period at prefecture-level city level from multiple perspectives, the focus of COVID-19 prevention and control is to reduce its spatio-temporal autocorrelation effects, this study provides a decision-making reference for government's current and future response to major public infectious epidemics.
WU Xibo , LAI Changqiang , GE Zhizhuan . Study on Agglomeration, Evolution and Autocorrelation Effects of Spatio-temporal of COVID-19 Epidemic in Prefecture-level Cities in China during Government's Strict Control Period[J]. Journal of Geo-information Science, 2021 , 23(2) : 246 -258 . DOI: 10.12082/dqxxkx.2021.200362
表1 马尔科夫转移概率矩阵和转移时间矩阵Tab.1 Markov transition probability matrix and transition time matrix |
| 空间滞后 类型 | 转移概率矩阵 | 转移时间矩阵 | |||||||||
|---|---|---|---|---|---|---|---|---|---|---|---|
| C0 | C1 | C2 | C3 | C4 | C0 | C1 | C2 | C3 | C4 | ||
| P(H0) | C0 | 0.88 | 0.05 | 0.02 | 0.04 | 0.01 | 4.55 | 23.70 | 26.02 | 34.04 | 114.09 |
| C1 | 0.09 | 0.88 | 0.03 | 0.00 | 0.00 | 16.76 | 3.54 | 27.32 | 42.94 | 125.56 | |
| C2 | 0.00 | 0.11 | 0.85 | 0.04 | 0.00 | 29.63 | 14.78 | 4.53 | 37.13 | 125.78 | |
| C3 | 0.00 | 0.00 | 0.12 | 0.85 | 0.03 | 40.57 | 26.56 | 12.15 | 5.84 | 106.31 | |
| C4 | 0.00 | 0.00 | 0.00 | 0.08 | 0.92 | 52.71 | 39.07 | 24.82 | 12.87 | 9.49 | |
| P(LAG0) | C0 | 0.94 | 0.03 | 0.02 | 0.01 | 0.00 | 2.38 | 23.47 | 39.75 | 97.55 | 509.41 |
| C1 | 0.07 | 0.91 | 0.02 | 0.00 | 0.00 | 16.50 | 2.92 | 41.60 | 107.09 | 520.29 | |
| C2 | 0.01 | 0.12 | 0.84 | 0.03 | 0.00 | 25.28 | 11.37 | 6.56 | 91.94 | 509.73 | |
| C3 | 0.01 | 0.00 | 0.13 | 0.84 | 0.02 | 32.30 | 20.35 | 10.44 | 13.36 | 436.78 | |
| C4 | 0.00 | 0.00 | 0.00 | 0.23 | 0.78 | 36.74 | 24.80 | 14.88 | 4.44 | 99.28 | |
| P(LAG1) | C0 | 0.82 | 0.07 | 0.03 | 0.07 | 0.01 | 6.99 | 19.33 | 16.75 | 21.69 | 142.36 |
| C1 | 0.08 | 0.87 | 0.05 | 0.00 | 0.00 | 21.41 | 3.34 | 17.59 | 30.27 | 153.41 | |
| C2 | 0.01 | 0.11 | 0.83 | 0.05 | 0.00 | 33.29 | 14.25 | 3.47 | 26.27 | 152.19 | |
| C3 | 0.00 | 0.00 | 0.14 | 0.84 | 0.02 | 40.98 | 23.09 | 9.19 | 4.92 | 136.32 | |
| C4 | 0.00 | 0.00 | 0.00 | 0.10 | 0.90 | 49.64 | 32.73 | 19.12 | 10.31 | 15.02 | |
| P(LAG2) | C0 | 0.90 | 0.05 | 0.01 | 0.03 | 0.01 | 3.95 | 24.25 | 28.23 | 36.05 | 140.38 |
| C1 | 0.10 | 0.87 | 0.03 | 0.00 | 0.00 | 16.15 | 4.07 | 28.78 | 43.13 | 149.20 | |
| C2 | 0.00 | 0.08 | 0.88 | 0.04 | 0.00 | 34.15 | 18.15 | 3.72 | 36.70 | 147.46 | |
| C3 | 0.00 | 0.00 | 0.11 | 0.85 | 0.03 | 44.49 | 28.78 | 10.78 | 5.33 | 119.79 | |
| C4 | 0.00 | 0.00 | 0.00 | 0.17 | 0.82 | 49.11 | 34.32 | 16.84 | 6.49 | 22.28 | |
| P(LAG3) | C0 | 0.84 | 0.06 | 0.03 | 0.04 | 0.02 | 5.68 | 21.37 | 24.99 | 33.10 | 85.02 |
| C1 | 0.08 | 0.89 | 0.03 | 0.00 | 0.00 | 16.41 | 3.09 | 27.73 | 43.96 | 97.37 | |
| C2 | 0.00 | 0.12 | 0.83 | 0.04 | 0.00 | 27.85 | 13.07 | 5.16 | 39.49 | 97.15 | |
| C3 | 0.00 | 0.00 | 0.10 | 0.86 | 0.04 | 41.13 | 27.50 | 14.95 | 5.24 | 76.57 | |
| C4 | 0.00 | 0.00 | 0.00 | 0.10 | 0.90 | 51.13 | 37.50 | 24.95 | 10.00 | 8.66 | |
| P(LAG4) | C0 | 0.79 | 0.05 | 0.01 | 0.05 | 0.10 | 10.69 | 41.45 | 35.00 | 26.44 | 24.03 |
| C1 | 0.13 | 0.84 | 0.04 | 0.00 | 0.00 | 11.53 | 6.95 | 33.52 | 33.06 | 33.81 | |
| C2 | 0.01 | 0.11 | 0.83 | 0.05 | 0.00 | 25.20 | 17.21 | 5.65 | 28.92 | 41.14 | |
| C3 | 0.00 | 0.00 | 0.13 | 0.84 | 0.03 | 39.25 | 31.25 | 14.05 | 5.44 | 39.89 | |
| C4 | 0.00 | 0.00 | 0.00 | 0.04 | 0.96 | 66.03 | 58.03 | 40.82 | 26.78 | 2.49 | |
表2 变量及数据统计描述Tab2 Statistics description of variable and data |
| 变量名称 | 均值 | 标准差 | 最小值 | 最大值 |
|---|---|---|---|---|
| 现有确诊数(NCD)/例 | 96.41 | 1 239.65 | 0 | 37 875 |
| 省累计确诊数(PCD)/例 | 1 854.76 | 8 297.36 | 0 | 63 454 |
| 城市累计治愈数(CNC)/例 | 16.15 | 156.32 | 0 | 7 292 |
| 城市累计确诊数(CCD)/例 | 115.42 | 1 431.50 | 0 | 45 660 |
注:地级市截面数量为312个,42期共13 104个观测值。 |
表3 Kao协整检验Tab.3 Kao cointegration test |
| 指标 | 统计值 | P值 |
|---|---|---|
| Modified Dickey-Fuller t | -65.3279 | 0.0000 |
| Dickey-Fuller t | -22.0412 | 0.0000 |
| Augmented Dickey-Fuller t | -20.1616 | 0.0000 |
| Unadjusted modified Dickey Fuller | -34.4728 | 0.0000 |
| Unadjusted Dickey-Fuller t | -19.4993 | 0.0000 |
表4 面板数据模型估计结果Tab.4 Estimation results of Panel data model |
| 变量及统计指标 | 普通动态面板模型 | 空间动态面板模型 | ||
|---|---|---|---|---|
| 动态模型(全样本) | 动态模型(除武汉) | 空间杜宾模型(全样本) | 空间杜宾模型(除武汉) | |
| PCD | 0.00035*** | -0.00005*** | 0.00011*** | -0.00002*** |
| (6795.78) | (-1.7e+04) | (9.14) | (-4.57) | |
| CNC | 0.979*** | 1.008*** | 0.982*** | 0.997*** |
| (1.4e+07) | (8.6e+06) | (2100.63) | (469.85) | |
| CCD | -1.037*** | -1.042*** | -1.044*** | -1.039*** |
| (-5.0e+07) | (-6.4e+06) | (-2332.26) | (-519.66) | |
| L.NCD | 0.012*** | 0.005*** | -0.014*** | -0.015*** |
| (8.5e+05) | (56479.92) | (-27.79) | (-6.94) | |
| L2.NCD | -0.023*** | -0.027*** | ||
| (-1.6e+06) | (-1.8e+05) | |||
| _cons | 0.515*** | 0.490*** | ||
| (39.06) | (119.15) | |||
| Wx:CNC | 0.009*** | 0.011*** | ||
| (13.75) | (16.10) | |||
| Spatial:rho | 0.003*** | 0.009*** | ||
| (3.49) | (9.29) | |||
| Variance: | ||||
| sigma2_e | 37.523*** | 6.899*** | ||
| (81.93) | (81.79) | |||
| N | 12 129 | 12 168 | 12 792 | 12 751 |
注:* p<0.05, **p<0.01, *** p<0.001, 括号内为对应系数t值; L.NCD、L2.NCD分别表示变量NCD的1阶和2阶滞后项。 |
真诚感谢匿名评审专家在论文评审中所付出的时间和精力,评审专家对本文多种研究方法的合理性、实证分析的稳健性及结论梳理等方面的修改意见使本文获益良多。
| [1] |
杨政, 原子霞, 贾祖瑶. 基于迁徙数据估计武汉感染新型冠状病毒的人员数量[J]. 电子科技大学学报, 2020,49(3):330-338.
[
|
| [2] |
王霞, 唐三一, 陈勇, 等. 新型冠状病毒肺炎疫情下武汉及周边地区何时复工?数据驱动的网络模型分析[J/OL]. 中国科学:数学:1-10[ 2020- 02- 25]. http://kns.cnki.net/kcms/detail/11.5836.o1.20200220.1907.002.html.
[
|
| [3] |
范如国, 王奕博, 罗明, 等. 基于SEIR的新型肺炎传播模型及拐点预测分析[J/OL]. 电子科技大学学报:1-6.[ 2020- 02- 27]. http://kns.cnki.net/kcms/detail/51.1207.T.20200221.1041.002.html.
[
|
| [4] |
严阅, 陈瑜, 刘可伋, 等. 基于一类时滞动力学系统对新型冠状病毒肺炎疫情的建模和预测[J]. 中国科学:数学, 2020,50(3):1-8.
[
|
| [5] |
喻孜, 张贵清, 刘庆珍, 等. 基于时变参数-SIR模型的COVID-19疫情评估和预测[J]. 电子科技大学学报, 2020,49(3):357-361.
[
|
| [6] |
王聪, 严洁, 王旭, 李敏. 新型冠状病毒肺炎早期时空传播特征分析[J]. 物理学报, 2020,69(8):249-258.
[
|
| [7] |
王皎贝, 李钢, 王建坡, 等. 陕西省COVID-19疫情时空演化与风险画像[J]. 热带地理, 2020,40(3):432-445.
[
|
| [8] |
王姣娥, 杜德林, 魏冶, 等. 新冠肺炎疫情的空间扩散过程与模式研究[J]. 地理研究, 2020,39(7):1450-1462.
[
|
| [9] |
蔺茂文, 刘天, 田克卿, 等. 荆州市新型冠状病毒肺炎时空分布特征分析[J]. 上海交通大学学报(医学版), 2020,40(5):566-572.
[
|
| [10] |
张新, 林晖, 朱长明, 等. COVID-19疫情早期中国确诊时间的时空特征及动态过程分析[J]. 武汉大学学报·信息科学版, 2020,45(6):791-797.
[
|
| [11] |
夏吉喆, 周颖, 李珍, 等. 城市时空大数据驱动的新型冠状病毒传播风险评估——以粤港澳大湾区为例[J]. 测绘学报, 2020,49(6):671-680.
[
|
| [12] |
陈晓慧, 刘俊楠, 徐立, 等. COVID-19病例活动知识图谱构建——以郑州市为例[J]. 武汉大学学报·信息科学版, 2020,45(6):816-825.
[
|
| [13] |
周松, 沈蕾, 王伟. 从时空大数据的角度分析评价江苏省新冠疫情发展趋势[J]. 现代测绘, 2020,43(3):5-10.
[
|
| [14] |
张延炀, 肖占沛, 杨凯朝, 等. 河南省新型冠状病毒肺炎时空聚集性[J]. 中华疾病控制杂志, 2020,24(5):534-538,572.
[
|
| [15] |
|
| [16] |
|
| [17] |
宗跃光, 王莉, 曲秀丽. 基于蒙特卡罗模拟法的北京地区非典时空变化特征[J]. 地理研究, 2004,23(6):815-824.
[
|
| [18] |
曹志冬, 王劲峰, 高一鸽, 等. 广州SARS流行的空间风险因子与空间相关性特征[J]. 地理学报, 2008,69(9):981-993.
[
|
| [19] |
丁四保, 赵伟, 相伟. 分析SARS:在我国的地理扩散和地理障碍[J]. 人文地理, 2004,19(2):74-78.
[
|
| [20] |
徐旳, 柯文前, 陈培阳. 基于ESDA的河南艾滋病空间格局[J]. 地理研究, 2013,32(7):1199-1208.
[
|
| [21] |
王少剑, 王洋, 赵亚博. 1990年来广东区域发展的空间溢出效应及驱动因素[J]. 地理学报, 2015,70(6):965-979.
[
|
| [22] |
徐建华. 现代地理学中的数学方法[M]. 北京: 高等教育出版社, 1996.
[
|
| [23] |
|
| [24] |
张新林, 仇方道, 王长建, 等. 长三角城市群工业生态效率空间溢出效应及其影响因素[J]. 长江流域资源与环境, 2019,28(8):1791-1800.
[
|
| [25] |
|
| [26] |
ESRI. ArcGIS Desktop Help:Optimized Hot Spot Analysis[G/OL], https://desktop.arcgis.com/en/arcmap/latest/tools/spatial-statistics-toolbox/optimized-hot-spot-analysis.htm.
|
| [27] |
刘浩, 马琳, 李国平. 京津冀地区经济发展冷热点格局演化及其影响因素[J]. 地理研究, 2017,36(1):97-108.
[
|
| [28] |
曾永明, 张利国. 新经济地理学框架下人口分布对经济增长的影响效应——全球126个国家空间面板数据的证据:1992—2012[J]. 经济地理, 2017,37(10):17-26.
[
|
| [29] |
罗能生, 王玉泽. 财政分权、环境规制与区域生态效率——基于动态空间杜宾模型的实证研究[J]. 中国人口·资源与环境, 2017,27(4):110-118.
[
|
| [30] |
Federico Belotti & Gordon Hughes & Andrea Piano Mortari, 2013. "XSMLE: Stata module for spatial panel data models estimation," Statistical Software Components S457610,Boston College Department of Economics, revised 07 Jun 2017.
|
/
| 〈 |
|
〉 |
