
Journal of Geo-information Science >
The Expansion and Gradient Evolution of Impervious Surface within the Guangdong-Hong Kong-Macao Greater Bay Area from 1987 to 2017
Received date: 2020-04-24
Request revised date: 2020-06-12
Online published: 2021-05-25
Supported by
National Natural Science Foundation of China(41871292)
the Science and Technology Program of Guangdong Province, China(2018B020207002)
the Science and Technology Program of Guangzhou, China(201803030034)
the Science and Technology Program of Guangzhou, China(201802030008)
Copyright
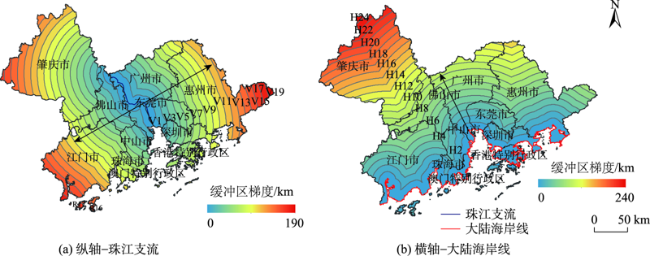
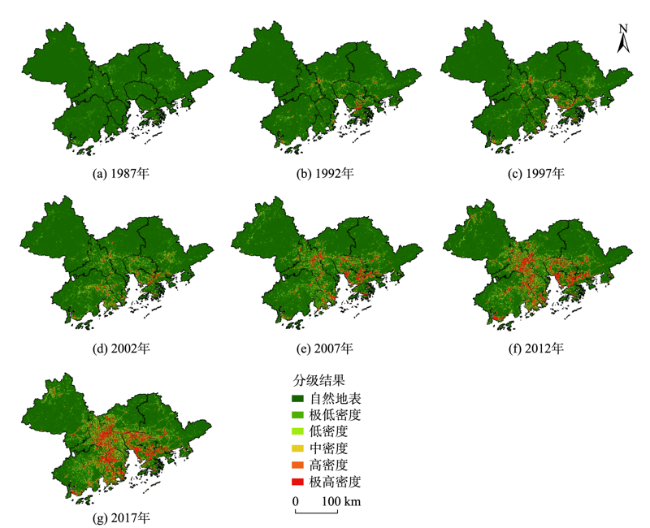
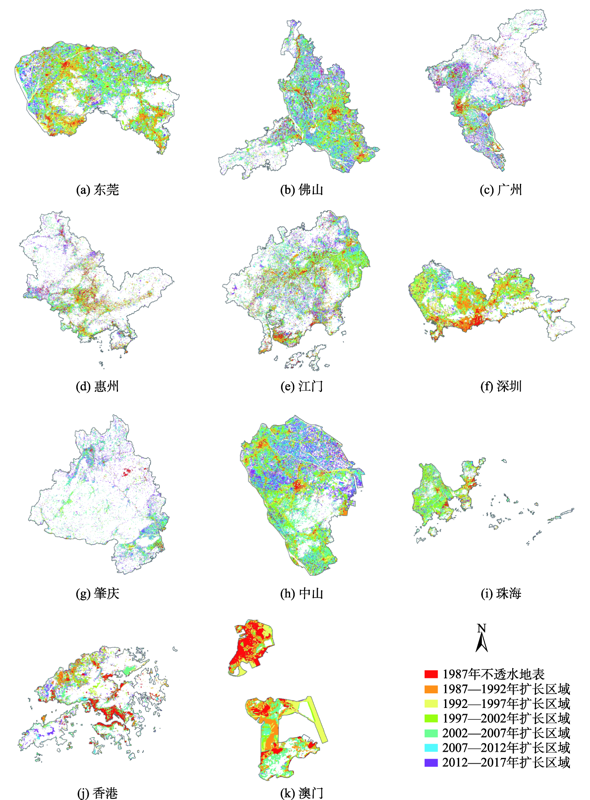
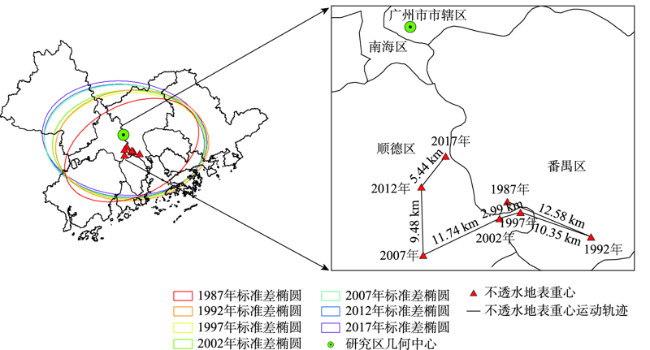
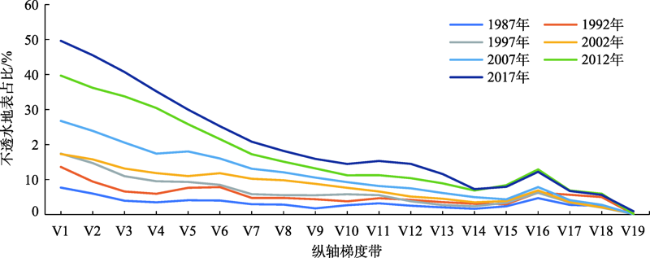
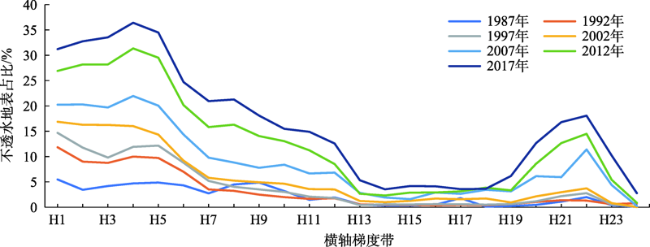
The impervious surface is considered an important feature to measure the urbanization and its spatial expansion. In the current study, the spatial-temporal expansion characteristics and evolution trends of the impervious surface are explored using gravity center, standard deviation ellipse, and gradient analysis in Guangdong-Hong Kong-Macao (GHM) Greater Bay Area during 1987-2017. The results show that: (1) The impervious surface areas of GHM Greater Bay Area has increased from 1839.34 km2 to 12 385.93 km2 in the past 30 years, with an annual growth area of 351.55 km2. In the 21st century, the urbanization process accelerated, and and each city exhibited different expansion characteristics. Moreover, it formed a spatial expansion pattern driven by core cities such as Guangzhou, Shenzhen, Hong Kong, and Macao, resulting in the formation of various secondary cities, and the development of network structures; (2) Urban construction and expansion are close to the coastal area. The gravity center of the impervious surface of the GHM Greater Bay Area is located near the junction of Panyu, Guangzhou, and Shunde, Foshan. However, the gravity center and urban development trends are from west to the east bank of the Pearl River, and toward Guangzhou, Dongguan, and Foshan. The urban development of Guangzhou, Dongguan, and Foshan promoted the change of gravity center of impervious surface; (3) The urban development of the GHM Greater Bay Area has apparent features of the expansion along the Pearl River and the coastline. Urban construction along both sides of the Pearl River tributary has always occupied a central position. Early urban construction was concentrated in the 70 km area on both sides, and the intensity of urban expansion increased sharply in the 21st century. The area within 50 km of the coastline is an urban high-intensity construction area. The expansion of the core urban and bay area in various places constitutes the development core of the GHM Greater Bay Area. Moreover, the urban construction has formed a coordinated development trend that is dominated by the main urban area and supplemented by the coastline. Furthermore, Although the construction of the GHM Greater Bay Area has become China's national strategy, but there exist problems due to the weak connections between cities. It is necessary to strengthen the interaction of elements in various cities, and make full use of the leading advantages of the core urban area to develop coastal industries, so as to realize the integration of urban and rural areas and economic development in the GHM Greater Bay Area.

CHEN Mingfa , LIU Fan , ZHAO Yaolong , YANG Guang . The Expansion and Gradient Evolution of Impervious Surface within the Guangdong-Hong Kong-Macao Greater Bay Area from 1987 to 2017[J]. Journal of Geo-information Science, 2021 , 23(3) : 443 -455 . DOI: 10.12082/dqxxkx.2021.200195
表1 Landsat系列影像成像时间Tab. 1 Landsat series imaging time |
| 传感器 条代号 | TM | ETM+ | ETM | OLI | ||||||
|---|---|---|---|---|---|---|---|---|---|---|
| 1987年 | 1991-1993年 | 1997年前后 | 2002年前后 | 2007年 | 2012年前后 | 2017年 | ||||
| 121/44 | 1987-12-17 | 1991-10-11 | 1997-01-10 | 2001-12-31 | 2007-11-14 | 2012-10-10 | 2017-11-01 | |||
| 121/45 | 1987-12-17 | 1991-10-11 | 1997-01-10 | 2002-02-17 | 2007-01-30 | 2013-10-05 | 2017-12-19 | |||
| 122/43 | 1987-12-08 | 1993-10-05 | 1997-11-01 | 2002-11-07 | 2007-10-20 | 2012-11-02 | 2017-12-26 | |||
| 122/44 | 1987-12-08 | 1993-10-05 | 1997-11-01 | 2002-11-07 | 2007-09-18 | 2012-11-02 | 2017-10-23 | |||
| 122/45 | 1987-12-08 | 1991-09-14 | 1997-11-01 | 2002-01-07 | 2007-09-18 | 2013-10-20 | 2017-10-23 | |||
| 123/43 | 1987-09-10 | 1993-10-12 | 1996-12-23 | 2001-12-29 | 2007-01-28 | 2012-12-25 | 2017-10-30 | |||
| 123/44 | 1987-09-10 | 1991-09-21 | 1997-09-05 | 2001-12-29 | 2007-01-28 | 2012-12-25 | 2017-10-30 | |||
| 123/45 | 1987-09-10 | 1993-12-31 | 1997-01-08 | 2001-12-29 | 2007-01-28 | 2012-12-25 | 2017-10-30 | |||
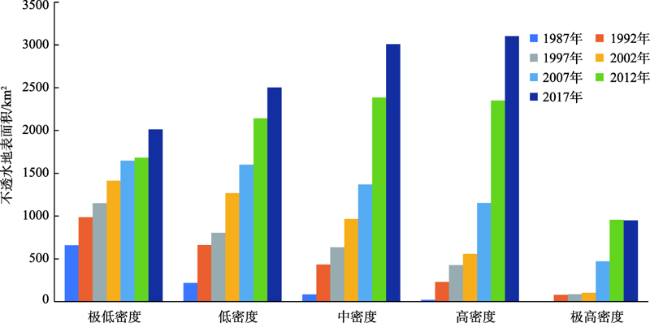
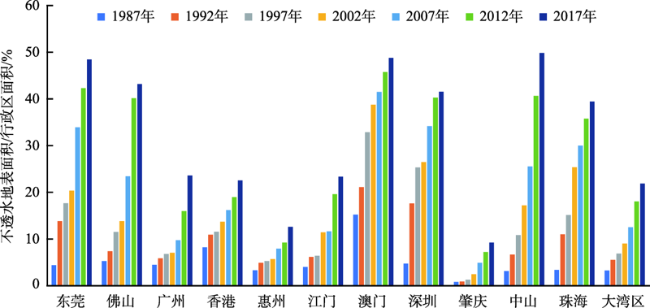
表2 1987-2017年粤港澳大湾区内部各城市不透水地表面积Tab. 2 Impervious surface area of cities within Guangdong-Hong Kong-Macao Greater Bay Area (km2) |
| 地市名称 | 1987年 | 1992年 | 1997年 | 2002年 | 2007年 | 2012年 | 2017年 |
|---|---|---|---|---|---|---|---|
| 东莞 | 107.87 | 341.39 | 435.47 | 501.57 | 835.28 | 1042.12 | 1193.75 |
| 佛山 | 209.13 | 293.89 | 458.28 | 549.55 | 931.91 | 1595.31 | 1715.62 |
| 广州 | 334.08 | 437.49 | 504.60 | 522.14 | 723.73 | 1188.63 | 1754.50 |
| 香港 | 90.92 | 120.71 | 127.87 | 151.41 | 179.21 | 209.60 | 249.27 |
| 惠州 | 381.83 | 568.06 | 614.07 | 662.09 | 921.33 | 1071.61 | 1464.75 |
| 江门 | 381.33 | 585.89 | 610.46 | 1083.48 | 1106.33 | 1863.64 | 2217.92 |
| 澳门 | 5.00 | 6.92 | 10.78 | 12.71 | 13.61 | 15.01 | 16.00 |
| 深圳 | 94.86 | 352.01 | 505.84 | 528.13 | 682.27 | 804.37 | 829.22 |
| 肇庆 | 120.88 | 133.33 | 188.96 | 368.89 | 734.95 | 1084.56 | 1381.67 |
| 中山 | 55.62 | 118.85 | 193.27 | 306.39 | 455.39 | 724.67 | 888.51 |
| 珠海 | 57.82 | 188.39 | 259.14 | 433.98 | 513.02 | 612.08 | 674.72 |
| 大湾区 | 1839.34 | 3146.93 | 3908.74 | 5120.34 | 7097.03 | 10211.60 | 12385.93 |
图5 不同时期粤港澳大湾区内部各城市的不透水地表面积占比Fig. 5 Proportion of impervious land surface area of cities within Guangdong-Hong Kong-MacaoGreater Bay Area in different periods |
表3 粤港澳大湾区内部各城市不透水地表面积的年均增长率Tab. 3 Annual average growth rate of impervious surface area of cities within Guangdong-Hong Kong-Macao Greater Bay Area (%) |
| 年均增长率 | 中山 | 东莞 | 佛山 | 深圳 | 珠海 |
|---|---|---|---|---|---|
| 1987-2017年 | 1.56 | 1.47 | 1.26 | 1.23 | 1.20 |
| 2002-2017年 | 2.18 | 1.87 | 1.96 | 1.01 | 0.94 |
| 江门 | 广州 | 香港 | 惠州 | 肇庆 | |
| 1987-2017年 | 0.64 | 0.63 | 0.48 | 0.31 | 0.28 |
| 2002-2017年 | 0.80 | 1.11 | 0.59 | 0.46 | 0.45 |
| [1] |
|
| [2] |
中华人民共和国国家统计局. 中华人民共和国2019年国民经济和社会发展统计公报[M]. 北京: 中国统计出版社, 2020.
[ Chinese National Bureau of Statistics. Statistical communiqué of the People's Republic of China on 2019 national economic and social development[M]. Beijing: China Statistics Press, 2020. ]
|
| [3] |
|
| [4] |
徐涵秋. 城市不透水面与相关城市生态要素关系的定量分析[J]. 生态学报, 2009,29(5):2456-2462.
[ Quantitative analysis on the relationship of urban i mpervious surface with other components of the urban ecosystem[J]. Acta Ecologica Sinica, 2009,29(5):2456-2462. ]
|
| [5] |
杨保军. 区域协调发展析论[J]. 城市规划, 2004,28(5):20-24.
[
|
| [6] |
顾朝林. 城市群研究进展与展望[J]. 地理研究, 2011,30(5):771-784.
[
|
| [7] |
焦利民, 唐欣, 刘小平. 城市群视角下空间联系与城市扩张的关联分析[J]. 地理科学进展, 2016,35(10):1177-1185.
[
|
| [8] |
欧阳晓, 朱翔. 中国城市群城市用地扩张时空动态特征[J]. 地理学报, 2020,75(3):571-588.
[
|
| [9] |
黎夏, 叶嘉安. 利用主成分分析改善土地利用变化的遥感监测精度——以珠江三角洲城市用地扩张为例[J]. 遥感学报, 1997,1(4):282-289.
[
|
| [10] |
|
| [11] |
|
| [12] |
|
| [13] |
|
| [14] |
匡文慧, 刘纪远, 张增祥, 等. 21世纪初中国人工建设不透水地表遥感监测与时空分析[J]. 科学通报, 2013(5):465-478.
[
|
| [15] |
|
| [16] |
|
| [17] |
|
| [18] |
高邵鑫, 陈健, 郑凯端, 等. 长三角地区不透水面多时相遥感提取及变化监测[J]. 科技通报, 2018,34(10):80-92.
[
|
| [19] |
冯珊珊, 樊风雷. 2006―2016年粤港澳大湾区城市不透水面时空变化与驱动力分析[J]. 热带地理, 2018,38(4):536-545.
[
|
| [20] |
冯珊珊, 樊风雷. 基于不透水面的粤港澳大湾区景观格局时空变化[J]. 应用生态学报, 2018,29(9):113-120.
[
|
| [21] |
|
| [22] |
|
| [23] |
|
| [24] |
|
| [25] |
|
| [26] |
|
| [27] |
|
| [28] |
付强, 诸云强, 孙九林, 等. 中国畜禽养殖的空间格局与重心曲线特征分析[J]. 地理学报, 2012,67(10):89-104.
[
|
| [29] |
|
| [30] |
晁静, 赵新正, 李同昇, 等. 长江经济带三大城市群经济差异演变及影响因素——基于多源灯光数据的比较研究[J]. 经济地理, 2019,39(5):92-100.
[
|
| [31] |
刘有明. 流域经济区产业发展模式比较研究[J]. 学术研究, 2011(3):83-88.
[
|
| [32] |
魏正波. 中国特色的城市海岸带规划体系初探[C]. 北京:中国城市规划年会, 2008, 3681-3692.
[
|
| [33] |
高义, 苏奋振, 孙晓宇, 等. 近20a广东省海岛海岸带土地利用变化及驱动力分析[J]. 海洋学报:中文版, 2011,33(4):97-195.
[
|
| [34] |
|
| [35] |
|
/
| 〈 |
|
〉 |