
Journal of Geo-information Science >
Evaluation of Human Suitability of Human Settlement Environment in Anhui Province based on Grid
Received date: 2020-07-04
Request revised date: 2020-10-29
Online published: 2021-08-25
Supported by
University Natural Science Research Project of Anhui Province(KJ2019A0496)
Copyright
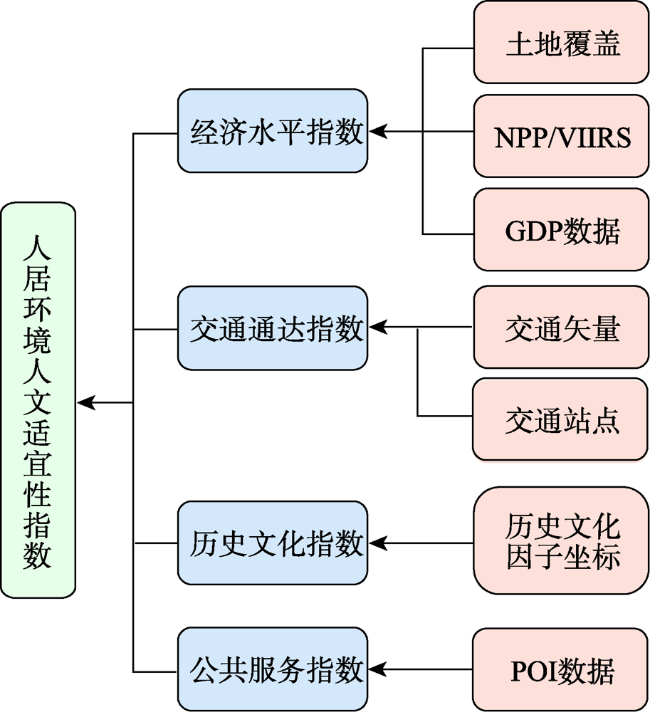
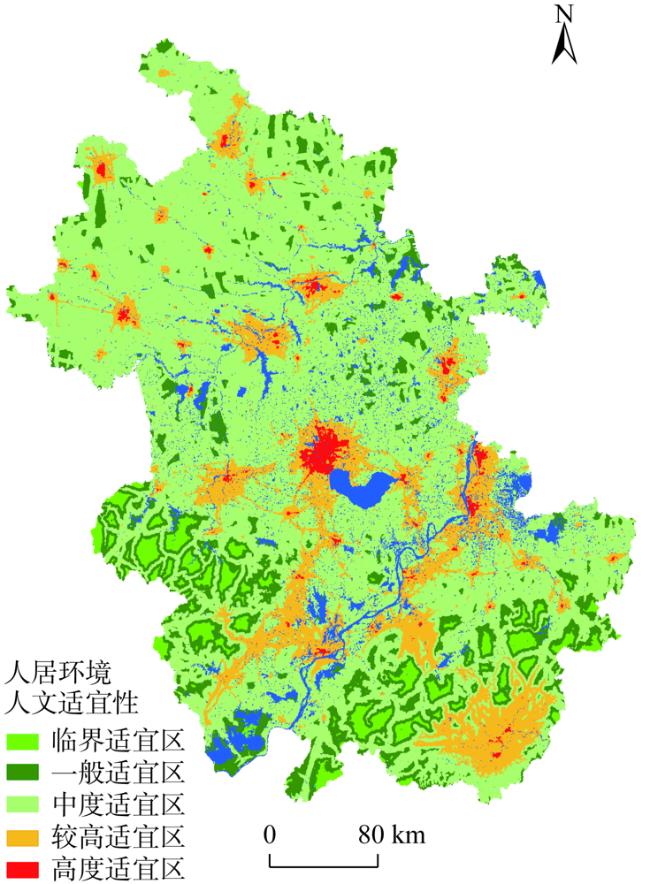
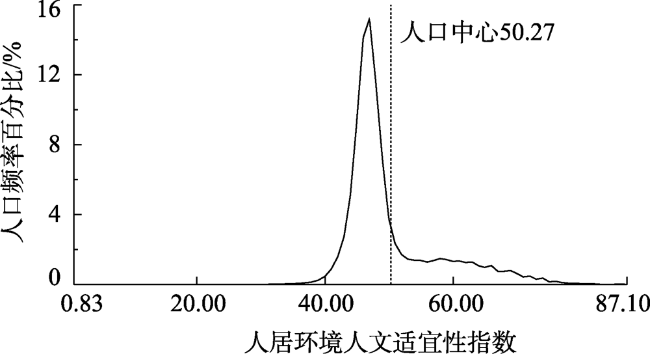
The construction of new urbanization puts forward practical requirements for a suitable human settlement environment in the new period. By using GIS technology, based on multi-source data such as Nighttime Light (NTL) data, traffic network vectors data, Points of Interest (POI) data, and statistical yearbooks, we selected the economic level, transportation accessibility, historical culture, and public service as impact factors of the suitability of human settlement environment (weights were 0.36, 0.27, 0.17, 0.20, respectively) on the basis of 500 m × 500 m grid unit. We quantitatively evaluated the human suitability of human settlement environment in Anhui Province in 2017 using a synthetical index method to construct the human suitability evaluation model. The results show that: (1) the human suitability index of human settlements in Anhui Province ranged from 0.83 to 87.10. The human settlement environment could be divided into five types: highly suitable areas, relatively suitable areas, moderately suitable areas, general suitable areas, and critical suitable areas. The area of moderately suitable areas was the largest, accounting for 68.72% of the whole province, while the area of highly suitable areas was the smallest, accounting for only 1.24% of the whole province. The spatial heterogeneity of human settlement suitability was characterized by "Multi-core" and "striped" patterns; (2) the transport accessibility and public service were the main factors that led to difference in human suitability of human settlements in the province, with an average index of 94.18 in the moderate suitable areas, and an average contribution rate of 34% in all types of regions. Besides, the historical culture had a significant impact on higher and critically suitable areas, with an average contribution rates of 10.51% and 10.53%, respectively, while the economic level had the most significant contribution to the highly suitable areas, with an average contribution rate of 22.02%; and (3) nearly 90.86% of the population in the province was concentrated in the regions with human suitability index of 43.00~66.00 (i.e., moderate to the high suitable areas), which implied that the human quality of human settlements matches the population distribution. In conclusion, our evaluation results objectively reflect the baseline of the human settlements in Anhui Province.
LI Dawei , HUANG Weiwei , SHEN Fei , CHENG Yu , CHEN Mingyang . Evaluation of Human Suitability of Human Settlement Environment in Anhui Province based on Grid[J]. Journal of Geo-information Science, 2021 , 23(6) : 1017 -1027 . DOI: 10.12082/dqxxkx.2021.200346
表1 2017年安徽省历史文化因子分类Tab. 1 Classification of historical and cultural factors in Anhui Province in 2017 |
| 类别 | 数量/条 | 示例 |
|---|---|---|
| 历史文化传统(名)村落 | 487 | 范岗镇新西村、城关镇沈丘集村 |
| 省文物保护单位 | 447 | 人字洞遗址、龙潭洞遗址 |
| 宗教建筑 | 2590 | 寺庙、道观、教堂、祠堂 |
| 风景名胜(人文) | 2291 | 周瑜墓、曹操运兵道 |
表2 2017年安徽省公共服务POI数据分类Tab. 2 Public service POI data classification in Anhui Province in 2017 |
| POI类别 | 次级因子 | 数量/条 |
|---|---|---|
| 购物 | 超市,商场,市场 | 20 665,1402,1820 |
| 医疗 | 医院,社区(村)卫生室,药店 | 1250,15 580,10 802 |
| 教育 | 大学,普通高中,小学 | 119,3890,8549 |
| 科技文化 | 图书馆,文化宫,科研机构(除去企业所属),科技馆 | 431,1133,1949,72 |
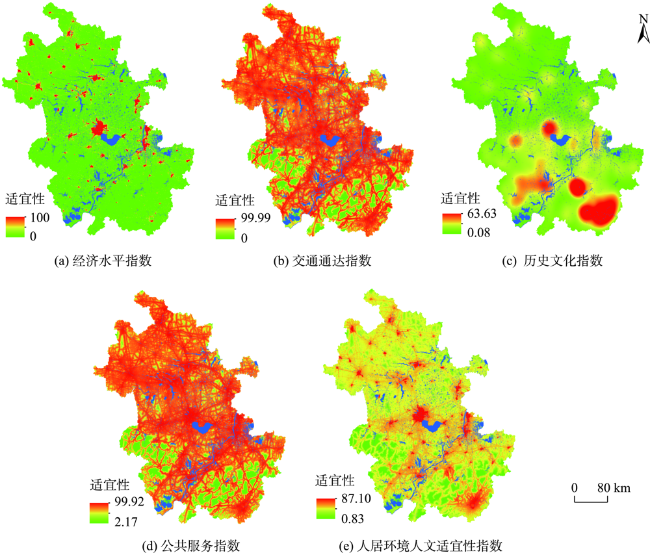
图3 2017年安徽省各单因子指数及人居环境人文适宜性指数空间分布Fig. 3 Spatial distribution of the single factor index and human settlement environment humanity suitability index in Anhui Province in 2017 |
表3 2017年安徽省人居环境人文适宜性评价Tab. 3 Evaluation of humane suitability of human settlement environment in Anhui Province in 2017 |
| 类型区 | 人文适宜性指数 | 土地 | 人口 | 人口密度/ (人/500 m2) | |||
|---|---|---|---|---|---|---|---|
| 面积/km2 | 比例/% | 总数/万人 | 比例/% | ||||
| 高度适宜区 | 58.40~87.10 | 1208.97 | 1.24 | 908.86 | 14.53 | 1423 | |
| 较高适宜区 | 48.32~58.40 | 14 808.93 | 15.24 | 1311.15 | 20.96 | 168 | |
| 中度适宜区 | 42.28~48.32 | 66 775.83 | 68.72 | 3757.22 | 60.07 | 107 | |
| 一般适宜区 | 34.52~42.28 | 11 287.72 | 11.62 | 265.52 | 4.25 | 45 | |
| 临界适宜区 | 0.83~34.52 | 3088.52 | 3.18 | 12.05 | 0.19 | 8 | |
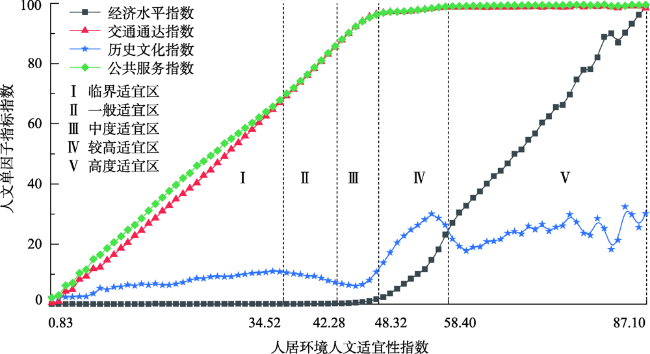
图5 2017年安徽省不同适宜区各单因子指标曲线Fig. 5 The single factor index curve of different suitable areas in Anhui Province in 2017 |
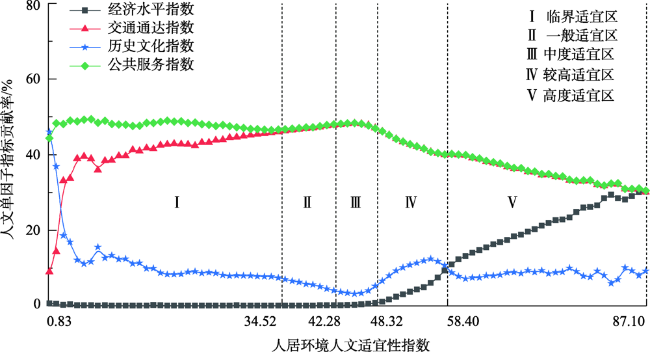
图6 2017年安徽省不同适宜区各单因子指标贡献率曲线Fig. 6 Contribution rate curve of each single factor index in different suitable areas in Anhui Province in 2017 |
表4 2017年安徽省人居环境人文适宜性分区指标特征Tab. 4 The characteristics of the zoning indicators of human settlements in Anhui Province in 2017 |
 类型区 类型区 | 经济水平指数 | 交通通达指数 | 历史文化指数 | 公共服务指数 | ||||
|---|---|---|---|---|---|---|---|---|
| 指数均值 | 第二、第三产业比重/% | 指数均值 | 耗时均值/min | 指数均值 | 每万人 占有数/个 | 指数 均值 | 耗时均值 /min | |
| 高度适宜区 | 64.42 | 99.66 | 98.82 | 4.94 | 24.11 | 4.57 | 99.35 | 1.80 |
| 较高适宜区 | 12.86 | 94.48 | 97.92 | 9.49 | 23.83 | 1.86 | 98.02 | 6.05 |
| 中度适宜区 | 1.08 | 77.55 | 94.22 | 19.98 | 7.39 | 0.79 | 94.18 | 13.83 |
| 一般适宜区 | 0.15 | 39.79 | 73.88 | 50.94 | 9.11 | 0.23 | 74.65 | 40.89 |
| 临界适宜区 | 0.06 | 12.53 | 33.28 | 103.77 | 6.87 | 2.47 | 36.67 | 89.09 |
表5 2017年人居环境人文适宜性分区贡献率均值Tab. 5 Average contribution rate of human settlements and humanistic suitability in 2017 (%) |
| 类型区 | 经济水平指数 贡献率均值 | 交通通达指数 贡献率均值 | 历史文化指数 贡献率均值 | 公共服务指数 贡献率均值 |
|---|---|---|---|---|
| 高度适宜区 | 22.02 | 34.69 | 8.41 | 34.88 |
| 较高适宜区 | 5.40 | 42.02 | 10.51 | 42.07 |
| 中度适宜区 | 0.54 | 47.60 | 4.28 | 47.58 |
| 一般适宜区 | 0.11 | 47.22 | 5.19 | 47.48 |
| 临界适宜区 | 0.12 | 40.08 | 11.93 | 47.57 |
| [1] |
吴良镛. 人居环境科学的探索[J]. 规划师, 2001(6):5-8.
[
|
| [2] |
魏献花, 白永平, 车磊, 等. 基于栅格的关中平原城市群人居环境质量综合评价[J]. 干旱区地理, 2019,42(5):1176-1184.
[
|
| [3] |
吴良镛. 人居环境科学的人文思考[J]. 城市发展研究, 2003(5):4-7.
[
|
| [4] |
吴良镛. 人居环境科学导论[M]. 北京: 中国建筑工业出版社, 2001.
[
|
| [5] |
张文忠, 谌丽, 杨翌朝. 人居环境演变研究进展[J]. 地理科学进展, 2013,32(5):710-721.
[
|
| [6] |
冯健, 钟奕纯. 基于居住环境的常州城市居民生活质量空间结构[J]. 地理学报, 2020,75(6):1237-1255.
[
|
| [7] |
|
| [8] |
|
| [9] |
封志明, 唐焰, 杨艳昭, 等. 基于GIS的中国人居环境指数模型的建立与应用[J]. 地理学报, 2008,63(12):1327-1336.
[
|
| [10] |
郝慧梅, 任志远. 基于栅格数据的陕西省人居环境自然适宜性测评[J]. 地理学报, 2009,64(4):498-506.
[
|
| [11] |
李雪铭, 夏春光, 张英佳. 近10年来我国地理学视角的人居环境研究[J]. 城市发展研究, 2014,21(2):6-13.
[
|
| [12] |
|
| [13] |
|
| [14] |
程婧媛. 开封理事厅街区人居环境保护发展研究[D]. 开封:河南大学, 2019.
[
|
| [15] |
|
| [16] |
余涤非. 需求视角下郑州市宜居性评价及障碍因子研究[D]. 开封:河南大学, 2019.
[
|
| [17] |
李雪铭, 张建丽, 杨俊, 等. 社区人居环境吸引力研究——以大连市为例[J]. 地理研究, 2012,31(7):1199-1208.
[
|
| [18] |
|
| [19] |
|
| [20] |
|
| [21] |
李雪铭, 田深圳, 杨俊, 等. 城市人居环境的失配度——以辽宁省14个市为例[J]. 地理研究, 2014,33(4):687-697.
[
|
| [22] |
刘海旭, 余斌, 张加磊, 等. 长江经济带城市人居环境空间格局研究[J]. 长江流域资源与环境, 2019,28(12):2795-2805.
[
|
| [23] |
邵磊, 厉基巍, 杨春志. 大数据视角下的未来人居——清华大学“大数据与未来人居”学术研讨会综述[J]. 城市发展研究, 2015,22(9):121-124.
[
|
| [24] |
李飞, 张树文, 杨久春, 等. 社会经济数据空间化研究进展[J]. 地理与地理信息科学, 2014,30(4):102-107.
[
|
| [25] |
杨俊, 由浩琳, 张育庆, 等. 从传统数据到大数据的人居环境研究进展[J]. 地理科学进展, 2020,39(1):166-176.
[
|
| [26] |
沈非, 黄艳萍, 王芳, 等. 基于GIS与栅格数据的安徽省人居环境自然适宜性测评[J]. 长江流域资源与环境, 2018,27(3):535-543.
[
|
| [27] |
陈玲玲, 查良松. 基于GIS的安徽省人居环境气候适宜性评价[J]. 蚌埠学院学报, 2014,3(3):161-164.
[
|
| [28] |
孙井东, 杨兴柱. 安徽城市人居环境质量时空演变特征[J]. 安徽师范大学学报(自然科学版), 2016,39(2):168-174.
[
|
| [29] |
赵诚瑞, 刘昕怡. 基于统计数据的安徽省城市人居环境定量评价[J]. 建筑与文化, 2020(1):147-149.
[
|
| [30] |
张文忠. 宜居城市的内涵及评价指标体系探讨[J]. 城市规划学刊, 2007(3):30-34.
[
|
| [31] |
赵万民, 周学红. 人居环境发展中的五律协同机制研究[J]. 城市问题, 2007(1):20-23.
[
|
| [32] |
吴江洁. 城市通勤时耗对个人幸福感与健康的影响研究[D]. 上海:华东师范大学, 2016.
[
|
| [33] |
武廷海. 吴良镛先生人居环境学术思想[J]. 城市与区域规划研究, 2008,1(2):233-268.
[
|
| [34] |
王怡鹤. 从安居到乐居——以东花岗为例的关于大型保障房住区社会融合度的思考[J]. 建筑与文化, 2018(7):168-169.
[
|
| [35] |
金凤君. 基础设施与人类生存环境之关系研究[J]. 地理科学进展, 2001(3):275-284.
[
|
| [36] |
安徽省统计局, 国家统计局安徽调查总队. 安徽统计年鉴2018[M]. 北京: 中国统计出版社, 2018.
[ Anhui provincial bureau of statistics, Anhui investigation team, National bureau of statistics. Anhui statistical yearbook of 2018[M]. Beijing: China Statistics Press, 2018. ]
|
| [37] |
杨雪, 张文忠. 基于栅格的区域人居自然和人文环境质量综合评价——以京津冀地区为例[J]. 地理学报, 2016,71(12):2141-2154.
[
|
| [38] |
王振波, 徐建刚, 朱传耿, 等. 中国县域可达性区域划分及其与人口分布的关系[J]. 地理学报, 2010,65(4):416-426.
[
|
| [39] |
胡云锋, 赵冠华, 张千力. 基于夜间灯光与LUC数据的川渝地区人口空间化研究[J]. 地球信息科学学报, 2018,20(1):68-78.
[
|
/
| 〈 |
|
〉 |