
Journal of Geo-information Science >
Application of Machine Learning Method in Prediction of Potential Exposure Position of Spring Water
Received date: 2020-09-11
Request revised date: 2020-12-12
Online published: 2021-08-25
Copyright
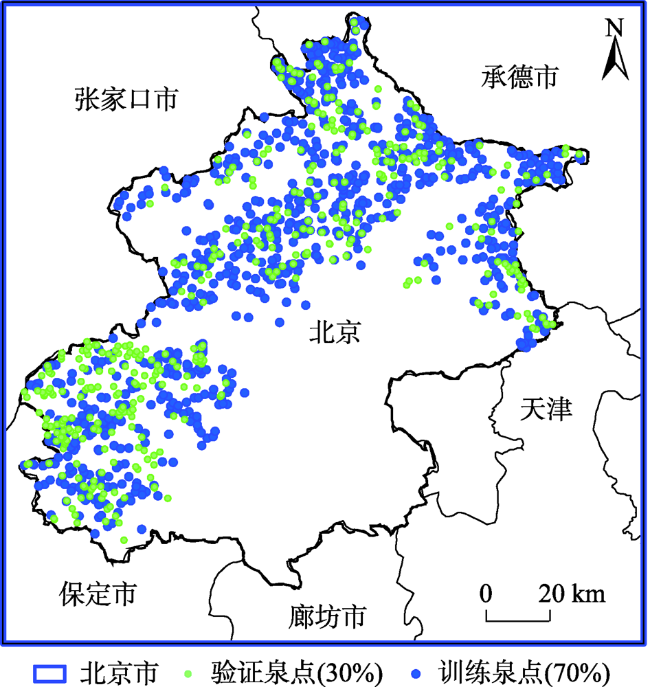
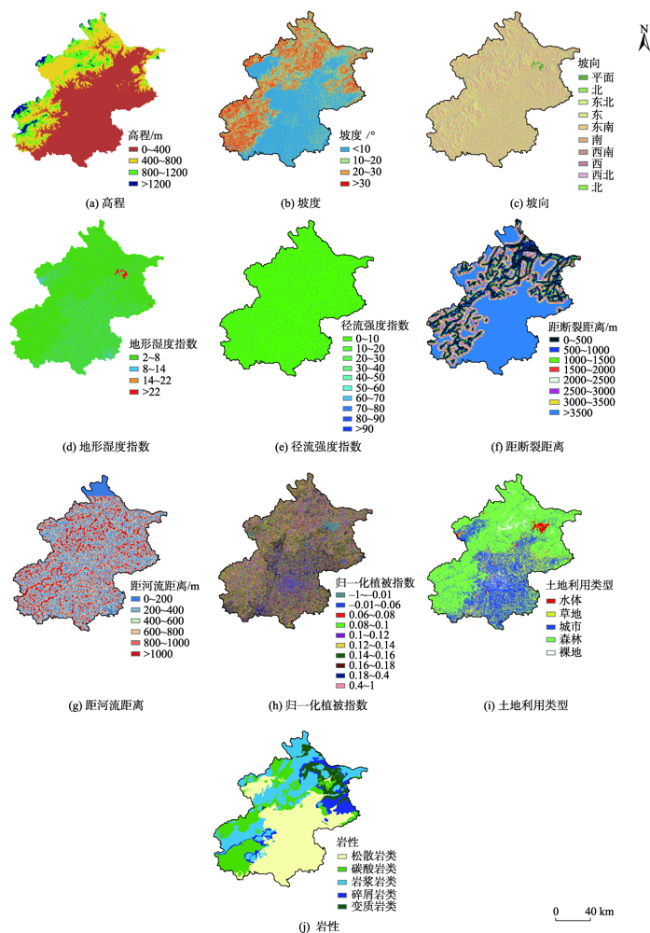
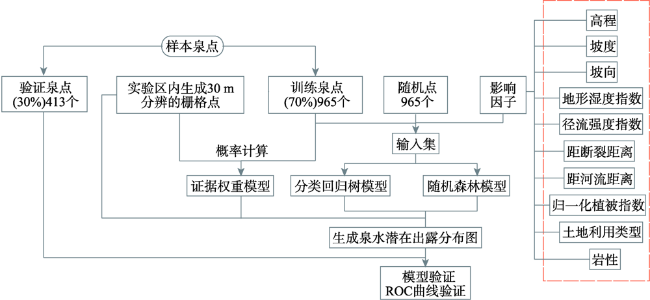
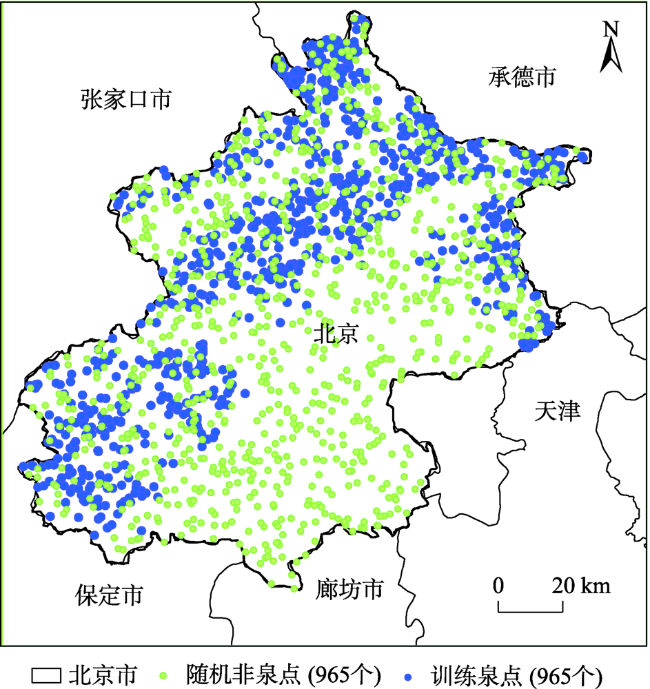
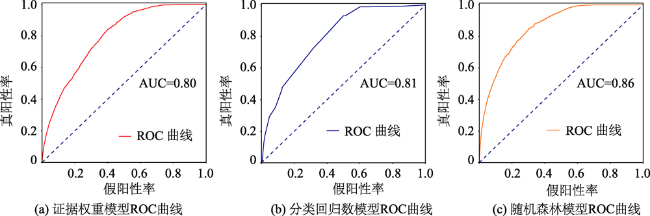
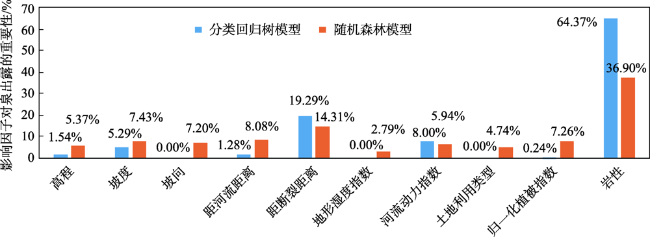
The exposure of spring is usually difficult to be monitored over mountainous terrain. In this study we investigated the performance of statistical models (Weight of Evidence) and two machine learning models (Random Forest and Classification and Regression Tree) in predicting the potential exposure positions of spring water in Beijing. A total of 1378 springs from field survey were used for model training and validation. The environmental factors included elevation, slope, aspect, topographic wetness index, stream power index, distance to rivers, distance to faults, lithology, normalized difference vegetation index, and land use. The predicted results from the three models are validated using the receiver operating characteristics curve. The area under the curve for the Weight of Evidence model was 0.80, while that for Classification and Regression Tree and Random Forest the AUC was 0.81 and 0.86, respectively. Therefore, the Random Forest model has the best prediction performance. Moreover, the Random Forest model revealed that lithology, distance to faults, and distance to rivers had the greatest impact on the spring exposure. This study shows that the machine learning method has good prediction ability and is expected to be applied in future spring protection and restoration researches.
LI Huixiang , PAN Yun , GONG Huili , SUN Ying . Application of Machine Learning Method in Prediction of Potential Exposure Position of Spring Water[J]. Journal of Geo-information Science, 2021 , 23(6) : 1028 -1039 . DOI: 10.12082/dqxxkx.2021.200522
表2 计算的各影响因子权重Tab. 2 Weight calculation of each influence factor |
| 影响因子 | 分类 | 栅格数目/个 | 训练泉点数目 | 正相关权重W+ | 负相关权重W- | 空间相关性C | 后验概率P(s) | |
|---|---|---|---|---|---|---|---|---|
| 高程/m | <0 | 175 681 | 0 | - | - | - | 0 | |
| 0~400 | 10 485 480 | 326 | -0.5338 | 0.4460 | -0.9798 | 3.1091E-05 | ||
| 400~800 | 5 103 572 | 486 | 0.5857 | -0.3714 | 0.9570 | 9.5234E-05 | ||
| 800~1200 | 2 033 781 | 133 | 0.2098 | -0.0298 | 0.2396 | 6.5399E-05 | ||
| 1200~1600 | 345 649 | 20 | 0.0874 | -0.0018 | 0.0892 | 5.7865E-05 | ||
| 坡度/° | 0~10 | 9 015 882 | 379 | -0.2321 | 0.1851 | -0.4172 | 4.2038E-05 | |
| 10~20 | 3 944 854 | 335 | 0.4711 | -0.1821 | 0.6532 | 8.4926E-05 | ||
| 20~30 | 3 054 769 | 171 | 0.0543 | -0.0113 | 0.0656 | 5.5981E-05 | ||
| 30~40 | 1 688 169 | 67 | -0.2896 | 0.0254 | -0.3150 | 3.9689E-05 | ||
| 40~50 | 438 911 | 12 | -0.6623 | 0.0119 | -0.6742 | 2.7341E-05 | ||
| 50~60 | 54 453 | 1 | -1.0602 | 0.0020 | -1.0622 | 1.8365E-05 | ||
| >60 | 3 361 | 0 | - | - | - | 0 | ||
| 坡向/° | 北 | 2 077 367 | 100 | -0.0966 | 0.0118 | -0.1084 | 4.8140E-05 | |
| 东北 | 2 214 218 | 126 | 0.0707 | -0.0102 | 0.0810 | 5.6908E-05 | ||
| 东 | 2 332 611 | 178 | 0.3642 | -0.0668 | 0.4309 | 7.6314E-05 | ||
| 东南 | 2 417 942 | 146 | 0.1301 | -0.0215 | 0.1516 | 6.0385E-05 | ||
| 南 | 2 480 078 | 133 | 0.0114 | -0.0018 | 0.0132 | 5.3630E-05 | ||
| 西南 | 2 233 444 | 89 | -0.2856 | 0.0342 | -0.3197 | 3.9850E-05 | ||
| 西 | 2 134 969 | 94 | -0.1858 | 0.0223 | -0.2081 | 4.4030E-05 | ||
| 西北 | 2 104 272 | 95 | -0.1607 | 0.0192 | -0.1800 | 4.5148E-05 | ||
| 平面 | 205 498 | 4 | -1.0021 | 0.0072 | -1.0093 | 1.9465E-05 | ||
| 影响因子 | 分类 | 栅格数目 | 训练泉点数目 | 正相关权重W + | 负相关权重W - | 空间相关性C | 后验概率P(s) | |
| 距河流距离/m | 0~200 | 4 093 718 | 460 | 0.7512 | -0.3928 | 1.1440 | 1.1238E-04 | |
| 200~400 | 3 554 978 | 153 | -0.2086 | 0.0447 | -0.2532 | 4.3040E-05 | ||
| 400~600 | 3 051 250 | 116 | -0.3326 | 0.0554 | -0.3880 | 3.8018E-05 | ||
| 600~800 | 2 537 820 | 88 | -0.4246 | 0.0545 | -0.4792 | 3.4676E-05 | ||
| 800~1000 | 1 999 299 | 66 | -0.4738 | 0.0455 | -0.5193 | 3.3013E-05 | ||
| >1000 | 2 963 334 | 82 | -0.6503 | 0.0889 | -0.7392 | 2.7672E-05 | ||
| 距断裂距离/m | 0~500 | 2 608 221 | 276 | 0.6911 | -0.1822 | 0.8734 | 1.0583E-04 | |
| 500~1000 | 1 951 677 | 148 | 0.3579 | -0.0531 | 0.4110 | 7.5837E-05 | ||
| 1000~1500 | 1 584 723 | 112 | 0.2875 | -0.0323 | 0.3197 | 7.0679E-05 | ||
| 1500~2000 | 1 311 105 | 90 | 0.2583 | -0.0231 | 0.2815 | 6.8649E-05 | ||
| 2000~2500 | 1 051 075 | 64 | 0.1384 | -0.0091 | 0.1476 | 6.0894E-05 | ||
| 2500~3000 | 841 660 | 41 | -0.0847 | 0.0039 | -0.0886 | 4.8716E-05 | ||
| 3000~3500 | 699 895 | 37 | -0.0029 | 0.0001 | -0.0030 | 5.2868E-05 | ||
| >3500 | 8 152 043 | 197 | -0.7857 | 0.3657 | -1.1514 | 2.4166E-05 | ||
| 地形湿度指数 | 2~8 | 14 966 464 | 663 | -0.1797 | 0.5660 | -0.7457 | 4.4299E-05 | |
| 8~14 | 2 935 668 | 248 | 0.4659 | -0.1212 | 0.5870 | 8.4484E-05 | ||
| 14~22 | 217 898 | 54 | 1.5423 | -0.0455 | 1.5878 | 2.4788E-04 | ||
| >22 | 80 369 | 0 | - | - | - | 0 | ||
| 径流强度指数 | 0~10 | 16 681 699 | 723 | -0.2016 | 1.1004 | -1.3019 | 4.3341E-05 | |
| 10~20 | 483 216 | 29 | 0.1240 | -0.0036 | 0.1276 | 6.0018E-05 | ||
| 20~30 | 199 579 | 19 | 0.5854 | -0.0089 | 0.5943 | 9.5209E-05 | ||
| 30~40 | 117 099 | 9 | 0.3714 | -0.0029 | 0.3743 | 7.6864E-05 | ||
| 40~50 | 79 251 | 14 | 1.2037 | -0.0103 | 1.2139 | 1.7668E-04 | ||
| 50~60 | 58 232 | 7 | 0.8187 | -0.0041 | 0.8227 | 1.2022E-04 | ||
| 60~70 | 45 302 | 8 | 1.2033 | -0.0058 | 1.2092 | 1.7662E-04 | ||
| 70~80 | 36 436 | 7 | 1.2876 | -0.0053 | 1.2929 | 1.9215E-04 | ||
| 80~90 | 30 290 | 4 | 0.9127 | -0.0025 | 0.9152 | 1.3207E-04 | ||
| >90 | 469 295 | 145 | 1.7629 | -0.1367 | 1.8996 | 3.0907E-04 | ||
| 归一化植被指数 | -1~-0.1 | 288 943 | 2 | -2.0360 | 0.0139 | -2.0499 | 6.9218E-06 | |
| -0.1~0.06 | 1 429 937 | 33 | -0.8318 | 0.0470 | -0.8788 | 2.3078E-05 | ||
| 0.06~0.08 | 1 617 730 | 90 | 0.0482 | -0.0048 | 0.0530 | 5.5636E-05 | ||
| 0.08~0.1 | 2 542 398 | 173 | 0.2496 | -0.0471 | 0.2967 | 6.8050E-05 | ||
| 0.1~0.12 | 3 778 473 | 257 | 0.2491 | -0.0770 | 0.3261 | 6.8021E-05 | ||
| 0.12~0.14 | 3 809 386 | 215 | 0.0625 | -0.0172 | 0.0798 | 5.6442E-05 | ||
| 0.14~0.16 | 2 284 891 | 132 | 0.0858 | -0.0130 | 0.0988 | 5.7774E-05 | ||
| 0.16~0.18 | 1 125 212 | 40 | -0.3997 | 0.0215 | -0.4212 | 3.5550E-05 | ||
| 0.18~0.4 | 1 312 834 | 24 | -1.0648 | 0.0497 | -1.1145 | 1.8281E-05 | ||
| 0.4~1 | 10 595 | 0 | - | - | - | 0 | ||
| 土地利用类型 | 水体 | 250 428 | 2 | -1.8929 | 0.0118 | -1.9047 | 7.9864E-06 | |
| 草地 | 2 199 456 | 34 | -1.2325 | 0.0929 | -1.3254 | 1.5459E-05 | ||
| 城市 | 5 059 188 | 206 | -0.2640 | 0.0856 | -0.3495 | 4.0719E-05 | ||
| 森林 | 10 003 205 | 676 | 0.2426 | -0.4081 | 0.6507 | 6.7580E-05 | ||
| 裸地 | 688 122 | 48 | 0.2744 | -0.0125 | 0.2869 | 6.9760E-05 | ||
| 岩性 | 松散岩类 | 7 370 387 | 15 | -3.2601 | 0.5035 | -3.7636 | 2.0352E-06 | |
| 碳酸岩类 | 3 768 433 | 198 | -0.0090 | 0.0023 | -0.0114 | 5.2544E-05 | ||
| 岩浆岩类 | 4 688 911 | 558 | 0.8086 | -0.5654 | 1.3740 | 1.1901E-04 | ||
| 碎屑岩类 | 1 264 728 | 98 | 0.3795 | -0.0351 | 0.4146 | 7.7493E-05 | ||
| 变质岩类 | 1 107 940 | 96 | 0.4912 | -0.0420 | 0.5332 | 8.6654E-05 | ||
表3 基于VIF和TOL指数的影响因子的多重共线性检验Tab. 3 Multicollinearity diagnosis indexes for independent variables used in the analysis |
| 影响因子 | VIF | TOL |
|---|---|---|
| 高程 | 1.305 | 0.766 |
| 坡度 | 1.410 | 0.709 |
| 坡向 | 1.021 | 0.979 |
| 距断裂距离 | 1.349 | 0.741 |
| 距河流距离 | 1.078 | 0.927 |
| 地形湿度指数 | 1.461 | 0.684 |
| 径流强度指数 | 1.375 | 0.727 |
| 土地利用 | 1.349 | 0.741 |
| 归一化植被指数 | 1.023 | 0.977 |
| 岩性 | 1.403 | 0.713 |
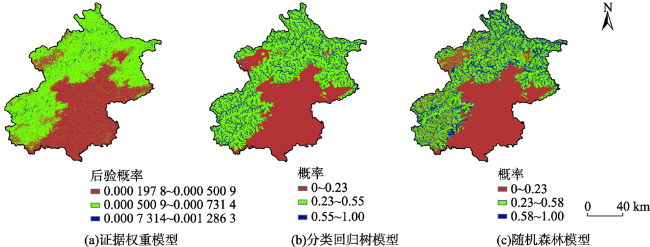
图5 利用3种不同模型预测泉水潜在位置结果Fig. 5 Prediction of potential spring water location using three different models |
表4 证据权重模型预测结果Tab. 4 Prediction results of evidence weight model |
| 等级 | 证据权重模型 | |||
|---|---|---|---|---|
| 范围 | 面积/% | 训练泉点 | 验证泉点 | |
| 低 | 0.000 197 8~0.000 500 9 | 42.01 | 40 | 16 |
| 中等 | 0.000 500 9~ 0.000 731 4 | 53.46 | 671 | 301 |
| 高 | 0.000 731 4 ~0.001 286 3 | 4.53 | 254 | 93 |
表5 机器学习模型预测结果Tab. 5 Prediction results of machine learning model |
| 等级 | 分类回归树 | 随机森林 | |||||||
|---|---|---|---|---|---|---|---|---|---|
| 范围 | 面积/% | 训练泉点 | 验证泉点 | 范围 | 面积/% | 训练泉点 | 验证泉点 | ||
| 低 | 0.00~0.23 | 39.76 | 10 | 5 | 0.00~0.23 | 41.95 | 2 | 10 | |
| 中等 | 0.23~0.55 | 46.16 | 416 | 200 | 0.23~0.58 | 38.97 | 218 | 169 | |
| 高 | 0.55~1.00 | 14.08 | 539 | 205 | 0.58~1.00 | 19.08 | 745 | 231 | |
表6 测试样本点在重要影响因子中的分布Tab. 6 Distribution of test sample points in important influence factors |
| 影响因子 | 分类 | 测试样本泉点数目 | 影响因子 | 分类 | 测试样本泉点数目 |
|---|---|---|---|---|---|
| 径流强度指数 | 0~10 | 1029 | 岩性 | 松散岩类 | 21 |
| 10~20 | 45 | ||||
| 20~30 | 27 | 碳酸岩类 | 309 | ||
| 30~40 | 13 | ||||
| 40~50 | 19 | 岩浆岩类 | 789 | ||
| 50~60 | 11 | ||||
| 60~70 | 12 | 碎屑岩类 | 132 | ||
| 70~80 | 8 | ||||
| 80~90 | 7 | 变质岩类 | 127 | ||
| >90 | 207 | ||||
| 距断裂距离/m | 0~500 | 397 | 距河流距离/m | 0~200 | 628 |
| 500~1000 | 214 | 200~400 | 208 | ||
| 1000~1500 | 160 | 400~600 | 175 | ||
| 1500~2000 | 137 | 600~800 | 138 | ||
| 2000~2500 | 99 | 800~1000 | 96 | ||
| 2500~3000 | 65 | >1000 | 133 | ||
| 3000~3500 | 55 | ||||
| >3500 | 251 |
| [1] |
田秋菊, 牛波, 王现国, 务宗伟. 我国基岩地下水开发利用和研究现状[J]. 地下水, 2004,26(2):88-90.
[
|
| [2] |
袁文波. 近代地壳运动对基岩裂隙水的控制作用研究[D]. 南京:南京大学, 2018.
[
|
| [3] |
潘玉玲, 李振宇, 万乐, 等. 利用核磁共振方法探查基岩裂隙水[J]. CT理论与应用研究, 2000,9(1):22-25.
[
|
| [4] |
潘玉玲, 贺颢, 李振宇, 等. 地面核磁共振找水方法在中国的应用效果[J]. 地质通报, 2003,22(2):135-139.
[
|
| [5] |
武毅, 封绍武, 王亚清. 应用大地电磁法TE、TM模式勘查构造裂隙水[J]. 物探与化探, 2011,35(3):329-332.
[
|
| [6] |
|
| [7] |
|
| [8] |
|
| [9] |
|
| [10] |
|
| [11] |
|
| [12] |
|
| [13] |
赵春红, 梁永平, 王维泰, 等. 北京西山泉域岩溶水系统特征探讨[J]. 中国岩溶, 2017,36(5):641-647.
[
|
| [14] |
秦大军, 孙杰, 郭艺, 等. 永定河对北京西山岩溶水和玉泉山泉的影响[J]. 工程地质学报, 2019,27(1):162-169.
[
|
| [15] |
唐春雷, 梁永平, 韩凯, 等. 玉泉山泉九龙山—香峪向斜的水文地质意义[J]. 中国岩溶, 2015,34(5):431-437.
[
|
| [16] |
刘莉莉, 宋苏林, 崔春梅. 济南泉水的成因及保泉对策研究[J]. 山东水利, 2013(5):17-18.
[
|
| [17] |
张彩霞, 杨勤科, 李锐. 基于DEM的地形湿度指数及其应用研究进展[J]. 地理科学进展, 2005,24(6):116-123.
[
|
| [18] |
美国航空航天局喷气推进实验室(JPL)和日本经济产业省(METI)数据[DB/OL]. https://lpdaac.usgs.gov/products/aster_products_table/astgtm/.
[ NASA Jet Propulsion Lab (JPL) and Japan's Ministry of Economy Trade and Industry (METI)[DB/OL]. https://lpdaac.usgs.gov/products/aster_products_table/astgtm/. ]
|
| [19] |
中国地质调查局[DB/OL]. http://geocloud.cgs.gov.cn/.
|
| [20] |
地理空间数据云[DB/OL]. http://www.gscloud.cn/.
[ Geospatial Data Cloud[DB/OL]. http://www.gscloud.cn/. ]
|
| [21] |
|
| [22] |
|
| [23] |
尚敏, 马锐, 张英莹, 等. 基于GIS的证据权重法的崩塌敏感性分析研究[J]. 工程地质学报, 2018,26(5):1211-1218.
[
|
| [24] |
张松林. CART-分类与回归树方法介绍[J]. 火山地质与矿产, 1997,18(1):67-75.
[
|
| [25] |
方匡南, 吴见彬, 朱建平, 等. 随机森林方法研究综述[J]. 统计与信息论坛, 2011,26(3):32-38.
[
|
| [26] |
周超, 方秀琴, 吴小君, 等. 基于三种机器学习算法的山洪灾害风险评价[J]. 地球信息科学学报, 2019,21(11):1679-1688.
[
|
| [27] |
赖成光, 陈晓宏, 赵仕威, 等. 基于随机森林的洪灾风险评价模型及其应用[J]. 水利学报, 2015,46(1):58-66.
[
|
| [28] |
|
| [29] |
|
| [30] |
李乃强, 徐贵阳. 基于自然间断点分级法的土地利用数据网格化分析[J]. 测绘通报, 2020(4):106-110.
[
|
| [31] |
王运生, 谢丙炎, 万方浩, 肖启明, 戴良英. ROC曲线分析在评价入侵物种分布模型中的应用[J]. 生物多样性, 2007,15(4):365-372.
[
|
| [32] |
|
| [33] |
章旭, 郝红兵, 刘康林, 等. 西藏加查象牙泉水文地球化学特征及成因[J]. 水文地质工程地质, 2019,46(4):1-9.
[
|
| [34] |
张婷婷, 侯利朋, 王万平. 青海玛沁野马滩构造岩溶泉成因及开发利用分析[J]. 青海环境, 2016,26(3):119-123.
[
|
| [35] |
韩东银, 常元存. 山西孟县张城堡泉成因研究[J]. 大地构造与成矿学, 1992(1):85-86.
[
|
/
| 〈 |
|
〉 |