
Journal of Geo-information Science >
Application of Feature Optimization and Convolutional Neural Network in Crop Classification
Received date: 2020-09-21
Request revised date: 2021-01-04
Online published: 2021-08-25
Supported by
Bureau of International Cooperation Chinese Academy of Science(181811KYSB20160040)
Strategic Priority Research Program of The Chinese Academy of Sciences(XDA13030402)
Copyright
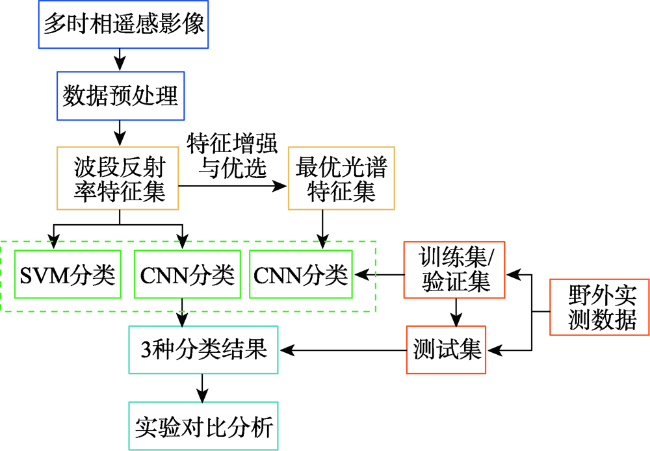
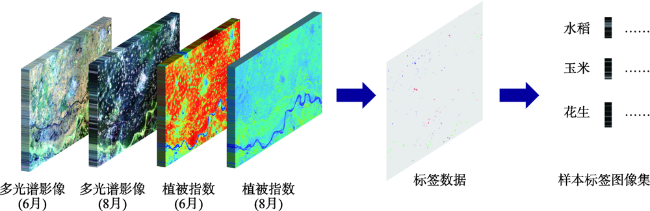
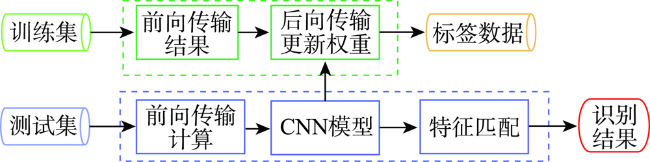
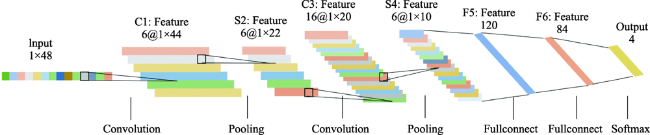
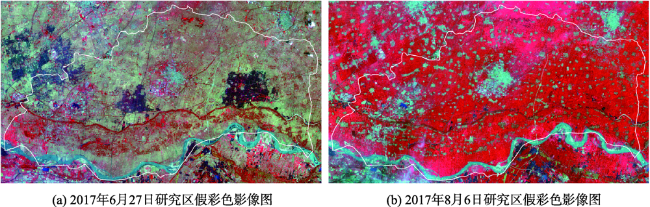
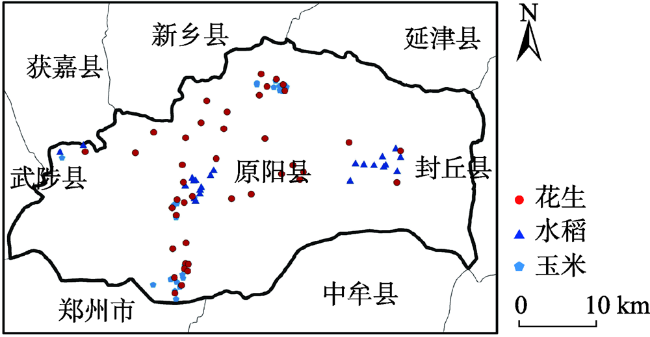
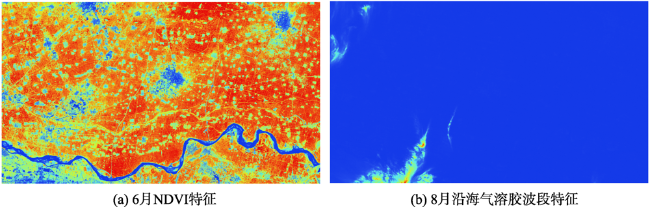
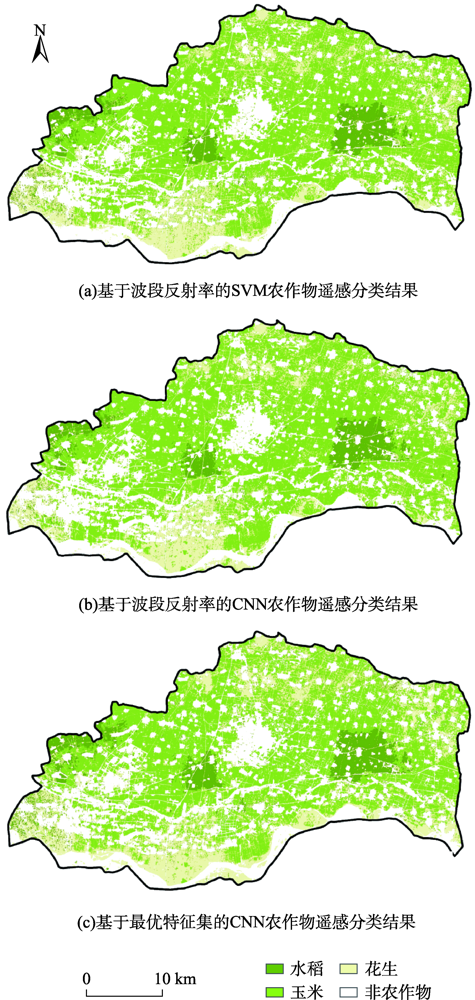
Fine-scale crop classification has always been a hot topic in the field of agricultural remote sensing, which is of great significance for crop yield estimation and planting structure supervision. The emergence of deep learning provides a new way to improve the accuracy of crop classification. Recently, the Convolutional Neural Network (CNN), a representative algorithm of deep learning, shows obvious advantages in processing high-dimensional remote sensing data. However, the application of CNN in crop classification based on multispectral data is still rare, and the classification accuracy dependent on the different feature information of crops is hard to evaluate. In this paper, a crop classification method based on feature selection and CNN for multispectral remote sensing data is proposed to improve fine crop classification. This study used Sentinel-2 remote sensing images as data source. Based on the reflectance of 13 multispectral bands and 10 vegetation indices including normalized difference vegetation index, ratio vegetation index, enhanced vegetation index, etc., the Relief F algorithm was used to rank the contribution of multidimensional features. According to the rank of feature contribution, the features with high contribution were selected and optimized by group training to obtain the best feature collection. Therefore, a CNN-based classification method based on feature selection was designed. Based on this, we classified and mapped the main crops including rice, corn, and peanut in Yuanyang County, Henan Province, with an overall classification accuracy of 96.39%. Meanwhile, the support vector machine and simple CNN were also used to classify the main crops in the research area for comparison. We found that the CNN-based classification method based on the optimal feature collection had the highest classification accuracy, followed by simple CNN, and the support vector machine had the worst performance. The main conclusions of this research are as follows: (1) The Relief F algorithm was effective to sort the contribution of different features. In total, we obtained 24 optimal feature subsets, with a training accuracy of 99.89%; (2) The CNN-based classification method using the optimal feature collection can extract the high-precision difference in features to the greatest extent and realize the fine-scale classification of crops. Compared with simple CNN and support vector machine, the CNN method based on the optimal feature collection has obvious advantages.
LIU Ge , JIANG Xiaoguang , TANG Bohui . Application of Feature Optimization and Convolutional Neural Network in Crop Classification[J]. Journal of Geo-information Science, 2021 , 23(6) : 1071 -1081 . DOI: 10.12082/dqxxkx.2021.200546
| 植被指数 | 计算公式 | 公式编号 | 说明 |
|---|---|---|---|
| RVI | (1) | 为近红外波段反射率;为红光波段反射率 | |
| GI | (2) | 为绿光波段反射率;为红光波段反射率 | |
| NDVI | (3) | 为近红外波段反射率;为红光波段反射率 | |
| RDVI | (4) | 为近红外波段反射率;为红光波段反射率 | |
| GNDVI | (5) | 为近红外波段反射率;为绿光波段反射率 | |
| GVI | (6) | 为绿光波段反射率;为红光波段反射率 | |
| TVI | | (7) | 为近红外波段反射率;为绿光波段反射率;为红光波段反射率 |
| MCARI | (8) | 为近红外波段反射率;为红光波段反射率;为绿光波段反射率 | |
| EVI | (9) | 为近红外波段反射率;为红光波段反射率;为蓝光波段反射率 | |
| MSR | (10) | 为近红外波段反射率;为红光波段反射率 |
| Relief F算法 |
|---|
| 输入:样本特征集、标签类别 输出:权重向量 设置特征1至d的权重为0; for i= 1 to m do 随机选择样本; 选取同类样本中a个最近邻; 在所有与样本不同的类别中选择个非同类最近邻; for = 1 to do 利用式(1)对特征权重向量赋值; End |
表2 哨兵2号数据参数Tab. 2 Data parameter of Sentinel-2 |
| 波段编号 | 波段名称 | 中心波长/μm | 空间分辨率/m |
|---|---|---|---|
| 1 | 海岸气溶胶 | 0.443 | 60 |
| 2 | 蓝光 | 0.490 | 10 |
| 3 | 绿光 | 0.560 | 10 |
| 4 | 红光 | 0.665 | 10 |
| 5 | 植物红边 | 0.705 | 20 |
| 6 | 植物红边 | 0.740 | 20 |
| 7 | 植物红边 | 0.783 | 20 |
| 8 | 近红外 | 0.842 | 10 |
| 8A | 植物红边 | 0.865 | 20 |
| 9 | 水蒸气 | 0.945 | 60 |
| 10 | 短波红外 | 1.375 | 60 |
| 11 | 短波红外 | 1.610 | 20 |
| 12 | 短波红外 | 2.190 | 20 |
表5 特征贡献值排序(左侧为前十,右侧为后十)Tab. 5 Sorting of feature contribution value (the top ten are on the left and the last ten on the right) |
| 类别 | 特征名称 | 特征贡献值 | 类别 | 特征名称 | 特征贡献值 |
|---|---|---|---|---|---|
| 8月植被指数 | NDVI | 0.2318 | 6月光谱波段 | 短波红外2 | 0.0738 |
| 8月植被指数 | RVI | 0.2242 | 8月光谱波段 | 短波红外2 | 0.0737 |
| 8月植被指数 | EVI | 0.2144 | 6月植被指数 | TVI | 0.0488 |
| 6月光谱波段 | 植被红边4 | 0.2112 | 6月光谱波段 | 短波红外1 | 0.0471 |
| 8月光谱波段 | 植被红边4 | 0.2074 | 6月光谱波段 | 水蒸气 | 0.0462 |
| 6月植被指数 | NDVI | 0.2043 | 6月光谱波段 | 沿海气溶胶 | 0.0353 |
| 6月植被指数 | RVI | 0.1954 | 8月光谱波段 | 沿海气溶胶 | 0.0351 |
| 8月光谱波段 | 植被红边3 | 0.1943 | 6月光谱波段 | 近红 | 0.0334 |
| 6月光谱波段 | 植被红边3 | 0.1906 | 8月光谱波段 | 短波红外3 | 0.0331 |
| 6月植被指数 | EVI | 0.1888 | 8月光谱波段 | 短波红外1 | 0.0224 |
表6 特征分组与训练精度Tab. 6 Grouping and training accuracy of feature |
| 分组编号 | 分类阈值 | 特征数/个 | 特征 | 平均训练精度/% |
|---|---|---|---|---|
| 1 | 贡献值>0.2 | 6 | NDVI_8/RVI_8/EVI_8/VRE4_6/VRE_8/NDVI_6 | 97.55 |
| 2 | 贡献值>0.15 | 14 | RVI_6/VRE3_6/VRE3_8/EVI_6/VRE2_8等 | 98.81 |
| 3 | 贡献值>0.1 | 24 | NIR_8/GNDVI_6/MSR_8/NIR_6等 | 99.89 |
| 4 | 贡献值>0.05 | 38 | TVI_6/R_6/G_6/B_6等 | 99.71 |
| 5 | 贡献值>0 | 46 | SWIR1_6/SWIR2_8 /CA_6等 | 99.62 |
表7 基于波段反射率的SVM分类结果的混淆矩阵Tab. 7 Confusion matrix of classification results based on SVM with band reflectivity |
| 类别 | 水稻 | 玉米 | 花生 | 其他 | PA/% |
|---|---|---|---|---|---|
| 水稻 | 2011 | 42 | 31 | 52 | 94.15 |
| 玉米 | 19 | 1893 | 54 | 42 | 94.27 |
| 花生 | 22 | 81 | 1323 | 38 | 90.37 |
| 其他 | 53 | 37 | 45 | 2321 | 94.50 |
| UA/% | 95.53 | 92.21 | 91.05 | 94.62 | |
| OA/% | 93.60 | ||||
| Kappa | 0.91 |
表8 基于波段反射率的CNN分类结果的混淆矩阵Tab. 8 Confusion matrix of classification results based on CNN with band reflectivity |
| 类别 | 水稻 | 玉米 | 花生 | 其他 | PA/% |
|---|---|---|---|---|---|
| 水稻 | 2032 | 34 | 25 | 37 | 95.49 |
| 玉米 | 16 | 1905 | 49 | 38 | 94.87 |
| 花生 | 18 | 72 | 1351 | 23 | 92.28 |
| 其他 | 47 | 29 | 26 | 2354 | 95.85 |
| UA/% | 96.17 | 93.38 | 93.11 | 96.00 | |
| OA/% | 94.86 | ||||
| Kappa | 0.93 |
表9 基于最优特征集的CNN分类结果的混淆矩阵Tab. 9 Confusion matrix of classification results based on CNN with optimal feature collection |
| 类别 | 水稻 | 玉米 | 花生 | 其他 | PA/% |
|---|---|---|---|---|---|
| 水稻 | 2071 | 23 | 14 | 28 | 96.96 |
| 玉米 | 8 | 1934 | 31 | 35 | 96.31 |
| 花生 | 16 | 44 | 1392 | 12 | 95.08 |
| 其他 | 42 | 21 | 17 | 2376 | 96.74 |
| UA/% | 96.91 | 95.65 | 95.74 | 96.94 | |
| OA/% | 96.39 | ||||
| Kappa | 0.95 |
表10 3种分类方式精度评价Tab. 10 Accuracy evaluation table of three classification methods |
| 分类方式 | 总体精度/% | Kappa系数 |
|---|---|---|
| 基于波段反射率的SVM分类 | 93.60 | 0.91 |
| 基于波段反射率的CNN分类 | 94.86 | 0.93 |
| 基于最优特征集的CNN分类 | 96.39 | 0.95 |
| [1] |
郭交, 朱琳, 靳标. 基于Sentinel-1和Sentinel-2数据融合的农作物分类[J]. 农业机械学报, 2018,49(4):192-198.
[
|
| [2] |
史飞飞, 高小红, 杨灵玉, 等. 基于HJ-1A高光谱遥感数据的湟水流域典型农作物分类研究[J]. 遥感技术与应用, 2017,32(2):206-217.
[
|
| [3] |
吴静, 吕玉娜, 李纯斌, 等. 基于多时相Sentinel-2A的县域农作物分类[J]. 农业机械学报, 2019,50(9):194-200.
[
|
| [4] |
李昌俊. 基于深度学习的农业遥感图像耕地提取技术研究[D]. 合肥:中国科学技术大学, 2018.
[
|
| [5] |
|
| [6] |
|
| [7] |
周成虎, 骆剑承, 杨晓梅. 遥感影像地学理解与分析[M]. 北京: 科学出版社, 1999.
[
|
| [8] |
|
| [9] |
陈拉, 黄敬峰, 王秀珍. 不同传感器的模拟植被指数对水稻叶面积指数的估测精度和敏感性分析[J]. 遥感学报, 2008,12(1):143-151.
[
|
| [10] |
郭铌. 植被指数及其研究进展[J]. 干旱气象, 2003,21(4):71-75.
[
|
| [11] |
|
| [12] |
|
| [13] |
肖艳, 姜琦刚, 王斌, 等. 基于Relief F和PSO混合特征选择的面向对象土地利用分类[J]. 农业工程学报, 2016,32(4):211-216.
[
|
| [14] |
周飞燕, 金林鹏, 董军. 卷积神经网络研究综述[J]. 计算机学报, 2017,40(6):1229-1251.
[
|
| [15] |
|
| [16] |
刘玮敏, 李曼, 张彦利. 原阳县农业气候特征分析[J]. 乡村科技, 2018(9):106-108.
[
|
| [17] |
|
| [18] |
|
| [19] |
|
/
| 〈 |
|
〉 |