
Journal of Geo-information Science >
Machine Learning Approach for Estimation of Crop Yield Combining Use of Optical and Microwave Remote Sensing Data
Received date: 2020-07-30
Request revised date: 2020-09-27
Online published: 2021-08-25
Supported by
National Key Research and Development Program of China(2018YFC1506500)
National Key Research and Development Program of China(2019YFC1510200)
Fundamental Research Funds(2019Z010)
Copyright
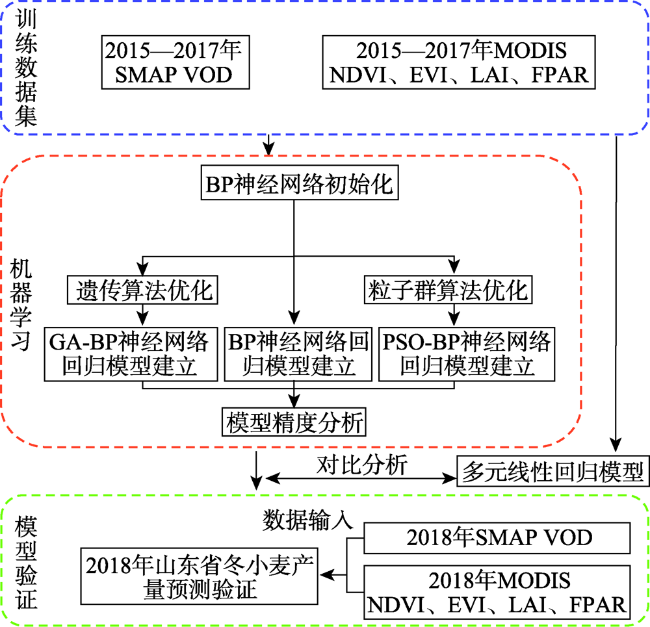
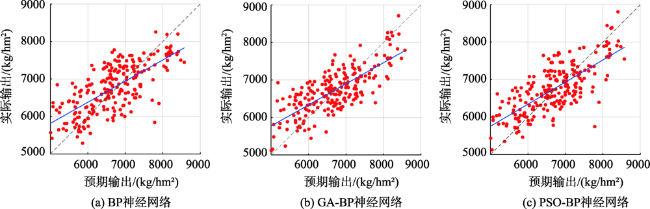
Various optical vegetation indices have been widely used in vegetation monitoring and crop yield estimation. However, the temporal availability of optical vegetation indices derived from visible and infrared remote sensing bands is usually a problem in many studies. Currently, the Vegetation Optical Depth (VOD) derived from space-borne microwave radiometers that is unaffected by cloud cover has been found to be proportional to the vegetation density and water content, which shows a great potential in crop monitoring using remote sensing. The vegetation information captured by the two remote sensing approaches is different and complementary since they come from satellite sensors with different spectrum ranges. In this study, we focused on the synergistic use of optical remote sensing data and microwave remote sensing data to estimate wheat yield more accurately. We selected the VOD estimated by the L-band microwave radiometer on board of the SMAP mission, and the Normalized Difference Vegetation Index (NDVI), the Enhanced Vegetation Index (EVI), the Leaf Area Index (LAI), and the Fraction of Photosynthetically Active Radiation (FPAR) product retrieved from the MODIS satellite sensor as the input variables for winter wheat yield estimation using neural network regression models. We compared the performances of back propagation neural network, genetic algorithm back propagation neural network, and particle swarm optimization algorithm back propagation neural network regression models for estimating wheat yields. The results show that the significance values (P) of the three neural network regression models were all less than 0.001, which indicated that all models have passed the significance test. The genetic algorithm back propagation neural network regression model was the best compared to the other two neural networks regression models, with the highest correlation (R=0.755) and the lowest root mean square error (RMSE=529.145 kg/hm2), mean absolute error (MAE=425.168 kg/hm2), and mean relative error (MRE=6.530%). Moreover, in order to analyze the advantages of different optical vegetation indices in crop yield estimation, we also established another two different genetic algorithm back propagation neural network models that used NDVI and LAI, and that used NDVI, EVI, LAI, and FPAR optical data for winter wheat yield estimation as a comparison. By comparison, the correlation (R) of the model established by the microwave and optical remote sensing data increased by 0.163, 0.229, and 0.056, respectively; while its root mean square error (RMSE) decreased by 122.334, 158.462, and 46.923 kg/hm2, respectively. The combination of multi-source remote sensing data can improve the accuracy of model results to a large extent.
ZHANG Ju , FANG Shibo , LIU Hanhu . Machine Learning Approach for Estimation of Crop Yield Combining Use of Optical and Microwave Remote Sensing Data[J]. Journal of Geo-information Science, 2021 , 23(6) : 1082 -1091 . DOI: 10.12082/dqxxkx.2021.200413
表1 数据列表Tab. 1 Remote sensing data |
| 卫星 | 数据类型 | 日期 | 空间分辨率 | 来源 | 备注 |
|---|---|---|---|---|---|
| SMAP | L2_SM_P_E V3 | 2015—2018年4月和5月 | 9 km×9 km | https://nsidc.org/ | |
| Terra | MOD13A2 V6 | 1 km×1 km | https://ladsweb.modaps.eosdis.nasa.gov/ | ||
| MOD15A2H V6 | 2014年11月—2018年5月 | 500 m×500 m | 不含每年第8景 |
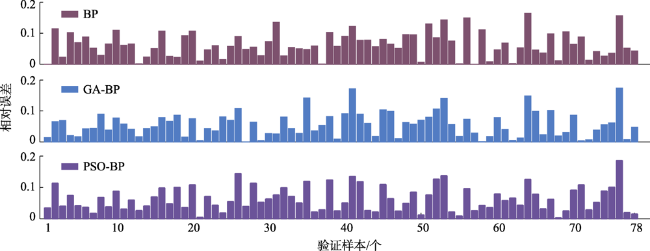
图3 BP神经网络,GA-BP神经网络和PSO-BP神经网络模型训练结果Fig. 3 Performance assessment of the BPNN, GA-BPNN and PSO-BPNN models |
表2 BP神经网络、GA-BP神经网络、PSO-BP神经网络与多元线性回归模型预测评价指标Tab. 2 Statistical results of forecasting errors of the BPNN, GA-BPNN, PSO-BPNN and MLR models |
| 回归模型 | R | RMSE/(kg/hm2) | MAE/(kg/hm2) | MRE/% | SIG.F |
|---|---|---|---|---|---|
| BP神经网络回归模型 | 0.707 | 579.578 | 462.503 | 7.074 | P<0.001 |
| GA-BP神经网络回归模型 | 0.755 | 529.145 | 425.168 | 6.530 | P<0.001 |
| PSO-BP神经网络回归模型 | 0.739 | 547.203 | 434.204 | 6.628 | P<0.001 |
| 多元线性回归模型 | 0.647 | 614.033 | 497.660 | 7.805 | P<0.001 |
表3 BP神经网络、GA-BP神经网络与PSO-BP神经网络预测评价指标对比Tab. 3 Estimation accuracy assessment of the BPNN, GA-BPNN and PSO-BPNN models in 2018 |
| 回归模型 | R | RMSE/(kg/hm2) | MAE/(kg/hm2) | MRE/% |
|---|---|---|---|---|
| BP神经网络回归模型 | 0.621 | 447.141 | 376.134 | 6.266 |
| GA-BP神经网络回归模型 | 0.718 | 394.922 | 326.724 | 5.543 |
| PSO-BP神经网络回归模型 | 0.670 | 438.512 | 379.458 | 6.388 |
表4 不同输入参数下的GA-BP神经网络模型预测评价指标Tab. 4 Statistical results of forecasting errors of GA-BPNN models with different input variables |
| 参数 | R | RMSE/(kg/hm2) | MAE/(kg/hm2) | MRE/% | SIG.F |
|---|---|---|---|---|---|
| NDVI | 0.592 | 651.479 | 523.326 | 7.918 | P<0.001 |
| LAI | 0.526 | 687.607 | 561.403 | 8.488 | P<0.001 |
| NDVI、EVI、LAI、FPAR | 0.699 | 576.068 | 464.616 | 7.086 | P<0.001 |
| VOD、NDVI、EVI、LAI、FPAR | 0.755 | 529.145 | 425.168 | 6.530 | P<0.001 |
| [1] |
|
| [2] |
|
| [3] |
|
| [4] |
|
| [5] |
王正兴, 刘闯,
[
|
| [6] |
|
| [7] |
|
| [8] |
|
| [9] |
|
| [10] |
|
| [11] |
|
| [12] |
|
| [13] |
|
| [14] |
|
| [15] |
|
| [16] |
|
| [17] |
|
| [18] |
|
| [19] |
|
| [20] |
|
| [21] |
|
| [22] |
|
| [23] |
|
| [24] |
|
| [25] |
|
| [26] |
|
| [27] |
|
| [28] |
|
| [29] |
|
| [30] |
|
| [31] |
济南市统计局. 济南统计年鉴[M]. 北京: 中国统计出版社, 2015-2019.
[ Jinan Municipal Bureau of Statistics. Jinan statistical yearbook, 2015-2019[M]. Beijing: China Statistics Press, 2015-2019. ]
|
| [32] |
枣庄市统计局. 枣庄统计年鉴[M]. 北京: 中国统计出版社, 2015-2019.
[ Zaozhuang Municipal Bureau of Statistics. Zaozhuang statistical yearbook. 2015-2019[M]. Beijing: China Statistics Press, 2015-2019. ]
|
| [33] |
潍坊市统计局. 潍坊统计年鉴[M]. 北京: 中国统计出版社, 2015-2019.
[ Weifang Municipal Bureau of Statistics. Weifang statistical yearbook[M]. Beijing: China Statistics Press, 2015-2019. ]
|
| [34] |
东营市统计局. 东营统计年鉴[M]. 东营: 东营市统计局, 2015-2019.
[ Dongying Municipal Bureau of Statistics. Dongying statistical yearbook[M]. Dongying: Dongying Municipal Bureau of Statistics, 2015-2019. ]
|
| [35] |
济宁市统计局. 济宁统计年鉴[M]. 济宁: 济宁市统计局, 2015-2019.
[ Jining Municipal Bureau of Statistics. Jining statistical yearbook[M]. Jining: Jining Municipal Bureau of Statistics, 2015-2019. ]
|
| [36] |
泰安市统计局. 泰安统计年鉴[M]. 泰安: 泰安市统计局, 2015-2019.
[ Tai'an Municipal Bureau of Statistics. Tai'an statistical yearbook[M]. Tai'an: Tai'an Municipal Bureau of Statistics, 2015-2019. ]
|
| [37] |
临沂市统计局. 临沂统计年鉴[M]. 临沂: 临沂市统计局, 2015-2019.
[ Linyi Municipal Bureau of Statistics. Linyi statistical yearbook[M]. Linyi: Linyi Municipal Bureau of Statistics, 2015-2019. ]
|
| [38] |
德州市统计局. 德州统计年鉴[M]. 德州: 德州市统计局, 2015-2019.
[ Dezhou Municipal Bureau of Statistics. Dezhou statistical yearbook[M]. Dezhou: Dezhou Municipal Bureau of Statistics, 2015-2019. ]
|
| [39] |
滨州市统计局. 滨州统计年鉴[M]. 滨州: 滨州市统计局, 2015-2019.
[ Binzhou Municipal Bureau of Statistics. Binzhou statistical yearbook[M]. Binzhou: Binzhou Municipal Bureau of Statistics, 2015-2019. ]
|
| [40] |
菏泽市统计局. 菏泽统计年鉴[M]. 菏泽: 菏泽市统计局, 2015-2019.
[ Heze Municipal Bureau of Statistics. Heze statistical yearbook. 2015-2019[M]. Heze: Heze Municipal Bureau of Statistics, 2015-2019. ]
|
| [41] |
聊城市统计局. 聊城统计年鉴[M]. 聊城: 聊城市统计局, 2015-2019.
[ Liaocheng Municipal Bureau of Statistics. Liaocheng statistical yearbook[M]. Liaocheng: Liaocheng Municipal Bureau of Statistics, 2015-2019. ]
|
| [42] |
|
| [43] |
|
| [44] |
|
/
| 〈 |
|
〉 |