
Journal of Geo-information Science >
Using UAVs Remote Sensing for Population and Distribution of Grazing Livestock in the Source Region of the Yellow River
Received date: 2021-02-11
Request revised date: 2021-05-25
Online published: 2021-09-25
Supported by
National Natural Science Foundation Program of China(42071289)
Strategic Priority Research Program of Chinese Academy of Sciences(XDA23100203)
National Key Research and Development Program of China(2017YFC0506501)
Copyright
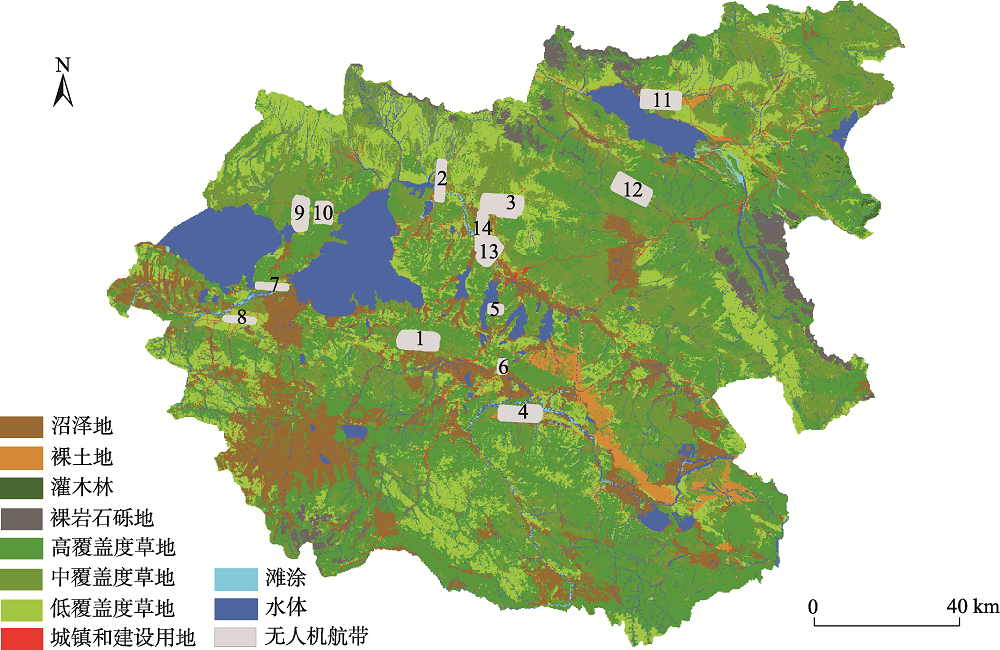
The source region of the Yellow River has a unique ecosystem and biological resources, which is an important water conservation area and ecological barrier in China. In recent years, the traditional husbandry in this area faces the development problems of overgrazing, grassland degradation, seasonal imbalance by the increase in the population of grazing livestock. It is important to scientifically grasp the situation of grazing livestock, we used UAVs to investigate the population and distribution of grazing livestock (yaks, Tibetan sheep and horses) in Maduo County. According to the library of UAV image interpretation of yaks, Tibetan sheep and horses, visual interpretation was carried out. Five methods were used to estimate the population of grazing livestock in Maduo County, and the relationship between distribution of livestock and environmental factors was analyzed by selection index. The results showed that: (1) Yaks, Tibetan sheep and horses were found in 9 of 14 UAV flight strips in April 2017, and the grazing livestock were all located in the cold season grassland. A total of 1351 yaks, 2405 Tibetan sheep and 19 horses were found. In the cold season, the densities of yaks, Tibetan sheep and horses were 4.12, 7.34 and 0.06 per km2, respectively. (2) According to the estimation method of five kinds of livestock, it is the most accurate to estimate the livestock quantity in Maduo County based on the grassland in cold and warm seasons. In 2017, there were 70 800 yaks, 102 200 Tibetan sheep and 12 000 horses, and the error of estimating the population of yaks, Tibetan sheep and horses were -0.93%, 2.27% and -13.23% respectively. (3) The environmental factors of the three livestock, which tended to slope was less than 12°, the grassland coverage was more than 0.6, the distance from residential area was less than 1 km, the water source was less than 3km, the road is more than 3 km. Yaks and Tibetan sheep were mainly group activities, and horses usually were not large clusters. UAVs remote sensing has great potential in animal husbandry, and provides new ideas for studying the characteristics and balance of grazing livestock in pastoral areas
LIU Shuchao , SHAO Quanqin , YANG Fan , GUO Xingjian , WANG Dongliang , HUANG Haibo , WANG Yangchun , LIU Jiyuan , FAN Jiangwen , LI Yuzhe . Using UAVs Remote Sensing for Population and Distribution of Grazing Livestock in the Source Region of the Yellow River[J]. Journal of Geo-information Science, 2021 , 23(7) : 1286 -1295 . DOI: 10.12082/dqxxkx.2021.210075
表2 无人机影像要素的家畜识别特征Tab. 2 Image recognition signs for livestock by UAVs |
| 要素 | 牦牛 | 藏羊 | 马 |
|---|---|---|---|
| 颜色 | 主要为黑色,偶见赭红色、白色、黑白拼接色个体 | 主要为白色、灰白色、污白色,偶见黑色、黑白拼接色个体 | 主要为黑色、棕黑、棕红,偶见白色个体,偶见白色或纯色拼接个体 |
| 纹理 | 纯色无明显纹理或大块拼接状纹理 | 纯色无明显纹理或大块拼接状纹理 | 主要纯色无明显纹理,偶见色块拼接纹理 |
| 阴影 | 晴空非正午拍摄,有较明显的牦牛形态阴影 | 晴空非正午拍摄,有较明显的藏羊形态阴影 | 晴空非正午拍摄,有较明显的马形态阴影。其中,头颈部阴影较其它家畜明显更长 |
| 大小 | 成年牦牛体长多在1.6 ~ 2.2 m。以4 cm分辨率航片为例,个体长度多在40 ~ 50像素。幼年牛犊可小至0.8 m,一般不会离群单独出现 | 成年羊体长多在1.0 ~ 1.4 m。以4 cm分辨率航片为例,个体长度多在25 ~ 35像素。幼年羊可小至0.4 m,一般不会离群单独出现 | 成年马体长多在1.6 ~ 2.2m。以4 cm分辨率航片为例,个体长度多在40 ~ 55像素。幼年家马较小,但一般不会离马群及母马出现 |
| 形状 | 整体形状近椭圆形、长方形。长宽比多在1.5:1 ~ 3:1之间,清晰的影像中或可见双角 | 整体形状近椭圆形、水滴形。长宽比多在1.5:1 ~ 3:1之间,清晰的影像中或可见双角 | 整体形状近长条块状或长柄长圆形。长宽比多在3:1 ~ 5:1之间,无角 |
| 图案 | 椭圆形、长方形图案 | 椭圆形、水滴形图案 | 长条块状或长柄长图案 |
| 位置 关系 | 多成群分布,在附近可找到居民点等人类活动地物、痕迹 | 多成群分布,在其附近能找到居民点等人类活动地物、痕迹 | 多成群分布,也偶见散布少数个体 |
| 易混淆情况 | 易与鉴别特征较差的马,大小近似的水坑、土墙阴影等混淆 | 易与个体大小较小的牛,大小近似的水洼、地形阴影等混淆 | 易与驴、图片质量不佳的骆驼等混淆 |
| 群体 影像 |  |  |  |
| 个体. 影像 |  |  |  |
表3 2017年玛多县放牧家畜估算数量Tab. 3 Estimated population of grazing livestock in Maduo County in 2017 |
| 估算方法 | 牦牛/万只 | 藏羊/万只 | 马/万只 | 合计/万只 |
|---|---|---|---|---|
| 直接估算 | 10.42 | 18.57 | 0.15 | 29.14 |
| 扣除非植被区 | 9.36 | 16.64 | 0.13 | 26.13 |
| 基于冷暖季草场 | 7.08 | 10.22 | 0.12 | 17.42 |
| 基于高程分带 | 7.68 | 39.03 | 0.37 | 47.08 |
| 基于草地类型 | 7.51 | 10.89 | 0.14 | 19.52 |
表4 放牧家畜对不同等级环境因子的选择性Tab. 4 The selection on environmental factors in different level by livestock |
| 环境因子 | 等级 | 牦牛 | 藏羊 | 马 | |||||
|---|---|---|---|---|---|---|---|---|---|
| Wi | Ei | Wi | Ei | Wi | Ei | ||||
| 高程/m | 4000~4100 | 0.07 | -0.47 | 0.67 | 0.54 | 0 | -1 | ||
| 4100~4200 | 0.08 | -0.43 | 0 | -1 | 0 | -1 | |||
| 4200~4300 | 0.16 | -0.10 | 0.02 | -0.84 | 0.01 | -0.88 | |||
| 4300~4400 | 0.61 | 0.51 | 0 | -1 | 0.15 | -0.16 | |||
| 4400~4500 | 0.07 | -0.47 | 0.31 | 0.22 | 0.84 | 0.62 | |||
| 坡度/° | ≤ 2 | 0.26 | -0.13 | 0.08 | -0.40 | 0 | -1 | ||
| 2~5 | 0.43 | 0.12 | 0.20 | -0.09 | 0.21 | -0.23 | |||
| 5~12 | 0.32 | -0.03 | 0.60 | 0.37 | 0.44 | 0.14 | |||
| >12 | 0 | -1.00 | 0.12 | -0.29 | 0.35 | 0.02 | |||
| 植被覆盖度 | 0≤FC<0.2 | 0 | -0.96 | 0.04 | -0.68 | 0 | -1 | ||
| 0.2≤FC<0.4 | 0.04 | -0.68 | 0.08 | -0.43 | 0.05 | -0.59 | |||
| 0.4≤FC<0.6 | 0.27 | 0.15 | 0.21 | 0.01 | 0.05 | -0.6 | |||
| 0.6≤FC<0.8 | 0.23 | 0.06 | 0.26 | 0.13 | 0.78 | 0.59 | |||
| 0.8≤FC<1 | 0.46 | 0.40 | 0.42 | 0.35 | 0.12 | -0.26 | |||
| 距居民点/km | ≤ 1 | 0.50 | 0.20 | 0.63 | 0.31 | 0.66 | 0.33 | ||
| 1~3 | 0.32 | -0.03 | 0.15 | -0.37 | 0.21 | -0.22 | |||
| ≥ 3 | 0.18 | -0.29 | 0.22 | -0.21 | 0.12 | -0.47 | |||
| 距水源/km | ≤ 1 | 0.38 | 0.07 | 0.97 | 0.49 | 0.09 | -0.59 | ||
| 1~3 | 0.40 | 0.09 | 0.03 | -0.85 | 0.91 | 0.47 | |||
| >3 | 0.22 | -0.21 | 0 | -1 | 0 | -1 | |||
| 距公路/km | ≤1 | 0.26 | -0.12 | 0 | -1 | 0 | -1 | ||
| 1~3 | 0.25 | -0.14 | 0 | -1 | 0.79 | 0.41 | |||
| ≥ 3 | 0.49 | 0.19 | 1 | 0.50 | 0.21 | -0.22 | |||
在野外调查和无人机遥感图像处理中,得到了西北高原生物研究所李英年研究员、青海省草原总站严振英高级工程师、天峻县农牧局唐永鹏,以及研究团队其他人员的帮助,在此一并表示感谢!
| [1] |
张镱锂, 刘林山, 摆万奇, 等. 黄河源地区草地退化空间特征[J]. 地理学报, 2006, 61(1):3-14.
[
|
| [2] |
董世魁, 汤琳, 张相锋, 等. 高寒草地植物物种多样性与功能多样性的关系[J]. 生态学报, 2017, 37(5):1472-1483.
[
|
| [3] |
邵全琴, 郭兴健, 李愈哲, 等. 无人机遥感的大型野生食草动物种群数量及分布规律研究[J]. 遥感学报, 2018, 22(3):497-507.
[
|
| [4] |
宋仁德, 汪永洲, 李国梅, 等. 玉树州畜种畜群结构调查与对策初探[J]. 家畜生态学报, 2014, 35(2):53-57.
[
|
| [5] |
闫琦. 青藏高原典型牧区畜群结构及载畜量研究[D]. 兰州:兰州大学, 2019.
[
|
| [6] |
|
| [7] |
|
| [8] |
陈晓霞, 石福孙, 孙飞达, 等. 川西北典型牧业县放牧家畜数量及结构的空间分布特征[J]. 应用与环境生物学报, 2019, 25(1):63-69.
[
|
| [9] |
朝宝. 近70年巴林右旗五畜数量结构时空变化及其影响因素分析[D]. 呼和浩特:内蒙古师范大学, 2017.
[
|
| [10] |
|
| [11] |
|
| [12] |
|
| [13] |
|
| [14] |
宋晓阳, 申文明, 万华伟, 等. 基于高分遥感的可可西里自然保护区藏羚羊生境适宜性动态监测[J]. 资源科学, 2016, 38(8):1434-1442.
[
|
| [15] |
马琰, 郭颖, 邓广, 等. 基于国产GF-1影像的川金丝猴生境评价研究[J]. 北京林业大学学报, 2016, 38(7):81-90.
[
|
| [16] |
李绍纲. 航空调查野生动物资源[J]. 吉林林业科技, 1985, 14(5):50-51.
[
|
| [17] |
赵忠琴, 李金录, 冯科民. 大型水禽航空调查方法[J]. 野生动物, 1985, 6(4):25-27.
[
|
| [18] |
|
| [19] |
|
| [20] |
|
| [21] |
黄仁超. 基于无人机图像的输电线杆塔上的鸟巢识别技术[D]. 广州:广东工业大学, 2018.
[
|
| [22] |
|
| [23] |
吴方明, 朱伟伟, 吴炳方, 等. 三江源大型食草动物数量无人机自动监测方法[J]. 兽类学报, 2019, 39(4):450-457.
[
|
| [24] |
|
| [25] |
郭兴健, 邵全琴, 杨帆, 等. 无人机遥感调查黄河源玛多县岩羊数量及分布[J]. 自然资源学报, 2019, 34(5):1054-1065.
[
|
| [26] |
杨帆, 邵全琴, 郭兴健, 等. 玛多县大型野生食草动物种群数量对草畜平衡的影响研究[J]. 草业学报, 2018, 27(7):1-13.
[
|
| [27] |
|
| [28] |
地理空间数据云. DEM 数字高程数据[DB/OL]. http://www.gscloud.cn/sources/?cdataid=302&pdataid=10.
[Geospatial Data Cloud. DEM digital elevation data[DB/OL]. http://www.gscloud.cn/sources/?cdataid=302&pdataid=10.]
|
| [29] |
资源学科创新平台. 中国1:100万植被数据[DB/OL]. http://www.data.ac.cn/database/zgzb.html.
[Resource Discipline Innovation Platform. Vegetation data of China(1:1000000)[DB/OL]. http://www.data.ac.cn/database/zgzb.html.]
|
| [30] |
李欣海, 郜二虎, 李百度, 等. 用物种分布模型和距离抽样估计三江源藏野驴、藏原羚和藏羚羊的数量[J]. 中国科学:生命科学, 2019, 49(2):151-162.
[
|
| [31] |
黄麟, 翟俊, 祝萍, 等. 中国草畜平衡状态时空演变指示的草地生态保护格局[J]. 地理学报, 2020, 75(11):2396-2407.
[
|
/
| 〈 |
|
〉 |
