
Journal of Geo-information Science >
Research on the Applicability of Remote Sensing Precipitation Products in Different Climatic Regions of China
Received date: 2020-07-05
Request revised date: 2020-08-31
Online published: 2021-09-25
Supported by
Natural Science Foundation of China(41901076)
Natural Science Foundation of China(41701019)
Natural Science Foundation of China(41901016)
Special Climate Change Project of China Meteorological Administration(CCSF202042)
The Startup Foundation for Introducing Talent of NUIST(2017r069)
Key Laboratory of Water Cycle and Related Land Surface Processes, Institute of Geographic Sciences and Natural Resources Research, Chinese Academy of Sciences(2017A004)
The 2020 "Excellent Undergraduate Thesis (Design) Support Program" project of NUIST
China Scholarship Council Young Teachers' Key Project(201809040009)
Copyright
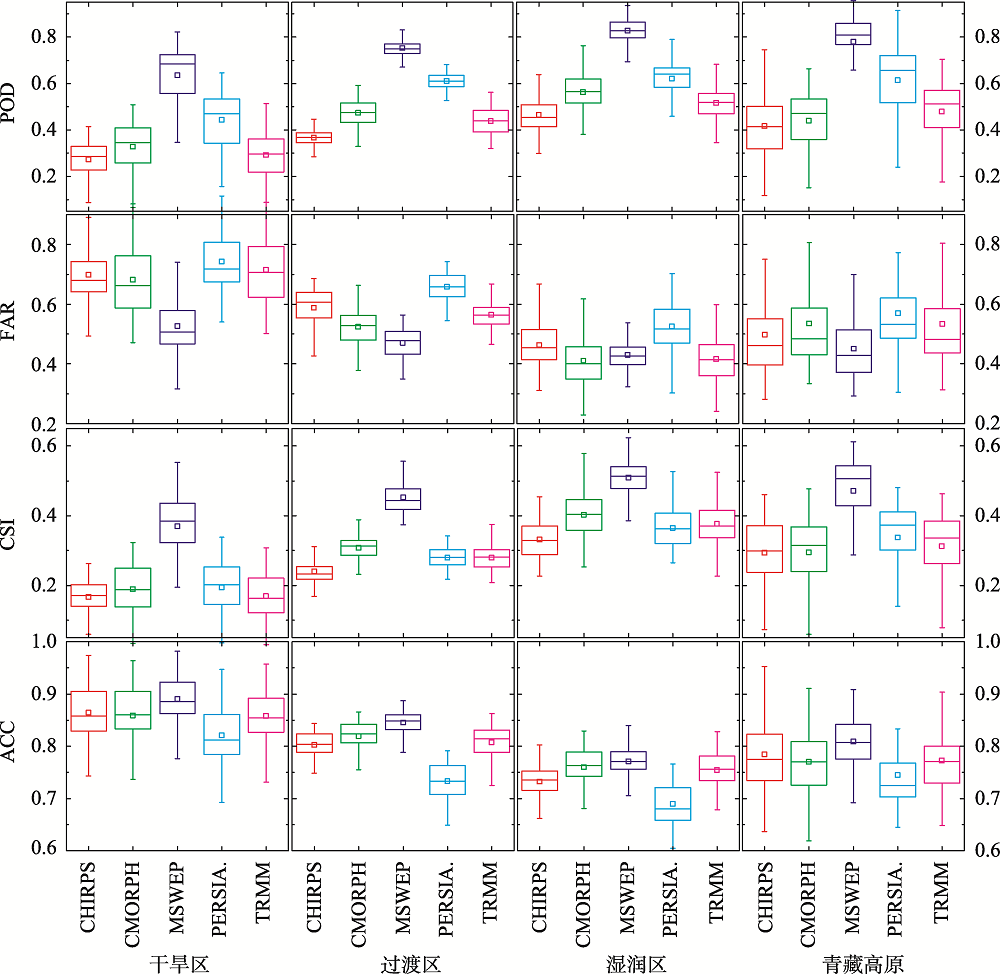
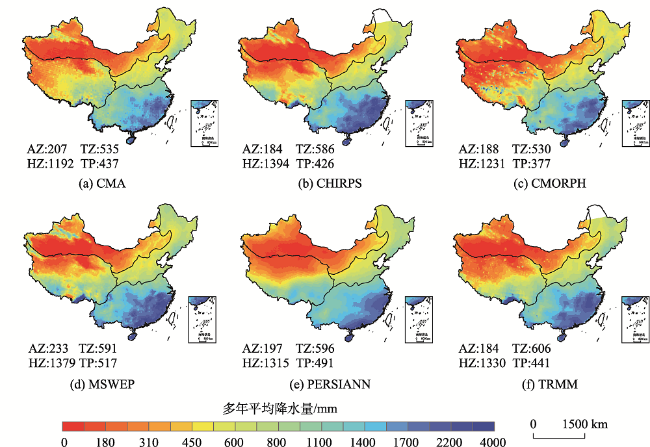
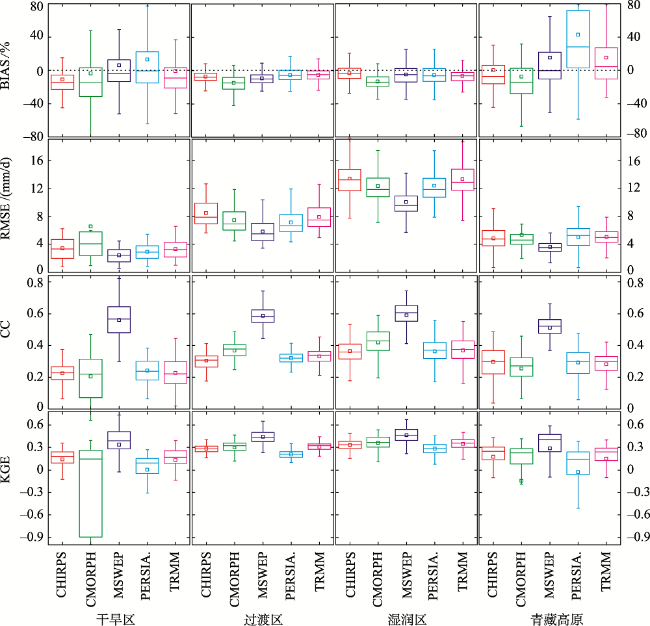
Compared with the observation data from meteorological stations, remote sensing precipitation products can be used to well present the spatial distribution of precipitation. So it is of great significance to make a comparative study on the differences of remote sensing precipitation products in different climatic regions. This paper selects the typical climatic regions in China for comparison analysis. Based on the corrected observations of 649 meteorological stations, the performance of five typical remote sensing precipitation products (CHIRPS v2.0, CMORPH v1.0, MSWEP v2.0, PERSIANN-CDR, and TRMM 3B42v7) are evaluated in different climatic regions. Results show that: (1) The performance of each product varies in different climatic regions; (2) The MSWEP product shows higher CC, KGE, and RMSE values in each climatic region. Based on BIAS, the MSWEP, CHIRPS, PERSIANN, and TRMM have better performance in arid, humid regions, the Tibetan Plateau, and transition regions, respectively; (3) In terms of POD, CSI, and ACC, the MSWEP has better performance in all climatic regions. In humid region, TRMM and CMORPH have advantages with lower FAR, while MSWEP is better in other climatic regions. Above all, MSWEP, the multi-source precipitation product, has better basic statistical performance and category performance in all climatic regions and can be used as a reliable precipitation data source for various hydrometeorological studies in China, which indicates that multi-source data fusion has a good application prospect in future.
PENG Zhenhua , LI Yanzhong , YU Wenjun , XING Yincong , FENG Aiqing , DU Shenwen . Research on the Applicability of Remote Sensing Precipitation Products in Different Climatic Regions of China[J]. Journal of Geo-information Science, 2021 , 23(7) : 1296 -1311 . DOI: 10.12082/dqxxkx.2021.200348
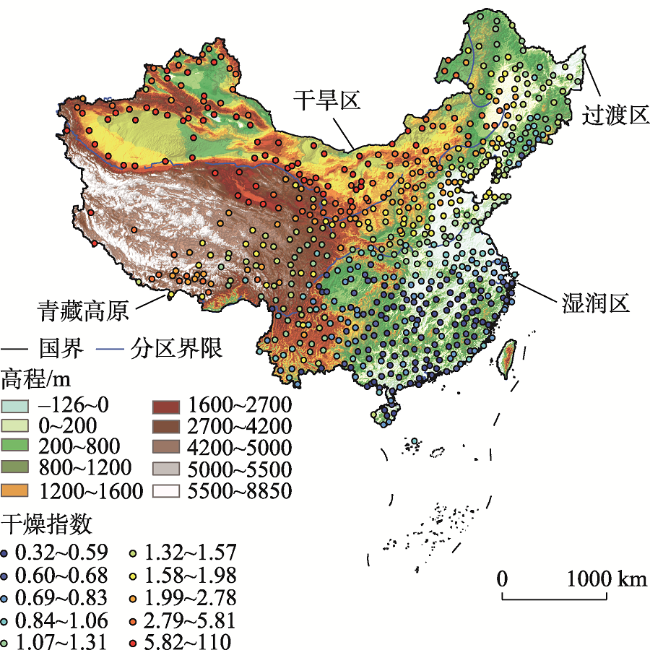
图1 中国不同气候区示意注:该图基于自然资源部标准地图服务网站下载的审图号为GS(2019)1822号的标准地图制作,底图无修改。由于数据获取困难,本研究不包括香港、台湾和澳门。 Fig. 1 Location of different climatic zones in China |
表1 不同气候区的水文气象基本特征Tab. 1 Basic characteristics of hydrometeorology in different climate regions |
| 气候区 | P /(mm a-1) | Tmean/(°C a-1) | PET/(mm a-1) | AI |
|---|---|---|---|---|
| 干旱区 (n=122) | 207.7 | 6.62 | 1097.9 | 5.29 |
| 过渡区 (n=172) | 534.8 | 5.93 | 828.5 | 1.55 |
| 湿润区 (n=261) | 1192.0 | 16.78 | 923.8 | 0.78 |
| 青藏高原 (n=94) | 436.6 | -0.97 | 1031.3 | 2.36 |
注:气候区名称后的数字代表该气候区内的气象站数量。P代表年降水量,Tmean代表年平均气温,PET表示潜在蒸散发,AI代表干燥指数。 |
表2 遥感降水产品基本信息Tab. 2 Basic information of remote sensing precipitation products |
| 名称 | 时段 | 空间跨度 | 数据源 | 数据下载地址 |
|---|---|---|---|---|
| CHIRPS v2.0 | 1981—2018 | 50°N—50°S | G,S,R,A | ftp://ftp.chg.ucsb.edu/pub/org/chg/products/CHIRPS-2.0 |
| CMORPH v1.0 | 1998—2019 | 60°N—60°S | G,S | ftp://ftp.cpc.ncep.noaa.gov/precip/global_CMORPH/daily_025d |
| PERSIANN-CDR | 1983—2018 | 60°N—60°S | G,S | http://chrsdata.eng.uci.edu/ |
| TRMM | 1998—2018 | 50°N—50°S | G,S | https://pmm.nasa.gov/data-access/downloads/trmm |
| MSWEP v2.0 | 1979—2014 | 全球 | G,S,R,A | http://gloh2o.org/ |
注:表中数据源的字母缩写G表示地面观测,S为卫星数据,R为再分析数据,A为分析数据。 |
表3 评价不同遥感降水产品所用到的统计指标Tab. 3 Statistical indexes used to evaluate different remote sensing precipitation products |
| 统计指标 | 公式 | 无偏估计值 | 编号 |
|---|---|---|---|
| 相关系数 (CC) | 1 | (5) | |
| 相对偏差 (BIAS) | 0 | (6) | |
| 均方根误差 (RMSE) | 0 | (7) | |
| Kling-Gupta 效率 (KGE) | 1 | (8) | |
| 检测概率 (POD) | 1 | (9) | |
| 虚假警报比率 (FAR) | 0 | (10) | |
| 关键成功指数 (CSI) | 1 | (11) | |
| 精度 (ACC) | 1 | (12) | |
| 概率分布函数 (PDF) | - | (13) |
注:式中 , 分别为估计值和观测值;N为样本容量; 和 分别为遥感降水估计值和地面观测值;r是观测值与模拟值之间的相关系数; 和 分别为遥感降水估计值的均值和标准差, 和 分别为地面观测值的均值和标准差;H表示卫星产品探测到并且在雨量计中观察到的降水事件数目;M是未探测到但观察到的降水事件数目;F表示探测到但未观察到的降水事件数目;C表示没有探测到也没有观察到的降水事件数目;n(a,b]表示降水量介于a~b之间的天数。 |
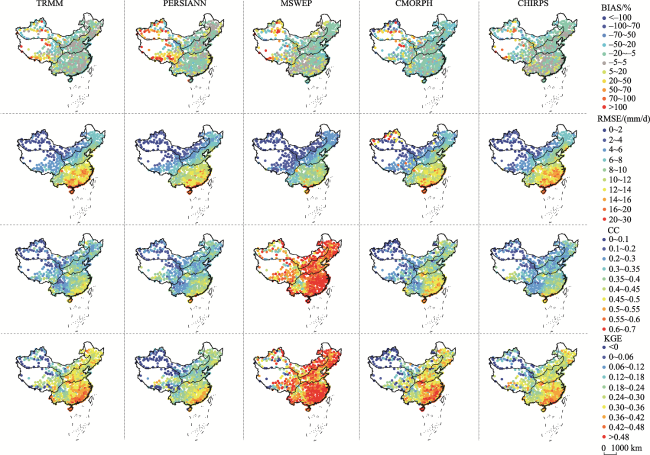
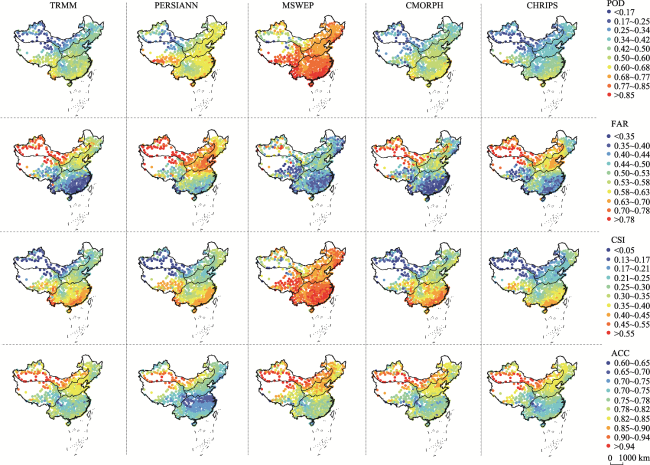
图6 不同遥感降水产品在不同气候区的日尺度性能指标空间分布注:该图基于自然资源部标准地图服务网站下载的审图号为GS(2019)1822号的标准地图制作,底图无修改。由于数据获取困难,本研究不包括香港、台湾和澳门。 Fig. 6 Spatial distribution of daily scale performance indexes of different remote sensing precipitation products in different climatic regions |
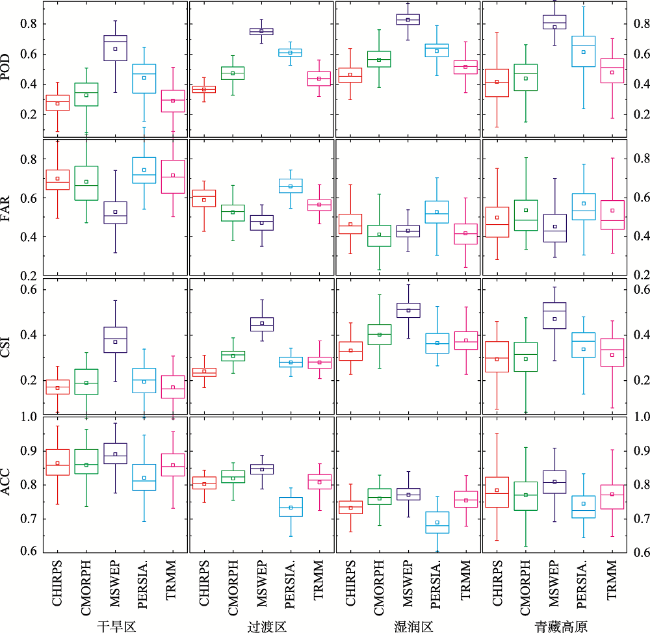
图8 不同遥感降水产品在不同气候区的等级性能空间分布注:该图基于自然资源部标准地图服务网站下载的审图号为GS(2019)1822号的标准地图制作,底图无修改。由于数据获取困难,本研究不包括香港、台湾和澳门。 Fig. 8 Spatial distribution of category performance of remote sensing precipitation products in four climatic regions |
| [1] |
刘元波, 傅巧妮, 宋平, 等. 卫星遥感反演降水研究综述[J]. 地球科学进展, 2011, 26(11):1162-1172.
[
|
| [2] |
|
| [3] |
|
| [4] |
徐淑琴, 丁星臣, 王斌. 多卫星遥感降水产品寒区误差时空特征分析[J]. 东北农业大学学报, 2017, 48(11):63-73.
[
|
| [5] |
|
| [6] |
|
| [7] |
|
| [8] |
王书霞, 张利平, 喻笑勇, 等. 遥感降水产品在澜沧江流域径流模拟中的适用性研究[J]. 长江流域资源与环境, 2019, 28(6):1365-1374.
[
|
| [9] |
|
| [10] |
|
| [11] |
|
| [12] |
|
| [13] |
|
| [14] |
|
| [15] |
|
| [16] |
|
| [17] |
|
| [18] |
|
| [19] |
|
| [20] |
|
| [21] |
|
| [22] |
|
| [23] |
|
| [24] |
|
| [25] |
|
| [26] |
|
| [27] |
|
| [28] |
|
| [29] |
|
| [30] |
|
| [31] |
|
| [32] |
|
| [33] |
|
| [34] |
|
| [35] |
|
/
| 〈 |
|
〉 |