Analysis of Life Expectancy and the Spatial Differences of Its Influencing Factors of Chinese Residents

  • ZHANG Ziwei , 1, 2, 3, 4 ,
  • HUANG Qiuhao , 1, 2, 3, 5, * ,
  • LU Yu 1, 2, 3, 4 ,
  • LI Manchun 1, 2, 3 ,
  • CHEN Zhenjie 1, 2, 3 ,
  • LI Feixue 1, 2, 3
Expand
  • 1. School of Geography and Ocean Science, Nanjing University, Nanjing 210023, China
  • 2. Key Laboratory for Land Satellite Remote Sensing Applications of Ministry of Natural Resources, Nanjing 210023 China
  • 3. Jiangsu Provincial Key Laboratory of Geographic Information Science and Technology, Nanjing 210023, China
  • 4. The Key Laboratory of the Coastal Zone Exploitation and Protection, Ministry of Natural Resources, Nanjing 210023, China
  • 5. Jiangsu Center for Collaborative Innovation in Geographical Information Resource Development and Application, Nanjing 210023, China
*HUANG Qiuhao, E-mail:

Received date: 2020-10-15

  Online published: 2021-11-25

Supported by

National Natural Science Foundation of China(41571082)

Copyright

Copyright reserved © 2021.

Abstract

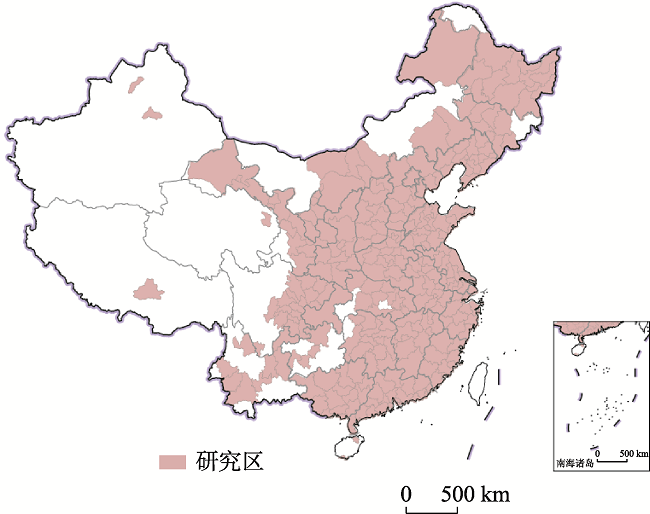
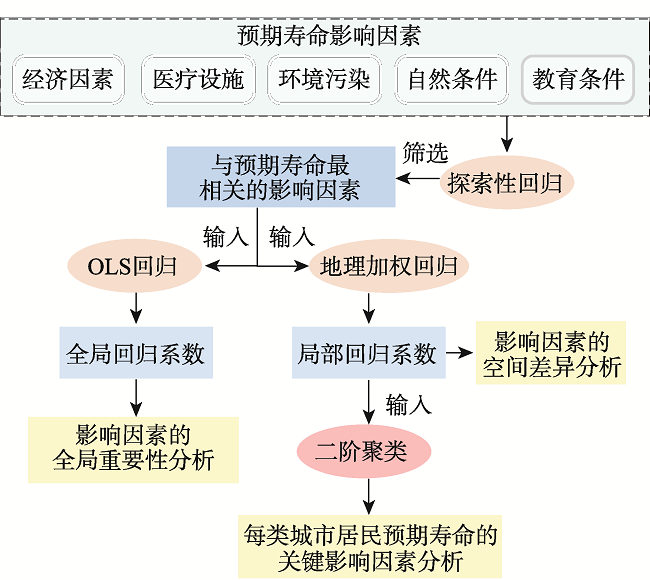
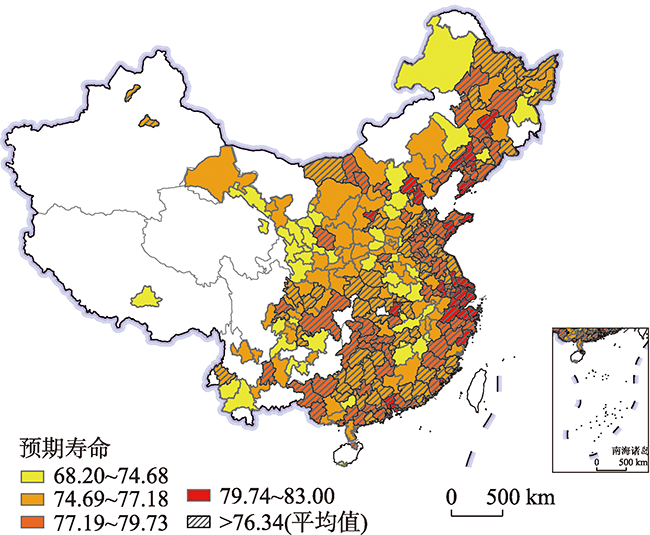
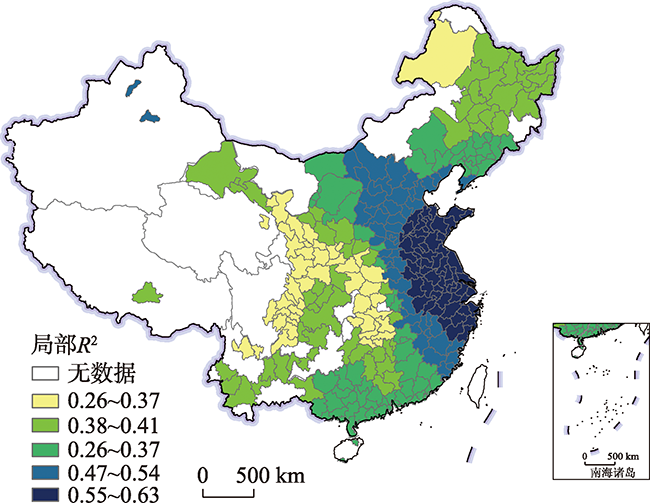
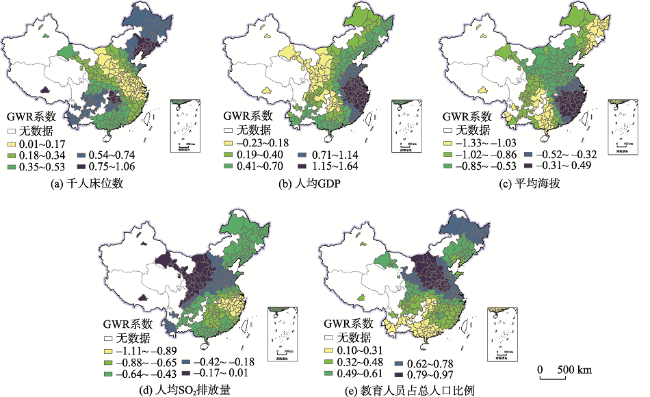
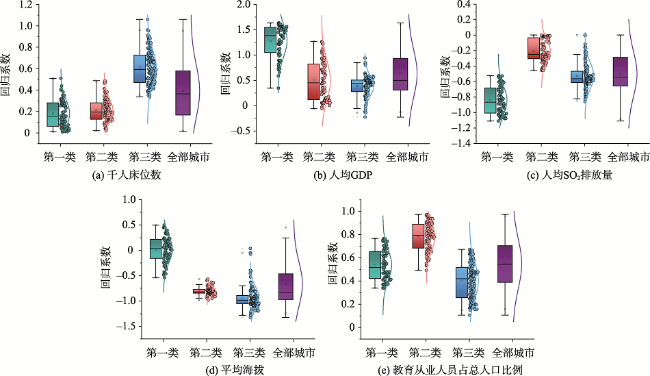
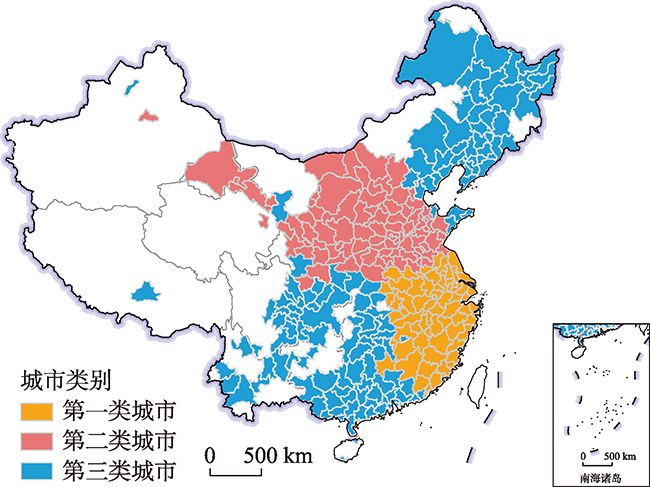
Good Health and Human Well-being is one of The Sustainable Development Goals proposed by the United Nations, and increasing the life expectancy is a significant step towards this goal. Due to differences in the natural environment and social development of Chinese cities, understanding the factors that affect life expectancy in different regions is the key to formulate urban public health policy. Based on the data of 286 cities in China in 2015, this paper used exploratory regression, ordinary least squares, and geographically weighted regression to screen out the most relevant influencing factors to life expectancy and explore their spatial differences. Then, the two-step cluster analysis was used to make targeted policy recommendations for each type of cities. The results show that: (1) Economic development, educational conditions, and medical facilities had a significant positive impact on life expectancy, while average altitude and environmental pollution had a negative impact; (2) Compared with other regions, economic development in the southeast region had a greater impact on local life expectancy; medical facilities in the northeast and southwest regions had a higher degree of promotion of life expectancy for its residents; education conditions in the northern region had a higher impact on the life expectancy of local residents; average altitude had the greatest impact on the life expectancy of residents in the West region; The life expectancy of residents in the northwest region was more susceptible to the negative impact of environmental pollution than in other regions; (3) Cities were divided into three categories based on spatial differences, and the key factors affecting the life expectancy are economic development and environmental pollution, educational conditions, and medical facilities in order. City managers in each category of cities should pay attention to different factors to increase their life expectancy.

Cite this article

ZHANG Ziwei , HUANG Qiuhao , LU Yu , LI Manchun , CHEN Zhenjie , LI Feixue . Analysis of Life Expectancy and the Spatial Differences of Its Influencing Factors of Chinese Residents[J]. Journal of Geo-information Science, 2021 , 23(9) : 1575 -1585 . DOI: 10.12082/dqxxkx.2021.200607

1 引言

公共卫生健康事业的发展直接关系着国家和地区的可持续发展目标[1]。联合国开发计划署使用人类健康发展指数对各国公共卫生健康事业的发展进行排名,预期寿命是计算该指数的3个主要参数之一,同时也是衡量人类健康程度的重要指标,其是指在各个年龄段的死亡率保持现有水平不变的情况下,新出生的人平均能够生存的年数[2]。在过去40多年中,中国居民的预期寿命显著增加,全国平均预期寿命从1981年的67.77岁上升到2019年的77.30岁。但是,工业化、城镇化、人口老龄化、生态环境及生活方式变化,也为提升居民的健康水平带来一系列新的挑战[3]。推进健康中国建设,是全面提升中华民族健康素质、实现人民健康与经济社会协调发展的国家战略。《“健康中国2030”规划纲要》[4]提出在2030年平均预期寿命到达79岁的目标,是中国迈向全球卫生治理和履行《2030年可持续发展议程》[5]中所列国际承诺的重要一步。为成功实现健康发展目标,现阶段迫切地需要探索中国居民预期寿命的影响因素及其空间差异,为政府制定有效的举措提供可靠的理论支撑。
以往许多研究都讨论了影响预期寿命的因素。人们普遍认为,经济发展较好地区的居民预期寿命更高。然而,美国经济条件优越,但其预期寿命近年来出现下降的趋势[6],中国的预期寿命每年都在增长,这证明非经济因素对预期寿命也会产生一定的影响[7,8]。有研究表明,人类寿命约25%是由基因决定,另外75%是由人类的生活环境和条件决定[9],其中包括医疗设施条件[10,11],教育程度[12,13,14], 经济发展[15,16],自然因素[17,18,19],环境污染[20,21],性别差异[22,23]和个人习惯[24]等。中国幅员辽阔,不同城市的社会发展水平和自然环境不同,这导致影响中国居民预期寿命的因素存在空间差异[25,26]
目前相关研究中大多采用空间滞后回归、空间误差回归和地理加权回归(Geographically Weighted Regression,GWR)探寻预期寿命与影响因素的空间关系[11,17,27-28]。空间滞后回归和空间误差回归均是从全局的角度解释不同影响因素对预期寿命的影响,而地理加权回归能得到不同地理位置各影响因素的影响程度,因此地理加权回归更适用于探索预期寿命影响因素的空间差异。如黄毅[17]等研究表明,气候、海拔和营养因素能够解释中国居民的预期寿命的68%,并通过GWR模型证明其影响程度在不同地区之间存在空间差异;宋文静等[29]利用GWR模型提供了中国各省的环境和社会经济因素与预期寿命关系的见解,证明中国公共卫生存在明显的地区差异并与环境和社会因素密切相关;王丽等[30]以85个中国城市为研究对象,利用GWR模型探索了PM10和SO2等环境污染因素对预期寿命影响的空间差异,认为华南地区居民的预期寿命受到环境污染的影响程度最大。然而,这些研究仅使用GWR的结果来发现影响预期寿命因素的空间差异,没有进一步挖掘空间差异的潜在意义。二阶聚类是一种数据分析方法,能够自适应地将数据样本划分为几种类型,其中每种类别内部的样本相似性最高,每种类别之间的差异相对较大。通过将城市分为不同类别,可以制定有针对性的政策建议,从而更有利于制定公共卫生政策。
本研究拟探索中国主要城市的居民预期寿命影响因素,以及这些因素在不同地区的空间差异。首先,探索性回归分析用于筛选5个维度的预期寿命影响因素。然后将选定的因素输入到普通最小二乘(Ordinary Least Squares,OLS)模型中,以评估每个因素的全局重要性。接下来,使用GWR模型分析影响因素的空间差异。最后,根据影响因素的空间差异,利用二阶聚类将286个城市进行分类,并针对性地提出每类城市的政策建议,以提升中国居民的平均预期寿命。

2 数据来源与研究方法

2.1 数据来源

本文的研究区为中国286个主要城市,包括28个省会城市和4个直辖市(图1)。本研究收集了5个维度共12项预期寿命影响因素的数据。影响因素的选取综合考虑来了先前的研究和数据的可获取性2个方面,具体如表1所示。2015年预期寿命数据来自每个城市的统计年鉴或统计公报。数字高程模型(DEM),年平均温度和降水量数据来自中科院资源环境数据云平台( http://www.resdc.cn[31,32,33]。此外,PM2.5和PM10数据来源于欧盟科学中心的全球大气研究排放数据库( http://edgar.jrc.ec.europa.eu[34],其余统计数据来自《2016年中国城市统计年鉴》[35]
表1 预期寿命影响因素的选取依据

Tab. 1 Selection basis of factors affecting life expectancy

维度 影响因素(简称) 选取依据
经济因素 人均GDP(PCGDP) 文献[7]、[36]、[37]
人均储蓄存款余额(PCSDB) 文献[38]、[39]
医疗设施 千人床位数(HB) 文献[11]、[40]
千人医生数(DP) 文献[10]、[41]
环境污染 人均SO2排放量(PCSO2 文献[29]、[40]
PM2.5 文献[42]、[43]
PM10 文献[29]、[44]
自然条件 平均海拔(AE) 文献[17]、[19]
年平均温度(AT) 文献[18]、[19]
年均降水量(AP) 文献[17]、[18]
教育条件 教育从业人员占人口比例(POE) 文献[45]
千人学校数(PCSCH)
图1 研究区城市的空间分布

注:该图基于自然资源部标准地图服务网站下载的审图号为GS(2019)1823号的标准地图制作,底图无修改;由于数据获取困难,本次研究不包括香港、台湾和澳门。

Fig. 1 Spatial distribution of cities in the study area

2.2 研究方法

本文采用探索性回归分析筛选5个维度的预期寿命影响因素并利用OLS模型评估每个因素的全局重要性,再利用GWR模型探索影响因素的空间差异并基于局部回归系数进行二阶聚类,分析每类城市居民预期寿命的关键影响因素,技术路线如图2所示。
图2 预期寿命影响因素的空间差异分析技术路线

Fig. 2 Flowchart of spatial difference analysis of influencing factors of life expectancy

2.2.1 探索性回归
当研究中存在较多解释变量,且这些解释变量皆可作为因变量的重要影响因素时,寻找一个符合各方面条件的OLS模型会比较困难,探索性回归可对这一情况进行简化,它能够遍历所有解释变量的组合后找出满足条件的最优组合。尽管它与逐步回归相似,但探索性回归不仅能够找到R2较高的影响因素的组合,还能将p值和方差膨胀因子(Variance Inflation Factor,VIF)作为筛选条件。
为了消除数值幅度上的差异,本研究对所有解释变量进行标准化处理,然后利用ArcGIS 10.2的探索性回归工具筛选指标组合,筛选的原则为: ① 指标的组合获得较大的矫正R2R2 >0.45);② 各个指标尽可能在10%水平下显著(p<0.1);③ VIF值远低于7.5;④ 选取的指标组合的赤池信息量准则(Akaike information Criterion,AIC)值尽可能小。
2.2.2 普通最小二乘法回归
回归分析是最常用的社会科学统计方法,用于评估2个或更多要素属性之间的关系,而OLS是所有回归中最著名的方法[46]。OLS回归模型假设因变量和自变量之间的关联在整个区域是固定的[47],可以表示为:
y = β 0 + i = 1 p β i x i + ε
式中:y是因变量;β0是截距;βi是自变量xi的系数;p是自变量的数量;ε是误差项。本文中运用OLS目的在于从全局的角度分析各因素对预期寿命的影响程度。
2.2.3 地理加权回归
OLS回归通常从全局的角度量化一组自变量对一个因变量的影响,会不可避免地忽略空间相关性,这可能会导致偏差。由于本研究所选择的大多数变量具有空间差异,所以引入GWR模型对这种空间差异进行分析。GWR是一种对空间异质性进行建模的技术,即为数据集中的各要素构建了一个独立的方程,用于将落在各目标要素的带宽范围内的因变量和解释变量进行合并。在估计某个位置的模型参数时,越近的观测值会在估算时给予更大的权重[47]。目前,GWR已经广泛应用于许多领域,如管理学、土壤污染、空气污染和社会科学[46,48-50],其公式为:
y i = β 0 ( u i , v i ) + k = 1 p β k ( u i , v i ) x ik + ε i
式中: y i是位置 i的因变量; u i , v i是位置 i的地理坐标; β 0 u i , v i β k u i , v i是位置 i的截距和第 k个自变量的局部系数; p是自变量的数量; x ik是位置 i的第 k个自变量; ε i是随机误差项。
在本项研究中,GWR模型用于计算每个城市的局部回归系数,以显示预期寿命影响因素的空间差异。
2.2.4 二阶聚类
二阶聚类分析是能够通过自动选择聚类数量来揭示数据集中自然分组的聚类方法[51]。二阶聚类: ① 检查所有样本的距离并构建聚类特征树,具有高度相似性的样本被分配给相同的树节点,当一个样本与所有现有的树节点完全不同时,将生成新的节点;② 在分类树的基础上,对之使用分层聚类的方法进行再聚类,每一个聚类结果使用贝叶斯信息准则(Bayesian Information Criterion,BIC)或者AIC值进行判断,得出最终的聚类结果[52]
二阶聚类也有严苛的适用条件:它要求模型中的变量独立,类别变量是多项式分布,连续变量须是正态分布[53]。本研究使用两步聚类法来进一步挖掘影响因素空间差异的潜在含义,探讨不同城市居民预期寿命的主要影响因素。

3 结果与分析

3.1 中国城市居民的预期寿命空间差异

2015年,中国居民的平均预期寿命为76.34岁,排名前三的城市是上海(83.00岁),苏州(82.74岁)和珠海(82.50岁),最后三位的城市是拉萨(68.20岁),普洱(69.54岁)和临沧(70.01岁)。本研究使用自然断点分级法来显示预期寿命数据的空间分布,能够清晰地展现预期寿命的区域差异(图3)。自然断点分级法能够使每组内部的相似性最大,而组与组之间的相异性最大。由于在数据值的差异相对较大的位置处设置分隔边界,因此区间间隔有所差异(ArcGIS帮助文档,https://desktop.arcgis.com/zh-cn/arcmap/latest/map/ working-with-layers/classifying-numerical-fields-for-graduated-symbols.htm)。整体来看,东部地区居民的预期寿命高于西部地区,沿海地区居民的预期寿命相对高于内陆地区。长三角城市群,京津冀城市群,珠三角城市群以及省会城市或直辖市的人口预期寿命均高于全国平均值,而中西部地区的人口预期寿命基本低于全国平均水平。
图3 研究区2015年居民预期寿命的空间分布

注:该图基于自然资源部标准地图服务网站下载的审图号为GS(2019)1823号的标准地图制作,底图无修改;由于数据获取困难,本次研究不包括香港、台湾和澳门。

Fig. 3 Distribution of life expectancy of residents in the study area in 2015

3.2 预期寿命影响因素的确定

探索性回归分析的结果如表2所示。根据2.2.1中的筛选标准确定了5个影响因素:① 千人床位数(HB);② 人均国内生产总值(PCGDP);③ 人均二氧化硫排放量(PCSO2);④ 平均海拔(AE);⑤ 教育从业人员占总人口的比例(POE)。这些因素的描述性统计如表3所示。
表2 十二项预期寿命影响因素的探索性回归分析结果

Tab. 2 Exploratory regression analysis results of twelve factors affecting life expectancy

校正R2 AIC VIF 影响因素组合
0.48 1122.13 2.52 +PCGDP***, -AE***, +POE***, +HB**, -PCSO2*,
0.48 1123.73 2.52 +PCGDP***, -AE***, +POE***, +HB**, -PM2.5**, +PCSCH
0.48 1123.82 3.26 +PCGDP***, -AE***, +POE***, +HB**, -PM2.5**, +DP
0.47 1124.21 2.87 +PCGDP***, -AE***, +HB**, +AT*, -PCSO2*, -PM10*
0.47 1125.43 3.26 -AE***, +PCGDP***, +POE***, +HB**, -PCSO2*, +DP*, -PM10
0.47 1125.84 2.87 -AE***, +PCGDP***, +POE***, +HB**, +DP*, -PM2.5, -PCSO2
0.47 1125.93 3.31 +PCGDP***, -AE***, +POE**, +DP**, +HB*, -PCSO2, +PCSDB
0.47 1126.48 2.61 +PCGDP***, -AE***, +POE***, -PCSO2*, +DP*
0.47 1126.84 3.24 +PCGDP***, -AE***, +POE***, +HB**, +DP

注: 加减号代表系数的正负;***, ***分别代表显著性水平为1%、 5%和10%。

表3 筛选后预期寿命影响因素的描述性统计

Tab. 3 Descriptive statistics of factors affecting life expectancy after screening

影响因素 最小值 最大值 平均值 标准差
千人床位数/张 1.71 13.58 4.65 1.63
人均GDP/万元 1.02 20.02 4.96 2.93
人均SO2排放量/kg 0.03 224.89 17.85 26.28
平均海拔/m 1.32 4814.85 533.78 648.10
教育从业人员占比/% 0.65 3.44 1.25 0.41
在OLS回归分析中,所有因素均与预期寿命显著相关(表4),这表明在探索性回归分析中确定的因素足以解释预期寿命。人均GDP(系数为 0.59, p <0.01)对预期寿命的影响最大,并且与预期寿命呈正相关,其次是教育从业人员占比(系数= 0.48,p <0.01)和千人床位数(系数= 0.40, p <0.05)。平均海拔(系数=-0.25,p <0.01)和人均SO2排放量对预期寿命的影响最小(系数=-0.27, p <0.1),并且与预期寿命呈负相关。OLS回归的校正R2值为0.48,VIF值远低于7.5,表明不存在严重的多重共线性问题。
表4 预期寿命影响因素的OLS回归分析结果

Tab. 4 OLS regression analysis results of factors affecting life expectancy

影响因素 系数 标准误差 VIF
截距 76.67*** 0.10
千人床位数 0.40** 0.16 1.96
人均GDP 0.59*** 0.19 2.52
人均SO2排放量 -0.27* 0.15 1.51
平均海拔 -0.25*** 0.15 1.44
教育从业人员占比 0.48*** 0.14 2.24

注: ***,**, * 分别代表显著性水平为1%,5%和10%。

OLS回归的结果表明,经济发展是促进预期寿命增长最关键的因素。有研究认为,人均GDP每增加1000元,都会使预期寿命延长0.115~0.120年[29,54]。这是因为经济发展决定居民的可支配收入,居民能够获得更好的生活条件,有利于延长寿命。此外,OLS结果表明,中国公民的预期寿命受益于医疗保健和基础教育的发展,这与先前的研究结果一致[55]。医疗设施与人的寿命直接相关,较好的医疗条件能够降低死亡风险[40]。接受过较高水平教育的人通常选择更健康的生活方式,能够有效地预防疾病风险。结果还表明,环境污染和平均海拔高度对预期寿命呈负面影响。环境污染方面,SO2浓度的增加与心血管疾病的就诊率有显著关联,这表明环境污染可能是包括癌症在内的多种疾病的致病因素,可能增加死亡风险[56, 57]。平均海拔方面,中国地势呈三级阶梯分布,东部地区多为平原和丘陵地带,气候相对于西部地区更温和适宜,有研究表明平均温度8.6~24.9 °C之间,相对湿度较高(68%),阳光充足(超过821.5 h)的条件有利于长寿[58],这种良好的气候将提供更健康、更合适的生活环境,支撑了本文的研究结果。

3.3 影响因素的空间差异

将5种影响因素输入到GWR模型中,结果显示校正R2为0.53,相较于OLS模型有一定程度的提升。局部R2是GWR模型的生成结果之一,局部R2值越高表明模型在该地区的模拟效果越好。图4展现了GWR模型拟合的局部R2,表明GWR模型在华东地区拟合效果优于中西部以及东北部地区。此外,图4还体现出GWR模型的空间非平稳性,表明GWR模型比具有全局稳定性的OLS模型更适用于探索不同区域居民预期寿命的关键影响因素。
图4 GWR模型的局部R2

注:该图基于自然资源部标准地图服务网站下载的审图号为GS(2019)1823号的标准地图制作,底图无修改;由于数据获取困难,本次研究不包括香港、台湾和澳门。

Fig. 4 Local R2 values for the GWR model

GWR模型的结果还包含一系列的回归系数,某一个城市的某一种影响因素的回归系数绝对值越大,代表该种因素对这所城市居民的预期寿命影响程度越大。图5展现了GWR模型生成的5种影响因素系数的空间分布,表明预期寿命影响因素的影响程度具有明显的空间差异:
图5 基于GWR模型的5种影响因素的回归系数分布

注:该图基于自然资源部标准地图服务网站下载的审图号为GS(2019)1823号的标准地图制作,底图无修改;由于数据获取困难,本次研究不包括香港、台湾和澳门。

Fig. 5 Regression coefficient distribution for five factors based on the GWR model

(1)医疗设施条件方面,东北和西南地区的回归系数最大,并呈东北和西南向中部递减的趋势,这种空间差异表明东北和西南地区居民的预期寿命对当地的医疗设施条件更加“敏感”,即假设其他影响因素不变,各地区同时增加同等数量的医疗设施,东北和西南地区的居民能够增长更多的预期寿命。
(2)经济发展方面,回归系数呈由东南向西北逐渐减少的趋势,这种空间差异表明,相比于其他地区,东南沿海地区居民的预期寿命受到当地的经济因素促进作用更大。
(3)平均海拔方面,大部分地区的回归系数为负值,西部地区回归系数的绝对值最大,这表明相比于其他地区,西部地区居民的预期寿命受平均海拔的负面影响程度更高。
(4)环境污染方面,各区域回归系数皆为负数,且其绝对值由东南地区向西北地区逐渐增大。这表明西北地区居民的预期寿命比东南地区更易受到环境污染带来的负面影响。
(5)教育条件方面,回归系数皆为正值且北部地区的回归系数大于南部,表明相比于其他地区,北部地区的教育条件对当地居民的预期寿命的促进作用最大。

3.4 中国城市的聚类分析

对GWR模型的回归系数进行二阶聚类,城市被分为3类:第一类共68个城市,包括上海、江苏、浙江、福建、江西、安徽和湖北部分地区;第二类共86个城市,包括河北、河南、山西、甘肃、内蒙古和山东部分地区;第三类共132个城市,包括北京、天津、辽宁、黑龙江、重庆、四川、贵州、广西、广东和湖南。图6是二阶聚类的分析结果,其含义是某一类城市在某种因素中的系数绝对值越大,该类城市居民的预期寿命越容易受到此因素的影响。城市的聚类结果在空间上的分布如图7所示。图6图7有助于了解影响每种类别城市的空间分布及主要影响因素。
图6 GWR模型回归系数的二阶聚类分析结果

Fig. 6 Two-step cluster analysis results of the regression coefficients of the GWR model

图7 根据2015年预期寿命关键影响因素划分的3类城市空间分布

注:该图基于自然资源部标准地图服务网站下载的审图号为GS(2019)1823号的标准地图制作,底图无修改;由于数据获取困难,本次研究不包括香港、台湾和澳门。

Fig. 7 The spatial distribution of three types of cities based on key factors affecting life expectancy in 2015

聚类结果意味着每类城市居民的预期寿命的关键影响因素有所不同:第一类城市居民的预期寿命受环境污染和经济因素影响最大,即相比于其他因素,第一类城市居民的预期寿命对经济和环境污染因素更加“敏感”;第二类城市居民的预期寿命在5个维度的因素中受到教育条件的影响最大;而医疗设施是第三类城市居民的预期寿命关键影响因素。

4 结论与讨论

4.1 结论

本研究采用探索性回归和OLS回归筛选出与预期寿命最相关的影响因素组合并评估每个因素的全局重要性,利用GWR模型分析影响因素的空间差异,并根据这种空间差异,通过二阶聚类将286个城市分为3类。主要结论如下:
(1)经济发展,教育条件和医疗设施条件对预期寿命有显著的积极影响,平均海拔高度和环境污染则具有负面影响。中国幅员辽阔,各地区之间的上述影响因素具有较大差异,形成了人口预期寿命东部地区高于西部地区、沿海地区高于内陆地区的空间格局。
(2)医疗条件方面,东北和西南地区居民的预期寿命对当地的医疗设施条件更加“敏感”;经济发展方面,相比于其他地区,东南沿海地区居民的预期寿命受到当地的经济因素促进作用更大;自然条件方面,西部地区居民的预期寿命受平均海拔的负面影响程度比其他地区更高;环境污染方面,西北地区居民的预期寿命比东南地区更易受到环境污染带来的负面影响;教育条件方面,相比于其他地区,北部地区的教育条件对当地居民的预期寿命的促进作用最大。
(3)第一、二、三类城市居民的预期寿命的关键影响因素分别是经济因素和环境污染因素、教育条件、医疗设施。第一类城市的城市管理者应在考虑发展经济同时,兼顾控制环境污染,逐步调整产业结构,减少高污染产业所占比重,加大对污染企业的管控力度,控制污染气体的排放,发展低碳经济。第二类城市的城市管理者需要重点考虑教育条件,加大对教育基础设施的投资,增加各学校的教学设施配备,提高教育从业人员数量和质量。第三类城市的城市管理者应着力推进医疗卫生基础设施建设,改善居民就医环境,提升医疗服务能力,保障医疗服务质量。

4.2 讨论

多数预期寿命及其影响因素的研究仅使用GWR模型的结果探索影响预期寿命因素的空间差异[11,17,29,30,40],但GWR模型的结果较为复杂,并不能直观地为城市管理者提供有效的决策依据。本研究采用两步聚类法进一步对GWR结果进行分析挖掘,确定影响不同城市居民预期寿命的关键因素并针对性地提出改善每类城市的居民预期寿命的政策建议,对实现《“健康中国2030”规划纲要》提出在2030年预期寿命到达79.0的目标具有重要参考意义。但本研究有2点不足之处:① 本文从宏观方面选取影响因素,并没有涉及到如饮食习惯、生活方式等其他具体因素,而有研究证明这些因素也会对预期寿命产生一定的影响[17,59];② 一所城市的人口预期寿命及其影响因素也会存在城乡差异[60],由于缺乏统计数据,研究无法有效地计算每个城市的城乡预期寿命差异。因此,未来的研究应进一步精细化,以更高的准确性和精确度评估预期寿命及其影响因素的空间差异。
[1]
郭文杰, 秦昆, 毛宗福, 等. “一带一路”成员国居民健康状况的时空统计分析[J]. 地球信息科学学报, 2020, 22(5):1133-1141.

DOI

[ Guo W J, Qin K, Mao Z F, et al. Spatio-temporal statistical analysis of health status of the residents of the Belt and Road member countries[J]. Journal of Geo-information Science, 2020, 22(5):1133-1141. ]

[2]
李畅, 王安丽, 龚胜生, 等. 中国中部六省预期寿命时序加密估算研究[J]. 地理学报, 2020, 75(10):2269-2280.

DOI

[ Li C, Wang A L, Gong S S, et al. Time-series estimation of provincial life expectancy in China: A case study of six provinces in central China[J]. Journal of Geographical Sciences. 2020, 75(10):2269-2280. ]

[3]
郭玉玲. 中国人均预期寿命时空变化及影响因素分析[J]. 中国卫生政策研究, 2018, 11(8):44-49.

[ Guo Y L. Analysis of spatio-temporal changes in life expectancy and its influencing factors in China[J]. Chinese Journal of Health Policy, 2018, 11(8):44-49. ]

[4]
中共中央国务院印发《“健康中国2030”规划纲要》[J]. 中华人民共和国国务院公报, 2016(32):5-20.

[ The outline of Healthy China 2030 Plan[J]. Gazette of the State Council of the People's Republic of China, 2016(32):5-20. ]

[5]
中华人民共和国外交部. 变革我们的世界: 2030年可持续发展议程2016[EB/OL]. https://www.fmprc.gov.cn/web/ziliao_674904/zt_674979/dnzt_674981/qtzt/2030kcxfzyc_686343/t1331382.shtml

[ Ministry of Foreign Affairs of the People's Republic of China. Transforming our world: The 2030 Agenda for Sustainable[EB/OL]. https://www.fmprc.gov.cn/web/ziliao_674904/zt_674979/dnzt_674981/qtzt/2030kcxfzyc_686343/t1331382.shtml

[6]
Acciai F, Firebaugh G. Why did life expectancy decline in the United States in 2015? A gender-specific analysis[J]. Social Science & Medicine, 2017, 190:174-180.

DOI

[7]
齐亚强, 李琳. 中国预期寿命变动的地区差异及其社会经济影响因素: 1981—2010[J]. 中国卫生政策研究, 2018, 11(8):29-35.

[ Qi Y Q, Li L. Regional disparities in life expectancy and their socio-economic determinants from 1981 to 2010 in China[J]. Chinese Journal of Health Policy, 2018, 11(8):29-35. ]

[8]
明艳, 董志勇. 我国人口预期寿命的影响因素分析[J]. 学理论, 2010(4):47-50.

[ Ming Y, Dong Z Y. Life expectancy of China’s population analysis of the impact of factors[J]. Theory Research, 2010(4):47-50. ]

[9]
Buettner D. The Blue Zone: lessons for living longer from the people who've lived the longest[M]. Washington, DC: National Geographic, 2010.

[10]
Dobis E A, Stephens H M, Skidmore M, et al. Explaining the spatial variation in American life expectancy[J]. Social Science & Medicine, 2019, 246:112759.

DOI

[11]
董惠玲, 任桂芳, 宁佩, 等. 基于地理加权回归的老年人口健康预期寿命影响因素分析[J]. 中国卫生政策研究, 2020, 13(2):73-80.

[ Dong H L, Ren G F, Ning P, et al. Analysison factors influencing healthy life expectancy of elderly population based on geographic weight regression[J]. Chinese Journal of Health Policy, 2020, 13(2):73-80. ]

[12]
Andrade F C D, Corona L P, Oliveira Duarte Y A. Educational differences in cognitive life expectancy among older adults in Brazil[J]. Journal of the American Geriatrics Society, 2019, 67(6):1218-1225.

[13]
Huebener M. Life expectancy and parental education[J]. Social Science & Medicine, 2019, 232:351-365.

DOI

[14]
Mackenbach J P, Valverde J R, Bopp M, et al. Determinants of inequalities in life expectancy: An international comparative study of eight risk factors[J]. The Lancet Public Health, 2019, 4(10):e529-e537.

DOI

[15]
Shkolnikov V M, Andreev E M, Tursun-Zade R, et al. Patterns in the relationship between life expectancy and gross domestic product in Russia in 2005-15: A cross-sectional analysis[J]. The Lancet Public Health, 2019, 4(4):e181-e188.

DOI

[16]
Wang Z H, Asghar M M, Zaidi S A H, et al. The dynamic relationship between economic growth and life expectancy: Contradictory role of energy consumption and financial development in Pakistan[J]. Structural Change and Economic Dynamics, 2020, 53:257-266.

DOI

[17]
Huang Y, Rosenberg M, Hou L L, et al. Relationships among environment, climate, and longevity in China[J]. International Journal of Environmental Research and Public Health, 2017, 14(10):1195.

DOI

[18]
Wang S, Luo K, Liu Y. Spatio-temporal distribution of human lifespan in China[J]. Scientific Reports, 2015, 5:13844.

DOI

[19]
Zha X J, Tian Y, Gao X, et al. Quantitatively evaluate the environmental impact factors of the life expectancy in Tibet, China[J]. Environmental Geochemistry and Health, 2019, 41(3):1507-1520.

DOI

[20]
Han C L, Xu R B, Gao C X, et al. Socioeconomic disparity in the association between long-term exposure to PM2.5 and mortality in 2640 Chinese counties[J]. Environment International, 2020, 146:106241.

DOI

[21]
Tonne C, Adair L, Adlakha D, et al. Defining pathways to healthy sustainable urban development[J]. Environment International, 2021, 146:106236.

DOI

[22]
Hosseinpoor A R, Stewart Williams J, Amin A, et al. Social determinants of self-reported health in women and men: understanding the role of gender in population health[J]. PLoS One, 2012, 7(4):e34799.

DOI

[23]
Mishra R S, Mishra R, Mohanty S K. Gender differential and regional disparity of disability-free life-expectancy among disable in India[J]. Clinical Epidemiology and Global Health, 2020, 8(3):818-827.

DOI

[24]
Jorgenson A K, Fitzgerald J B, Thombs R P, et al. The multiplicative impacts of working hours and fine particulate matter concentration on life expectancy: A longitudinal analysis of US States[J]. Environmental Research. 2020, 191:110117.

DOI PMID

[25]
王五一, 李永华, 李海蓉, 等. 中国区域长寿的环境机制[J]. 科学决策, 2015(1):1-12.

[ Wang W Y, Li Y H, Li H R, et al. Environmental mechanism of regional longevity in China[J]. Scientific Decision-Making, 2015(1):1-12. ]

[26]
Sun S, Chen J Y, Johannesson M, et al. Regional differences in health status in China: Population health-related quality of life results from the National Health Services Survey 2008[J]. Health & Place, 2011, 17(2):671-680.

[27]
Cavalieri M, Ferrante L. Convergence, decentralization and spatial effects: An analysis of Italian regional health outcomes[J]. Health Policy (Amsterdam, Netherlands), 2020, 124(2):164-173.

DOI

[28]
Wang S. Spatial patterns and social-economic influential factors of population aging: A global assessment from 1990 to 2010[J]. Social Science & Medicine, 2020, 253:112963.

DOI

[29]
Song W J, Li Y H, Hao Z, et al. Public health in China: An environmental and socio-economic perspective[J]. Atmospheric Environment, 2016, 129:9-17.

DOI

[30]
Wang L, Wei B G, Li Y H, et al. A study of air pollutants influencing life expectancy and longevity from spatial perspective in China[J]. Science of the Total Environment, 2014, 487:57-64.

DOI

[31]
中国科学院资源环境数据云平台. 中国海拔高度空间分布数据[DB/OL]. http://www.resdc.cn

[ Resource and Environment Data Cloud Platform. China's altitude spatial distribution data[DB/OL]. http://www.resdc.cn

[32]
中国科学院资源环境数据云平台. 年平均降水量空间分布数据[DB/OL]. http://www.resdc.cn

[ Resource and Environment Data Cloud Platform. Spatial distribution data of annual average precipitation[DB/OL]. http://www.resdc.cn

[33]
中国科学院资源环境数据云平台. 年平均气温空间分布数据[DB/OL]. http://www.resdc.cn

[ Resource and Environment Data Cloud Platform. Spatial distribution data of annual average temperature[DB/OL]. http://www.resdc.cn

[34]
EU Science Hub. Gridmaps of PM2.5 and PM10[DB/OL]. http://edgar.jrc.ec.europa.eu

[35]
国家统计局城市社会经济调查司. 中国城市统计年鉴(2016)[M]. 北京: 中国统计出版社,2016.

[ Department of Urban Social and Economic Investigation, National Bureau of Statistics. China City Statistical Yearbook (2016)[M]. Beijing: China Statistics Press, 2016. ]

[36]
He L, Li N. The linkages between life expectancy and economic growth: some new evidence[J]. Empirical Economics, 2020, 58(5):2381-2402.

DOI

[37]
Linden M, Ray D. Aggregation bias-correcting approach to the health-income relationship: Life expectancy and GDP per capita in 148 countries, 1970-2010[J]. Economic Modelling. 2017, 61:126-136.

DOI

[38]
杨芊芊. 长寿风险、主观预期寿命与家庭资产配置[D]. 杭州:浙江大学, 2019.

[ Yang Q Q. Longevity risk, subjective life expectancy and household portfolio choice[D]. Hangzhou: Zhejiang University, 2019. ]

[39]
Population aging, fertility and social security[M]. Cham: Springer International Publishing, 2017.

[40]
Jiang J F, Luo L S, Xu P, et al. How does social development influence life expectancy? A geographically weighted regression analysis in China[J]. Public Health, 2018, 163:95-104.

DOI PMID

[41]
Amiri A, Solankallio-Vahteri T. Nurse staffing and life expectancy at birth and at 65 years old: Evidence from 35 OECD countries[J]. International Journal of Nursing Sciences, 2019, 6(4):362-370.

DOI

[42]
Wu Y, Wang W, Liu C, et al. The association between long-term fine particulate air pollution and life expectancy in China, 2013 to 2017[J]. Science of the Total Environment, 2020, 712:136507.

DOI

[43]
Yin P, Brauer M, Cohen A J, et al. The effect of air pollution on deaths, disease burden, and life expectancy across China and its provinces, 1990-2017: An analysis for the Global Burden of Disease Study 2017[J]. Lancet Planet Health, 2020, 4(9):e386-e398.

[44]
Dziubanek G, Spychała A, Marchwińska-Wyrwał E, et al. Long-term exposure to urban air pollution and the relationship with life expectancy in cohort of 3.5 million people in Silesia[J]. Science of the Total Environment, 2017, 580:1-8.

DOI

[45]
刘建立. 我国人口受教育程度的省际差异及其影响因素研究[D]. 上海:华东师范大学, 2013.

[ Liu J L. Study on the provincial differences of educational attainment and influential factors in China[D]. Shanghai: East China Normal University, 2013. ]

[46]
Wang S J, Fang C L, Ma H T, et al. Spatial differences and multi-mechanism of carbon footprint based on GWR model in provincial China[J]. Journal of Geographical Sciences, 2014, 24(4):612-630.

DOI

[47]
Yang H T, Lu X Z, Cherry C, et al. Spatial variations in active mode trip volume at intersections: a local analysis utilizing geographically weighted regression[J]. Journal of Transport Geography, 2017, 64:184-194.

DOI

[48]
Chi S, Grigsby-Toussaint D S, Bradford N, et al. Can geographically weighted regression improve our contextual understanding of obesity in the US? Findings from the USDA Food Atlas[J]. Applied Geography, 2013, 44:134-142.

DOI

[49]
Li C, Li F B, Wu Z F, et al. Exploring spatially varying and scale-dependent relationships between soil contamination and landscape patterns using geographically weighted regression[J]. Applied Geography, 2017, 82:101-114.

DOI

[50]
Zhang H L, Zhang J, Lu S J, et al. Modeling hotel room price with geographically weighted regression[J]. International Journal of Hospitality Management, 2011, 30(4):1036-1043.

DOI

[51]
Conry M C, Morgan K, Curry P, et al. The clustering of health behaviours in Ireland and their relationship with mental health, self-rated health and quality of life[J]. BMC Public Health, 2011, 11:692.

DOI PMID

[52]
Lambert M, Poljak Z, Arsenault J, et al. Epidemiological investigations in regard to porcine reproductive and respiratory syndrome (PRRS) in Quebec, Canada. Part 1: Biosecurity practices and their geographical distribution in two areas of different swine density[J]. Preventive Veterinary Medicine, 2012, 104(1-2):74-83.

DOI

[53]
汪存友, 余嘉元. SPSS两阶聚类法如何自动确定聚类数[J]. 中国卫生统计, 2010, 27(2):202-203.

[ Wang C Y, Yu J Y. How to automatically determine the number of clusters in SPSS two-stage clustering method[J]. Chinese Journal of Health Statistics, 2010, 27(2):202-203. ]

[54]
Song X M, Chen G, Zheng X Y. Chinese life expectancy and policy implications[J]. Procedia-Social and Behavioral Sciences. 2010, 2(5):7550-7555.

DOI

[55]
Sen A. Development as freedom[M]. New York: Oxford University Press, 1999.

[56]
Szyszkowicz M. Ambient air pollution and daily emergency department visits for ischemic stroke in Edmonton, Canada[J]. International Journal of Occupational Medicine and Environmental Health, 2008, 21(4):295-300.

DOI PMID

[57]
Santos U P, Terra-Filho M, Lin C A, et al. Cardiac arrhythmia emergency room visits and environmental air pollution in Sao Paulo, Brazil[J]. Journal of Epidemiology & Community Health, 2008, 62(3):267-272.

DOI

[58]
Lv J M, Wang W Y, Li Y H. Effects of environmental factors on the longevous people in China[J]. Archives of Gerontology and Geriatrics, 2011, 53(2):200-205.

DOI

[59]
Frisco M L, Van Hook J, Hummer R A. Would the elimination of obesity and smoking reduce U.S. racial/ethnic/nativity disparities in total and healthy life expectancy?[J]. SSM - Population Health, 2019, 7:100374.

DOI

[60]
杨明旭, 鲁蓓. 中国2010年分省死亡率与预期寿命—基于各省第六次人口普查资料[J]. 人口研究, 2019, 43(1):18-35.

[ Yang M X, Lu B. An assessment of mortality and life expectancy for China's provinces: Based on the 2010 provincial census data[J]. Population Research, 2019, 43(1):18-35. ]

Outlines

/