
Journal of Geo-information Science >
Next-day Prediction of Pollen Concentration in Beijing by Integrating Remote Sensing Derived Leaf Area Index
Received date: 2020-08-20
Revised date: 2021-02-19
Online published: 2021-11-25
Supported by
National Natural Science Foundation of China, Key Program(2017YFB0503600)
Copyright
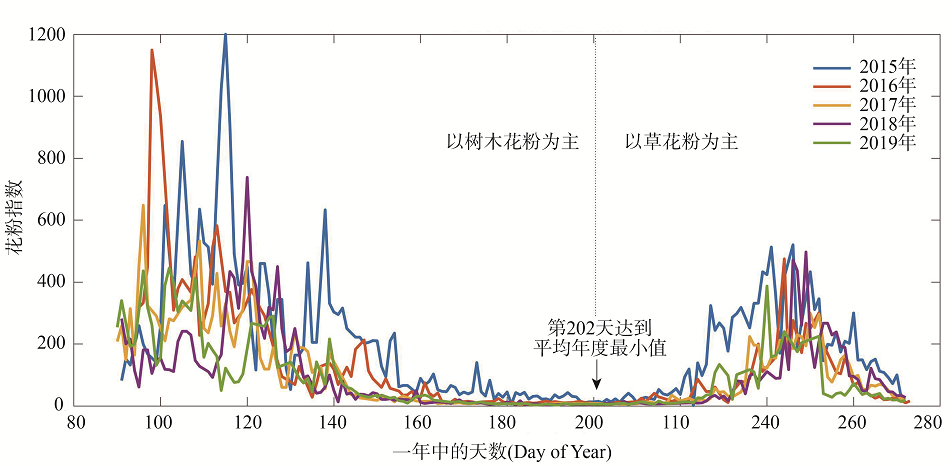
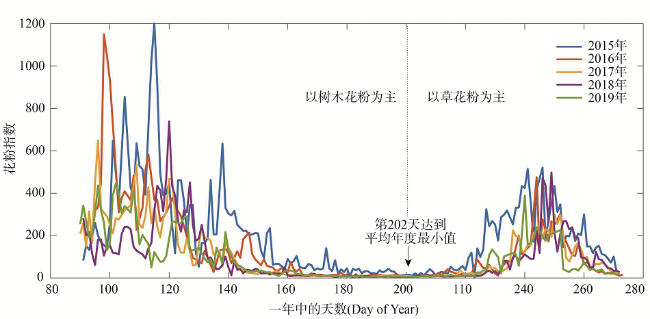
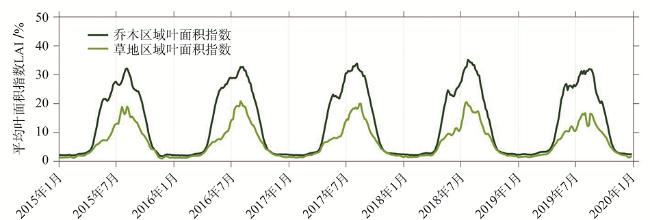
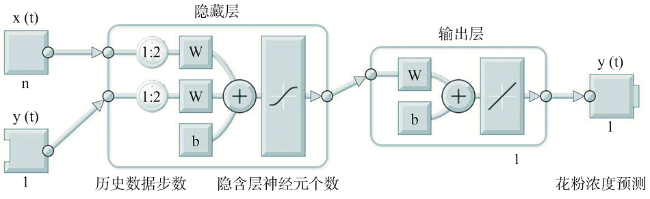
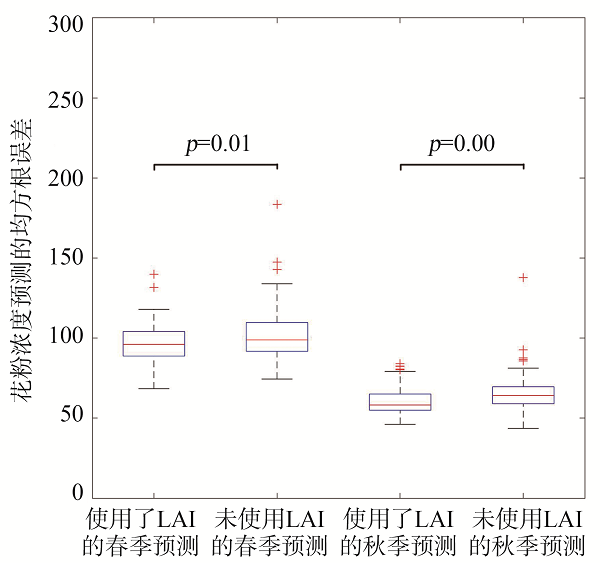
There has been an increase in the area and quality of vegetation coverage in many cities of China, which leads to a concomitant increase in the risk of allergenic pollen that affects human health. However, there is still limitation in the accuracy and regional applicability of pollen forecasting services, partly because pollen concentration predictors are more focused on meteorological observations rather than phenological observation of plants. For the seasonal trend of allergenic pollen concentration, phenological observations of vegetation may be an important indicator as well as meteorological factors, because the characteristics of vegetation phenology are directly correlated with pollen release. In this study, the time series Leaf Area Index (LAI) for tree and grass covers that reflects vegetation growth processes was derived from remote sensing techniques and represented as one of the predictors of pollen concentration in air. By combining the derived LAI information with the daily meteorological data, Nonlinear Autoregressive Neural Networks with External Input (NARXnet) combined with stepwise regression were employed to predict the pollen concentration in air of the next day in Beijing. The results show that (1) the three-day moving average of daily temperature, the cumulative temperature, LAI, and the first-order derivatives of LAI were key predictors of the next-day pollen concentration for the spring season, while the mean daily temperature, mean wind speed, the minimum daily air temperature, the three-day moving average of daily temperature, the cumulative temperature, and the LAI were key predictors of the next-day pollen concentration for the fall season; (2) in Beijing, the inclusion of remotely sensed phenological information could significantly improve the prediction accuracy of the pollen concentration for both the spring and autumn seasons from NARXnet model. According to the results, we conclude that, in combination with the meteorological factors, vegetation phenology information such as LAI obtained from remote sensing is an effective predictor of the next-day pollen concentration.
BIAN Meng , GUO Shuyi , WANG Wei , OUYANG Yuhui , HUANG Yinqin , FEI Teng . Next-day Prediction of Pollen Concentration in Beijing by Integrating Remote Sensing Derived Leaf Area Index[J]. Journal of Geo-information Science, 2021 , 23(9) : 1705 -1713 . DOI: 10.12082/dqxxkx.2021.200475
表1 逐步回归得出显著气象及物候因子Tab. 1 Significant meteorological and phenological factors from stepwise regressions |
| 春季 | 系数 | t值 | p值 | 统计量 | 秋季 | 系数 | t值 | p值 | 统计量 |
|---|---|---|---|---|---|---|---|---|---|
| 日均气温 | 1.30 | 0.59 | 0.55 | rmse: 133.7 | 日均气温** | 6.02 | 3.34 | 0.01 | rmse: 131.17 |
| 露点 | -0.83 | -1.20 | 0.23 | rsq: 0.48 | 露点 | 0.19 | 0.14 | 0.88 | rsq: 0.35 |
| 能见度 | 0.02 | 1.36 | 0.17 | adjrsq: 0.48 | 能见度 | 0.03 | 2.04 | 0.41 | adjrsq: 0.36 |
| 平均风速 | 4.25 | 1.36 | 0.17 | fstat: 107.2 | 平均风速*** | 18.45 | 5.20 | 0.00 | fstat: 42.2 |
| 最大风速 | 1.16 | 0.89 | 0.38 | pval: 0.00 | 最大风速 | -2.21 | -1.14 | 0.15 | pval: 0.00 |
| 最高日气温 | 0.24 | 0.17 | 0.86 | 最高日气温 | -0.79 | -0.37 | 0.26 | ||
| 最低日气温 | -1.02 | -0.64 | 0.52 | 最低日气温* | 4.92 | 3.88 | 0.02 | ||
| 降雨量 | -0.29 | -1.05 | 0.30 | 降雨量 | 0.12 | 0.42 | 0.68 | ||
| 日均气温一阶导 | -0.21 | -0.19 | 0.85 | 日均气温一阶导 | 1.50 | 0.93 | 0.32 | ||
| 平均风速一阶导 | 0.99 | 0.39 | 0.70 | 平均风速一阶导 | 0.00 | 0.00 | 1.00 | ||
| 日温差 | 0.51 | 0.52 | 0.61 | 日温差 | -0.85 | -0.41 | 0.56 | ||
| 日均气温3 d平滑*** | 5.72 | 4.21 | 0.00 | 日均气温3 d平滑** | 8.60 | 4.01 | 0.01 | ||
| 日均气温7 d平滑 | 0.24 | 0.07 | 0.94 | 日均气温7 d平滑 | -8.60 | -1.94 | 0.06 | ||
| 积温*** | -0.02 | -3.49 | 0.00 | 积温*** | -0.01 | -3.85 | 0.00 | ||
| 叶面积指数(LAI)*** | -12.96 | -7.12 | 0.00 | 叶面积指数(LAI)*** | -10.22 | -5.61 | 0.00 | ||
| 叶面积指数一阶导** | 22.62 | 2.81 | 0.01 | 叶面积指数一阶导 | 0.56 | 0.12 | 0.95 | |
注: * p<0.05, ** p<0.01, *** p<0.001。 |
表2 离散化的花粉浓度预测实测值混淆矩阵及离散化方案Tab. 2 Confusion matrix of predicted and measured pollen concentrations |
| 预测\实测 | 很低 | 较低 | 偏高 | 较高 | 很高 | 极高 | 总数/(粒/103mm2) |
|---|---|---|---|---|---|---|---|
| 很低 | 122 | 16 | 10 | 2 | 0 | 0 | 150 |
| 较低 | 3 | 68 | 14 | 4 | 0 | 0 | 89 |
| 偏高 | 0 | 13 | 78 | 24 | 0 | 0 | 115 |
| 较高 | 0 | 0 | 23 | 31 | 2 | 2 | 58 |
| 很高 | 0 | 0 | 1 | 6 | 0 | 0 | 7 |
| 极高 | 0 | 0 | 0 | 0 | 1 | 2 | 3 |
| 总数(粒/千mm2) | 125 | 97 | 126 | 67 | 3 | 4 | 422 |
注:花粉浓度分级依据:很低:0~49粒/103mm2;较低:50~99粒/103mm2;偏高:100~299粒/103mm2;较高:300~499粒/103mm2;很高:500~799粒/103mm2;极高: ≥800粒/103mm2。 |
| [1] |
|
| [2] |
欧阳昱晖, 李颖, 安羽三, 等. 中国北方夏秋季致敏花粉种属和浓度分析[J]. 中国耳鼻咽喉头颈外科, 2020, 27(4):184-187.
[
|
| [3] |
|
| [4] |
胡云锋, 赵冠华, 张云芝. 北京城市绿化的时空动态分析[J]. 地球信息科学学报, 2018, 20(3):332-339.
[
|
| [5] |
|
| [6] |
张德山, 海玉龙, 冯涛, 等. 北京地区1—4天花粉浓度预报的应用研究[J]. 气象, 2010, 36(5):128-132.
[
|
| [7] |
|
| [8] |
徐景先, 李耀宁, 张德山. 空气花粉变化规律和预测预报研究进展[J]. 生态学报, 2009, 29(7):3854-3863.
[
|
| [9] |
程晟. 昆明主城区气传致敏花粉日历及预测模型建立[D]. 昆明:昆明医科大学, 2015.
[
|
| [10] |
|
| [11] |
胡凝, 陈万隆, 刘寿东, 等. 水稻花粉扩散的模拟研究[J]. 生态学报, 2010, 30(14):3665-3671.
[
|
| [12] |
徐倩, 陈渝, 袁荣, 等. 大气湍流间歇性对玉米花粉风扩散的潜在影响[J]. 成都大学学报(自然科学版), 2018, 37(1):1-7.
[
|
| [13] |
刘宜纲, 吕世华, 刘建忠, 等. 2012—2016年海淀区气传花粉物候特征及其与气象要素的关系[J]. 应用生态学报, 2019, 30(10):3563-3571.
[
|
| [14] |
孟龄, 王效科, 欧阳志云, 等. 北京城区气传花粉季节特征及与气象条件关系[J]. 环境科学, 2016, 37(2):452-458.
[
|
| [15] |
赵文芳, 王京丽, 尚敏, 等. 基于粒子群优化和支持向量机的花粉浓度预测模型[J]. 计算机应用, 2019, 39(1):98-104.
[
|
| [16] |
何海娟, 张德山, 乔秉善. 北京城区空气中花粉含量与气象要素的关系初探[J]. 中华微生物学和免疫学杂志, 2001(S2):36-38.
[
|
| [17] |
彭少麟, 郭志华, 王伯荪. RS和GIS在植被生态学中的应用及其前景[J]. 生态学杂志, 1999, 18(5):52-64.
[
|
| [18] |
全国绿化委员会办公室. 2018年中国国土绿化状况公报[EB/OL]. 2019. https://www.forestry.gov.cn/main/63/20190312/174137264929234.html
[ National Greening Committee Office. 2018 China National Greening Status Bulletin [EB/OL], 2019. https://www.forestry.gov.cn/main/63/20190312/174137264929234.html
|
| [19] |
闫珂, 杨华, 李文芳, 等. 城市绿地致敏指数的改进研究及应用[J]. 北京林业大学学报, 2020, 42(5):96-105.
[
|
| [20] |
谷星月, 王美丽, 郝多. “缘起缘灭”专家讲解气象条件与花粉过敏[EB/OL], 2018. http://www.xinhuanet.com/politics/2018-09/20/c_1123460452.htm
[
|
| [21] |
|
| [22] |
|
| [23] |
北京市气象局和北京同仁医院. 花粉观测数. [2020]http://bjweather.iyuebo.com/pollen/
[ Beijing Meteorological Service and Beijing Tongren Hospital. Pollen observation data[2020]. http://bjweather.iyuebo.com/pollen/
|
| [24] |
吴振玲, 宛公展, 白玉荣, 等. 72小时气传花粉预测模型研究[C]//中国颗粒学会第六届学术年会暨海峡两岸颗粒技术研讨会论文集.上海, 2008:14-17.
[
|
| [25] |
|
/
| 〈 |
|
〉 |
