
Journal of Geo-information Science >
Methods to Generate Different Scale Data of Coastline and Its Scale Effect Evaluation
Received date: 2021-02-24
Request revised date: 2021-04-30
Online published: 2021-12-25
Supported by
National Natural Science Foundation of China(41730749)
National Basic Research Program of China(2017YFA0604701)
Copyright
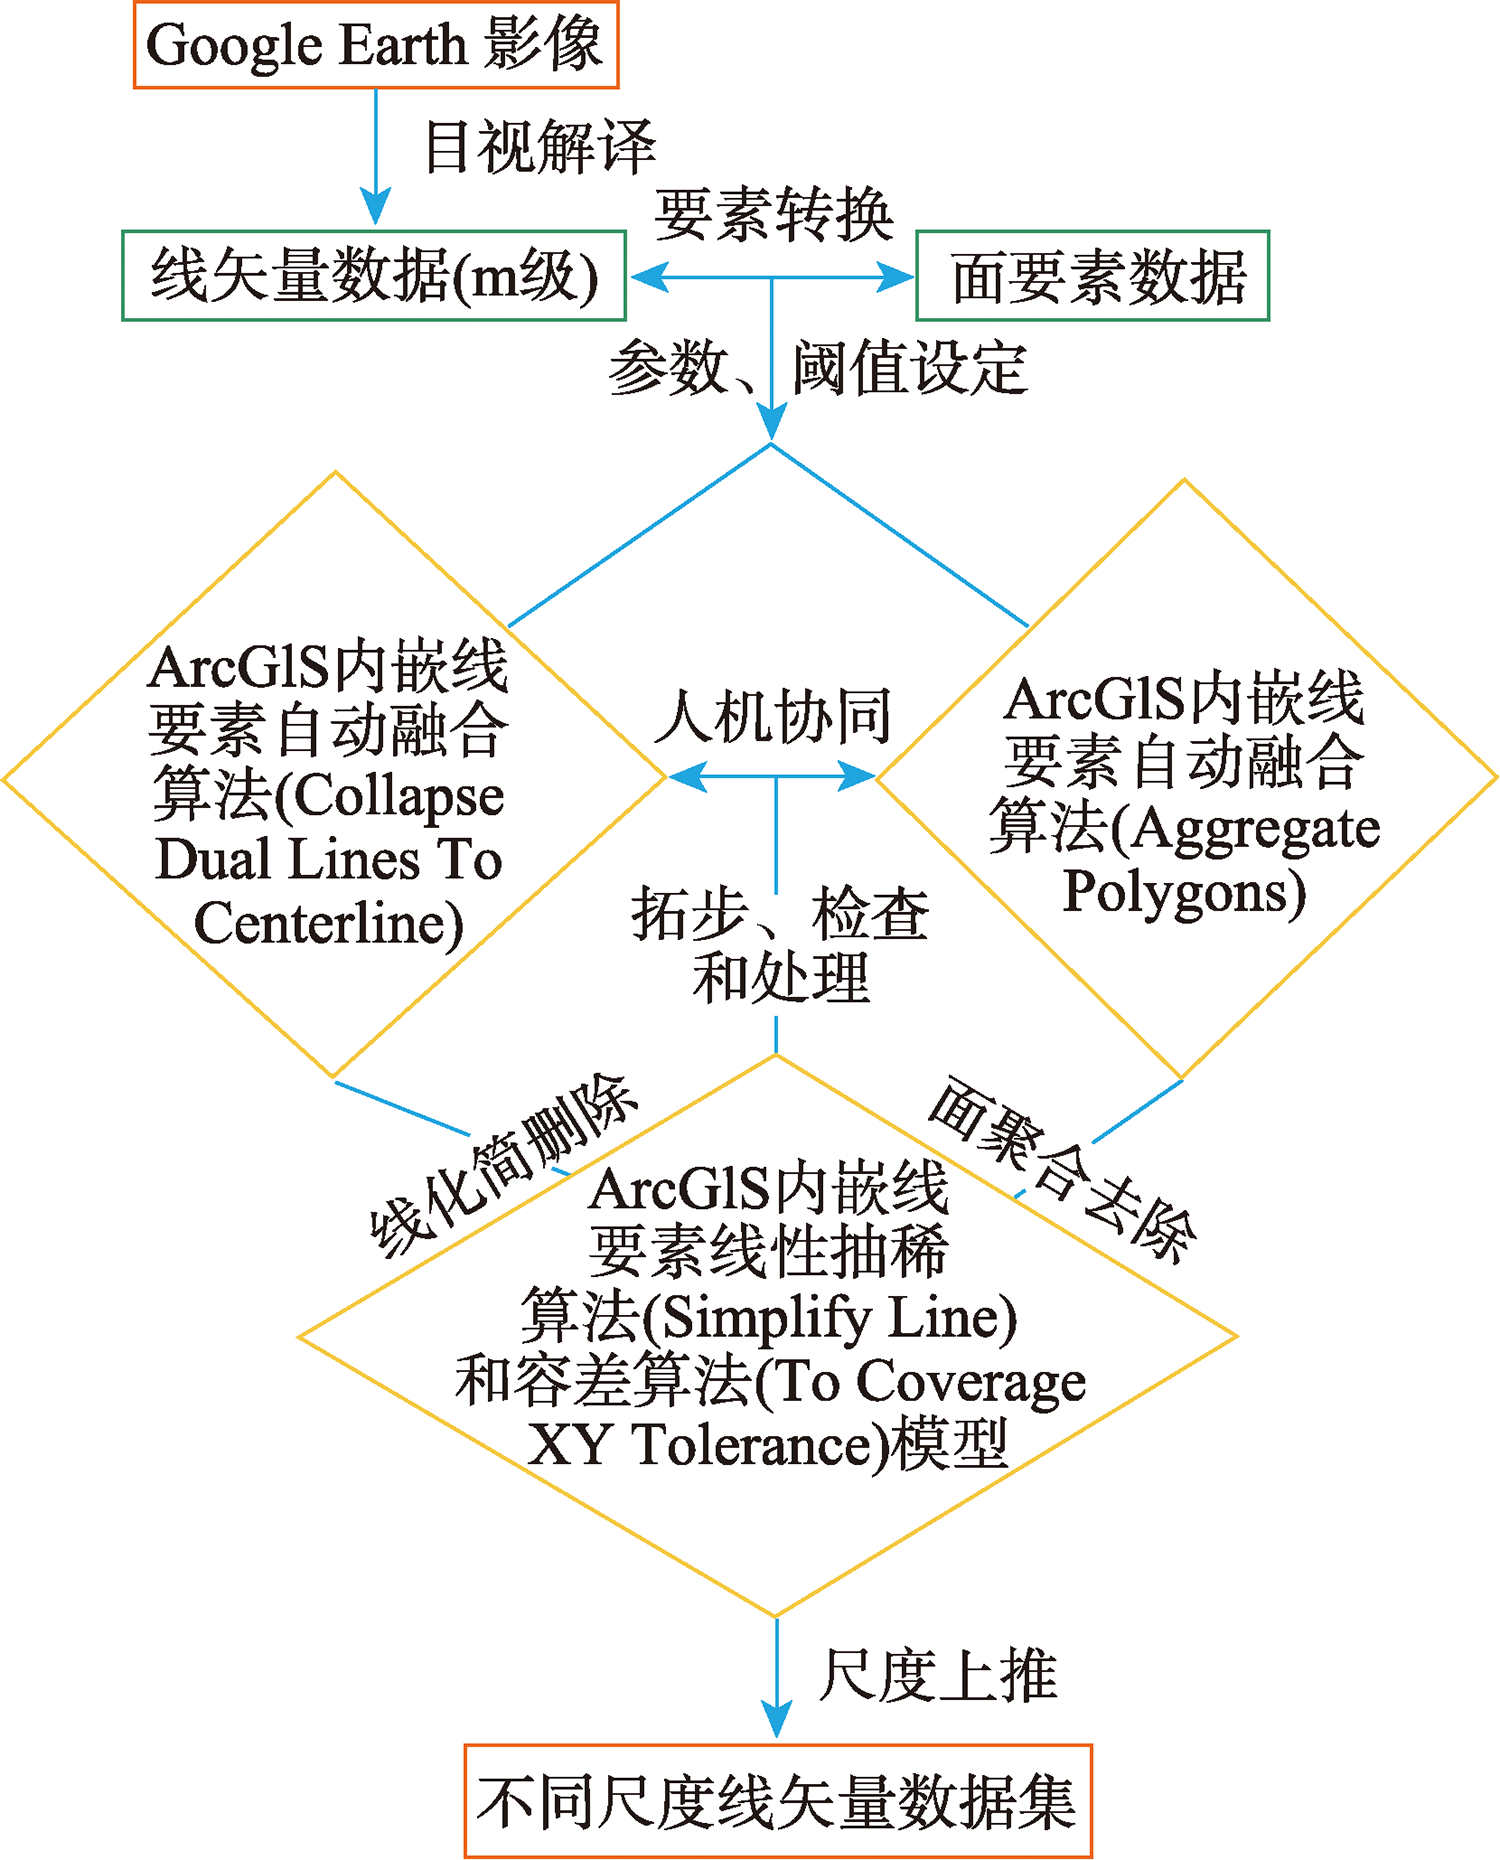
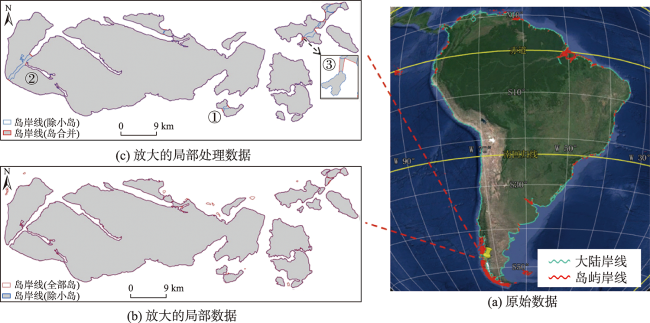
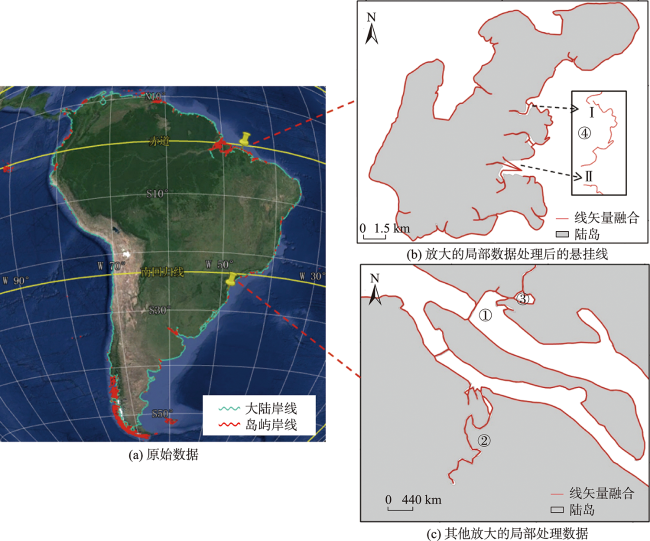
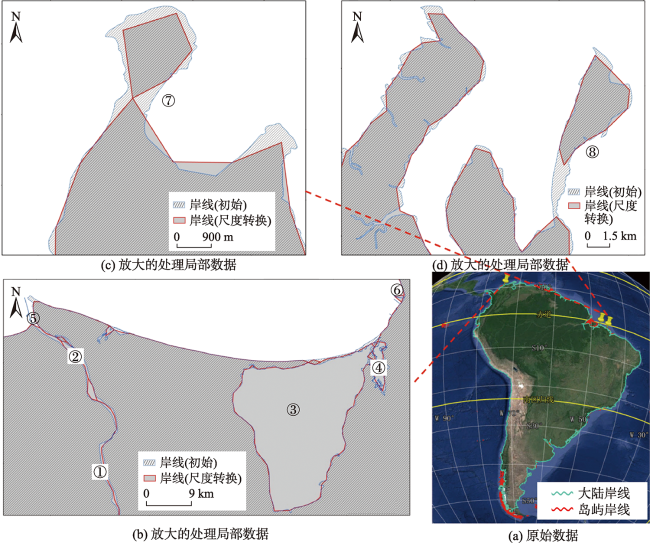
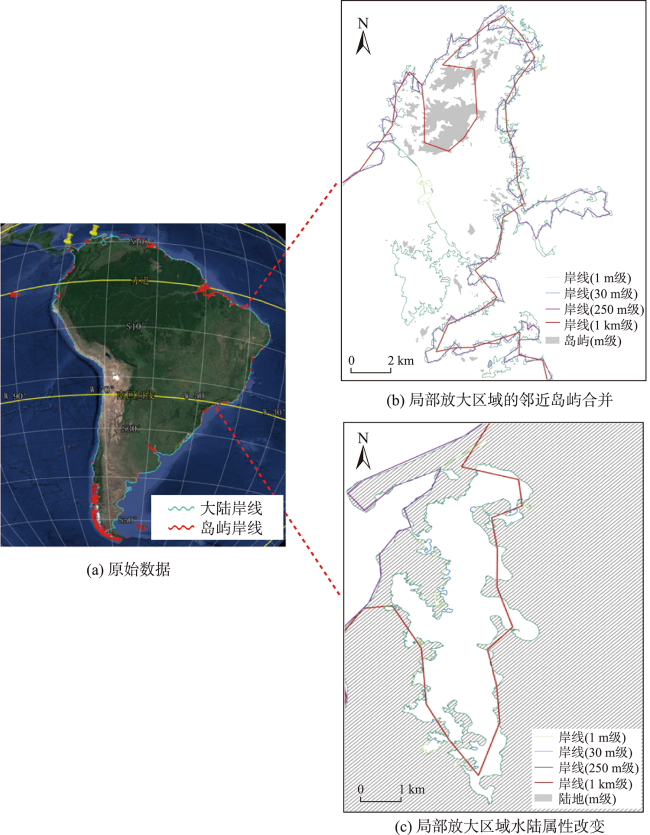
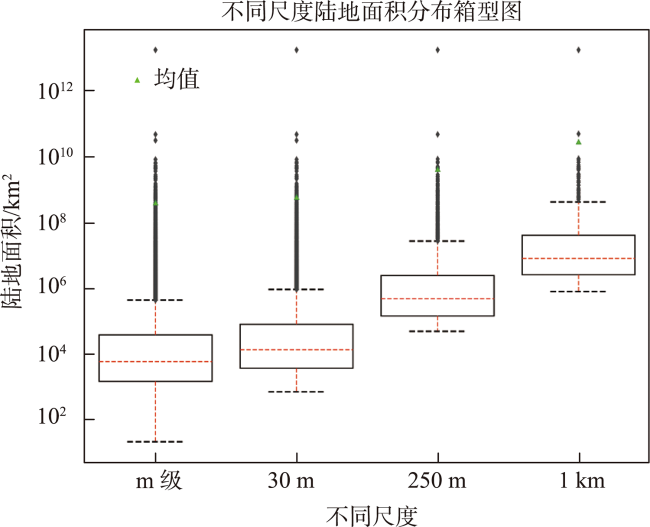
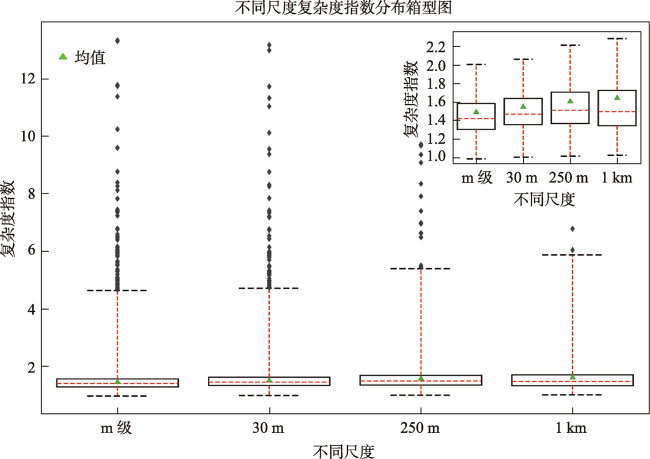
Multi-scale of geospatial data is the cornerstone of cartography, and plays a key role in supporting geographic element analysis and feature recognition. Multi-scale vector data can be generated by selecting, simplifying, aggregating, or other processing of geographic element vector data of a certain scale obtained from remote sensing images. However, a variety of comprehensive processing models and methods will also lead to various levels of information loss in multi-scale vector data. The global coastline is a geographic information element with a wide coverage area, complex curves, various island combinations, and complicated structures of land and water regions. The variation of coastline vector data attributes shows different properties at different scales. For the special coastline vector data, there are multiple influencing factors, and the relationships between them are ambiguous. Therefore, it is impossible to judge the attributes of the elements only based on the combinations of a single or a small number of characteristics of the node or line elements. Meanwhile, using a single mathematical model or algorithm for simplification, the drawing effect often has a large deviation from the actual situation, and it cannot meet the drawing needs of different regions and different scales. Thus, we used Geographic Information System (ArcGIS 10.6) technology to support the automatic comprehensive function of geospatial data mapping, integrated different embedded automatic algorithms and models, and combined human-machine collaboration to build a systematic scale-up method system to achieve different scales of coastline data. Based on fractal theory, the concept of line vector data complexity index was first proposed to characterize the coastline geographic elements and to compare the degree of declination of their information. With the m-scale coastline data interpreted by manual visual interpretation, the scale-up is used to generate coastline data on the scales of 30 m, 250 m, and 1 km, respectively. The information loss assessment was performed on the obtained 30 m, 250 m and 1 km coastline vector data, and the results showed that the mapping integration caused changes in the spatial attributes of land and water. There are significant differences in the fineness of geographic element information represented by different scales. Compared with the m-scale coastline data, the loss of the number of islands on the scales of 30 m, 250 m, and 1 km is 32.07%, 90.46%, and 98.61%, respectively, the information loss of the coastline length is 6.32%, 49.26%, and 75.47%, respectively, and the information granularity of the vector data of the coastline of South America is reduced by 1.97%, 25.33%, and 45.39%, respectively. With the processes of the up-scale of the coastline, it has an increasing trend of the median, mean of the islands area and their complexity index from the m-level to 30 m, 250 m, and 1 km scales. The scale-up method constructed in this paper to combine the computer automatic synthesis model with the artificial processing of the coastline vector data has the potential to efficiently realize the scale-up of the coastline vector data, and describe the information loss of vector data at different spatial scales.
ZHANG Yinghua . Methods to Generate Different Scale Data of Coastline and Its Scale Effect Evaluation[J]. Journal of Geo-information Science, 2021 , 23(10) : 1743 -1755 . DOI: 10.12082/dqxxkx.2021.210094
表1 不同尺度海陆几何要素对比Tab. 1 Comparison of coastline geometric elements at different scales |
| 尺度 | 南美洲大陆 | 南美洲岛屿 | |||||||
|---|---|---|---|---|---|---|---|---|---|
| 长度 /103 km | 面积 /106 km2 | CI | 总数 /个 | 总长度 /103 km | 总面积 /103 km2 | 最大周长 /km | 最大面积 /103 km2 | ||
| m级 | 90.17 | 17.493 | 6.08 | 44 484 | 159.69 | 247.15 | 5731.48 | 47.54 | |
| 30 m | 88.41 | 17.495 | 5.96 | 30 218 | 149.59 | 245.16 | 5693.01 | 47.54 | |
| 250 m | 67.43 | 17.574 | 4.54 | 4242 | 81.02 | 176.81 | 5036.91 | 47.58 | |
| 1 km | 49.38 | 17.602 | 3.32 | 620 | 39.16 | 161.81 | 4311.98 | 49.55 | |
| [1] |
梁立, 刘庆生, 刘高焕, 等. 基于遥感影像的海岸线提取方法综述[J]. 地球信息科学学报, 2018, 20(12):1745-1755.
[
|
| [2] |
张华国, 黄韦艮. 基于分形的海岸线遥感信息空间尺度研究[J]. 遥感学报, 2006, 10(4):463-468.
[
|
| [3] |
闸旋, 滕惠忠, 王俊超, 等. 基于天绘一号卫星多光谱影像的海岸线自动提取方法[J]. 海洋测绘, 2018, 38(4):58-62.
[
|
| [4] |
原晓慧, 王萍, 张英, 等. 基于边缘检测的海岸线自动提取研究[J]. 北京测绘, 2019, 33(2):148-152.
[
|
| [5] |
|
| [6] |
|
| [7] |
ERsi. "Automation of Map Generalization: The Cutting-Edge Technology"[Z]. Technical Paper. Download address: http://downloads.esri.com/support/whitepapers/ao_/mapgen.pdf 1996.
|
| [8] |
胡云锋, 徐芝英, 刘越, 等. 空间尺度上推方法的精度评价——以内蒙古锡林郭勒盟土地利用数据为例[J]. 地理研究, 2012, 31(11):1961-1972.
[
|
| [9] |
孟斌, 王劲峰. 地理数据尺度转换方法研究进展[J]. 地理学报, 2005, 60(2):277-288.
[
|
| [10] |
|
| [11] |
|
| [12] |
栾海军, 田庆久, 余涛, 等. 根据分形理论与五指标评价体系构建NDVI连续空间尺度转换模型[J]. 遥感学报, 2015, 19(1):116-125.
[
|
| [13] |
|
| [14] |
|
| [15] |
|
| [16] |
|
| [17] |
|
| [18] |
|
| [19] |
段佩祥, 钱海忠, 何海威, 等. 基于支持向量机的线化简方法[J]. 武汉大学学报·信息科学版, 2020, 45(5):744-752,783.
[
|
| [20] |
|
| [21] |
武芳, 邓红艳. 基于遗传算法的线要素自动化简模型[J]. 测绘学报, 2003, 32(4):349-355.
[
|
| [22] |
钱海忠, 何海威, 王骁, 等. 采用三元弯曲组划分的线要素化简方法[J]. 武汉大学学报·信息科学版, 2017, 42(8):1096-1103.
[
|
| [23] |
应申, 李霖. 基于约束点的曲线一致性化简[J]. 武汉大学学报·信息科学版, 2003, 28(4):488-491.
[
|
| [24] |
|
| [25] |
|
| [26] |
|
| [27] |
|
| [28] |
|
| [29] |
|
| [30] |
|
| [31] |
|
| [32] |
|
| [33] |
刘闯, 石瑞香, 张应华, 等. 基于Google Earth遥感影像全球多尺度海陆(岛)岸线数据集(2015)[J/DB/OL]. 全球变化数据仓储电子杂志(中英文), 2019.
[
|
/
| 〈 |
|
〉 |
