
Journal of Geo-information Science >
Integrating Human Mobility into the Epidemiological Models of COVID-19: Progress and Challenges
Received date: 2021-02-02
Request revised date: 2021-09-15
Online published: 2022-01-25
Supported by
National Key Research and Development Project, No(2019YFB2102500)
National Natural Science Foundation of China, No(41771441)
National Natural Science Foundation of China, No(41901391)
Major science and technology projects of Xinjiang Uygur Autonomous Region, No(2020A03004-4)
Natu-ral Science Foundation of Guangdong Province, No(2021A1515011191)
Fundamental Research Project of Shenzhen City, No(JCYJ20190807163001783)
Bill & Melinda Gates Foundation, No(INV-005834)
Copyright
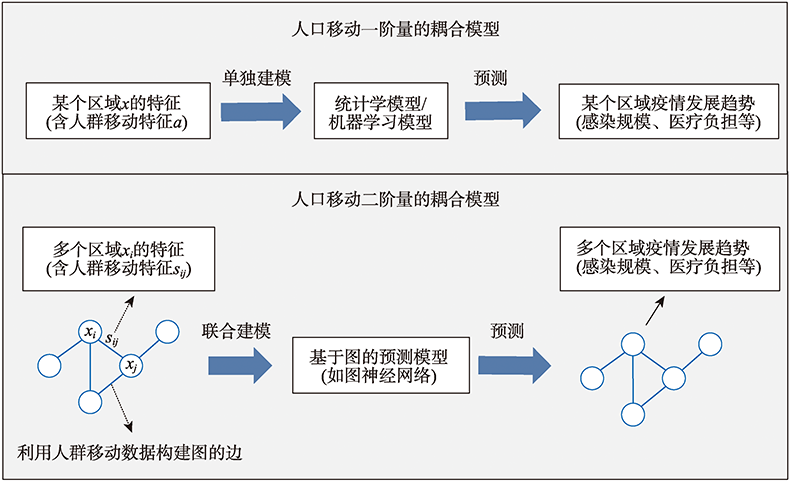
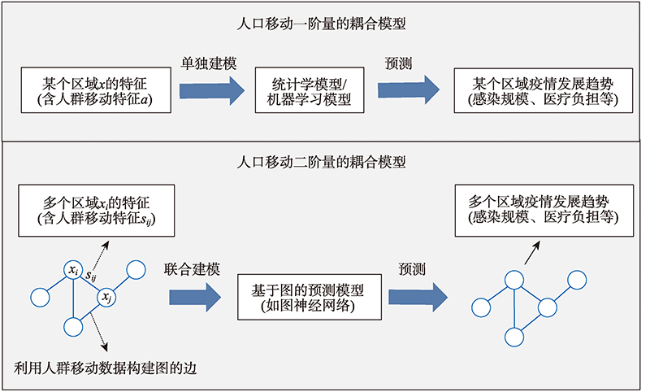
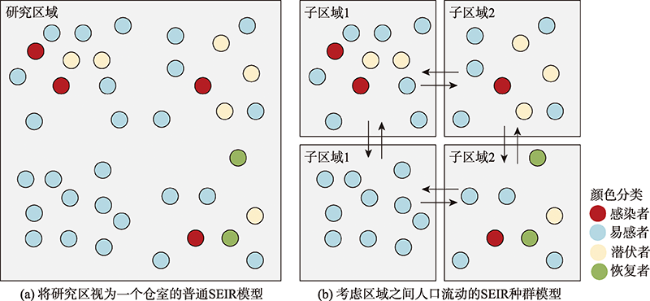
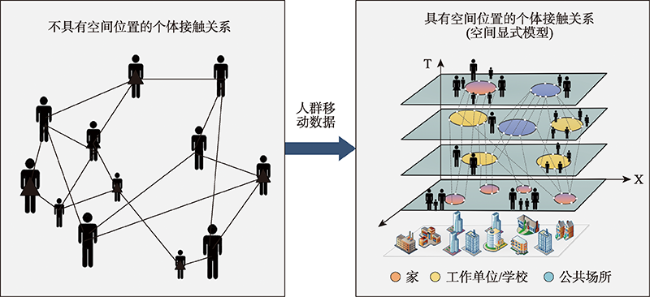
The spread of infectious diseases is usually a highly nonlinear space-time diffusion process. Epidemiological models can not only be used to predict the epidemic trend, but also be used to systematically and scientifically study the transmission mechanism of the complex processes under different hypothetical intervention scenarios, which provide crucial analytical and planning tools for public health studies and policy-making. Since host behavior is one of the critical driven factors for the dynamics of infectious diseases, it is important to effectively integrate human spatiotemporal behavior into the epidemiological models for human-hosted infectious diseases. Due to the rapid development of human mobility research and applications aided by big trajectory data, many of the epidemiological models for Coronavirus Disease 2019 (COVID-19) have already coupled human mobility. By incorporating real trajectory data such as mobile phone location data at an individual or aggregated level, researchers are working towards the direction of accurately depicting the real world, so as to improve the effectiveness of the model in guiding actual epidemic prevention and control. The epidemic trend prediction, Non-pharmaceutical Interventions (NPIs) evaluation, vaccination strategy design, and transmission driven factors have been studied by the epidemiological models coupled with human mobility, which provides scientific decision-making aid for controlling epidemic in different countries and regions. In order to systematically understand this important progress of epidemiological models, this study collected and summarized relevant literatures. First, the interactions between the COVID-19 epidemic and human mobility were analyzed, which demonstrated the necessity of integrating the complex spatiotemporal behavior, such as population-based or individual-based mobility, activity, and contact interaction, into the epidemiological models. Then, according to the modeling purpose and mechanism, the models integrated with human mobility were discussed by two types: short-term epidemic prediction models and process simulation models. Among them, based on the coupling methods of human mobility, short-term epidemic prediction models can further be divided into models coupled with first-order and second-order human mobility, while process simulation models can be divided into models coupled with population-based mobility and individual-based mobility. Finally, we concluded that epidemiological models integrating human mobility should be developed towards more complex human spatiotemporal behaviors with a fine spatial granularity. Besides, it is in urgent need to improve the model capability to better understand the disease spread processes over space and time, break through the bottleneck of the huge computational cost of fine-grained models, cooperate cutting-edge artificial intelligence approaches, and develop more universal and accessible modeling data sets and tools for general users.
YIN Ling , LIU Kang , ZHANG Hao , XI Guikai , LI Xuan , LI Ziyin , XUE Jianzhang . Integrating Human Mobility into the Epidemiological Models of COVID-19: Progress and Challenges[J]. Journal of Geo-information Science, 2021 , 23(11) : 1894 -1909 . DOI: 10.12082/dqxxkx.2021.210091
图1 面向疫情短期预测的人群移动耦合模型示意Fig. 1 Short-term epidemic prediction models coupled with human mobility |
表1 面向疫情短期预测的人群移动耦合模型相关研究Tab. 1 Related references of short-term epidemic prediction models coupled with human mobility |
| 分类 | 参考文献 | 模型 | 预测目标 | 预测的时间范围 | 研究区域 | 人群移动数据 | 评估指标 | 预测性能 |
|---|---|---|---|---|---|---|---|---|
| 人群移动一阶量 | [9] | 广义线性模型 | 每日COVID-19新增感染人数和累计感染人数 | 2020年2月1日—10日 | 中国的多个 省份 | 百度迁徙指数 | R2 | 预测截止至2020年2月10号(疫情初期)中国除武汉市外的累计病例数的R2为0.89 |
| [31] | 整合线性回归和自回归移动平均的预测模型 | 每日COVID-19输入性病例数 | 提前预测未来 12 d | 韩国的多个 省市 | 韩国电信的手机漫游数据 | 相关系数、均方根误差、平均绝对误差和平均相对误差 | 预测未来12 d后的新增输入病例人数时,该模型在第一个验证集(2020.03.28—04.30)的相关系数、均方根误差、平均绝对误差和平均相对误差分别为0.925、6.3、5.0和49.9%,在第二个验证集(2020.05.01-06.30)的相关系数、均方根误差、平均绝对误差和平均相对误差分别为0.798、4.1、2.8和22.3% | |
| [32] | 多元线性回归 模型 | 每日COVID-19新增感染人数 | 2020年2月1日—2月15日(列举了分别预测1~5 d的精度) | 中国的4个城市(深圳、广州、珠海和中山市) | 百度迁徙数据 | 平均绝对误差、均方根误差和R2 | 以深圳市和广州市这两个人口流动较为频繁的城市为例,预测深圳市未来1天新增感染人数的平均绝对误差、均方根误差和R2分别为7、7.234和0.988,广州市的平均绝对误差、均方根误差和R2则分别为6.067、6.434和0.985 | |
| [33] | 基于面板多元线性回归模型的行为模型和基于分布滞后模型的感染模型 | 每日COVID-19累计感染人数 | 提前预测未来1~10 d | 中国、美国、法国等80个国家的多种空间尺度(如,国家、省/州、市/县) | 谷歌社区移动性数据集、百度迁徙指数、SafeGraph社交距离指标、Facebook提供的网格间的人口移动次数 | 百分比误差的中位数(Median Percentage Error, MPE) | 以在粗粒度的空间尺度上预测未来1 d COVID-19的累计感染人数为例,全球的百分比误差中位数为0.9%,中国各省的百分比误差中位数为-0.2%,意大利各省的百分比误差中位数为0.89%,美国各州的百分比误差中位数为1.13% | |
| [34] | 贝叶斯网络 | 每日COVID-19新增死亡人数 | 2020年3月30日—4月19日(列举了每周的预测精度) | 意大利、西班牙等11个国家 | 谷歌社区移动性数据集 | 平均误差以及平均相对误差 | 预测未来1周的死亡人数时,11个国家平均误差绝对值的均值为60,平均相对误差绝对值的均值则为2.5% | |
| [35] | 融合弹性回归和主成分回归等多个模型的多层预测模型 | 每日COVID-19新增感染人数和累计感染人数 | 提前预测未来1、4和7 d的平均值 | 美国的多个县 | 谷歌社区移动性数据集 | 平均绝对误差、均方根误差和R2 | 预测未来1 d的新增感染人数时,R2、均方根误差和平均绝对误差分别为0.91、105和39;预测未来1 d的累计感染人数时,R2、均方根误差和平均绝对误差则分别为1.0、189和103 | |
| 人群移动二阶量 | [30] | 基于图的神经 网络 | 每日COVID-19新增感染人数 | 提前预测未来2、7、14、21和28d | 美国的多个州 | 谷歌COVID-19聚合移动研究数据集 | 均方根误差和皮尔斯相关系数 | 预测未来第2 d时,均方根误差和皮尔森相关系数分别为313和0.298 |
| [36] | 时空图神经网络 | 每日COVID-19新增感染人数 | 提前预测未来1d | 美国的多个县 | 谷歌社区移动性数据集和谷歌COVID-19聚合移动研究数据集 | 均方根对数误差和皮尔斯相关系数 | 预测未来1 d时,均方根对数误差和皮尔森相关系数分别为0.0109和0.9980 | |
| [37] | 时空注意力网络 | 每日COVID-19新增感染人数 | 提前预测未来5、15、20 d | 美国的多个州和多个县 | 通过重力模型计算的市/县和州之间的人群移动强度 | 平均绝对误差、均方误差和一致性相关系数 | 预测未来第5 d时,美国州级别的均方误差、平均绝对误差和一致性相关系数分别为237 412、220.5和0.84,美国县级别的均方误差、平均绝对误差和一致性相关系数分别为44177、79.8和0.66 |
表2 基于过程模拟的人群移动耦合模型相关研究Tab. 2 Related references of process simulation models coupled with human mobility |
| 分类 | 文献 | 研究区域 | 人群移动数据 | 模型模拟的干预措施 | 病例真实值 | 病例模拟值 | 模型效果 |
|---|---|---|---|---|---|---|---|
| 群体级别 | [47] | 意大利 | 人口流量调查 | 严格管控出行活动、加大疫情排查力度 | 74 386 | 约733 000 | 模拟的疾病发展曲线与实际情况吻符合程度较高 |
| [9] | 武汉 | 百度实时流动性数据 | - | 554 | 632 | 累计病例数的R2=0.99 | |
| [45] | 中国375个城市 | 腾讯位置服务人口实时流动性数据 | 佩戴口罩、社交疏离、自我 隔离 | 13 562 | 约1.2万 | 预测的疾病报告率为14%,与实际武汉市疾病报告率15.8%非常接近 | |
| [15] | 中国340个城市 | 百度迁徙人口流动数据 | 综合性非药物性干预 | 79 824 | 114 325 | 全国累计病例的R2=0.86,P值<0.001 | |
| [21] | 中国 | 手机实时移动性和社交联系数据、腾讯移动设 备数据集 | 疫苗接种、社交疏离 | 未使用真实数据 | 未给出具体值 | 严格的干预措施可大幅降低传播能力 | |
| [13] | 深圳市 | 手机移动信令数据 | 降低出行量、区域封锁 | 未使用真实数据 | R0=2.5时,峰值病例数减少了33% | 模拟的疾病发展曲线与实际情况吻合程度较高 | |
| [14] | 美国康涅狄格州 | 城镇级人口流动数据, 智能手机热图,空中交 通流量 | 社交疏离 | 47 510 | 45 752~48 105 | 对康涅狄格州所有城镇模拟,实际统计的病例R2在0.907~0.924;按类别对城镇进行模拟,实际统计的病例R2为0.978~0.987 | |
| [49] | 全球 | 航空与地面交通数据 | 降低本地传播率和国际旅行 | 未使用真实数据 | 未给出具体模拟值 | 严格的干预措施可大幅降低传播能力 | |
| 个体级别 | [60] | 新加坡 | 交通数据 | 隔离感染者、关闭学校和工作场所 | 未使用真实数据 | R0=1.5时,7.4%的总人口感染;R0=2.0时,19.3%的总人口感染;R0=2.5时,32%的总人口感染 | 未给出具体评价指标 |
| [61] | 波士顿 | 手机位置数据 | 检测、密接追踪、居家隔离 | 未使用真实数据 | 无干预场景75%的人口被感染 | 未给出具体评价指标 | |
| [62] | 纽约、西雅图 | 手机位置数据 | 无干预措施 | 每天每千人的死亡人数(未给出具体值) | 每天每千人的死亡人数(未给出具体值) | 模型结果与真实死亡人数的拟合效果较好,二者到达峰值的时间差略大于5 d | |
| [63] | 澳大利亚 | 人口通勤数据 | 国际航空旅行限制、隔离感染者、居家隔离、增大社交距离、关闭学校 | 未使用真实数据 | 最佳干预场景下有8千~1万人被感染 | 未给出具体评价指标 | |
| [64] | 深圳市 | 手机信令数据 | 密接追踪、及时检测、佩戴口罩、封城、逐步复工、隔离综合措施 | 418 | 416 | 每日新增发病数量的模拟值与实际报告值的RMSE=1.354;显性感染者数量在城市内各个行政区尺度上的R2=0.95 |
| [1] |
裴韬, 王席, 宋辞, 等. COVID-19疫情时空分析与建模研究进展[J]. 地球信息科学学报, 2021, 23(2):188-210.
[
|
| [2] |
|
| [3] |
|
| [4] |
|
| [5] |
陆锋, 刘康, 陈洁. 大数据时代的人类移动性研究[J]. 地球信息科学学报, 2014, 16(5):665-672.
[
|
| [6] |
|
| [7] |
|
| [8] |
|
| [9] |
|
| [10] |
|
| [11] |
|
| [12] |
|
| [13] |
|
| [14] |
|
| [15] |
|
| [16] |
|
| [17] |
|
| [18] |
|
| [19] |
|
| [20] |
|
| [21] |
|
| [22] |
|
| [23] |
|
| [24] |
|
| [25] |
|
| [26] |
|
| [27] |
|
| [28] |
|
| [29] |
|
| [30] |
|
| [31] |
|
| [32] |
|
| [33] |
|
| [34] |
|
| [35] |
|
| [36] |
|
| [37] |
|
| [38] |
|
| [39] |
|
| [40] |
王玉, 陈姗姗, 傅新楚. 传播动力学模型回顾与展望[J]. 应用数学与计算数学学报, 2018, 32(2):267-294.
[
|
| [41] |
|
| [42] |
|
| [43] |
|
| [44] |
|
| [45] |
洪航, 史宏博, 姜海波, 等. 基于传染病动力学模型的宁波市新型冠状病毒肺炎防控措施效果评估[J]. 中华流行病学杂志, 2020, 41(10):1606-1610.
[
|
| [46] |
|
| [47] |
|
| [48] |
|
| [49] |
|
| [50] |
|
| [51] |
|
| [52] |
|
| [53] |
徐展凯, 徐致靖, 祖正虎, 等. 基于个体的传染病传播模型应用[J]. 生物技术通讯, 2015, 26(1):46-50.
[
|
| [54] |
|
| [55] |
|
| [56] |
|
| [57] |
|
| [58] |
|
| [59] |
|
| [60] |
|
| [61] |
|
| [62] |
|
| [63] |
|
| [64] |
|
| [65] |
张浩, 尹凌, 刘康, 等. 深圳市快速抑制COVID-19疫情的非药物干预措施效果评估:基于智能体的建模研究[J]. 地球信息科学学报, 2021:1-10.
[
|
| [66] |
|
| [67] |
|
| [68] |
|
| [69] |
|
| [70] |
|
| [71] |
|
| [72] |
|
| [73] |
詹思延, 叶冬青, 谭红专. 流行病学(第7版)[M]. 北京: 人民卫生出版社, 2013.
[
|
/
| 〈 |
|
〉 |