
Journal of Geo-information Science >
An Epidemic Spread Risk Prediction Model Coupled with LSTM Algorithm and Cloud Model
Received date: 2021-09-25
Request revised date: 2021-11-09
Online published: 2022-01-25
Supported by
National Natural Science Foundation of China, No(41906185)
National Natural Science Foundation of China, No(U1706226)
National Natural Science Foundation of China, No(52071307)
Copyright
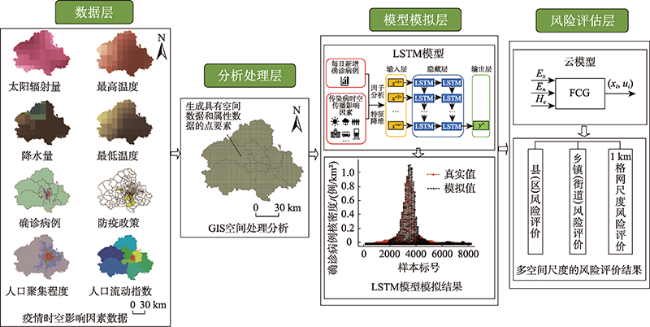
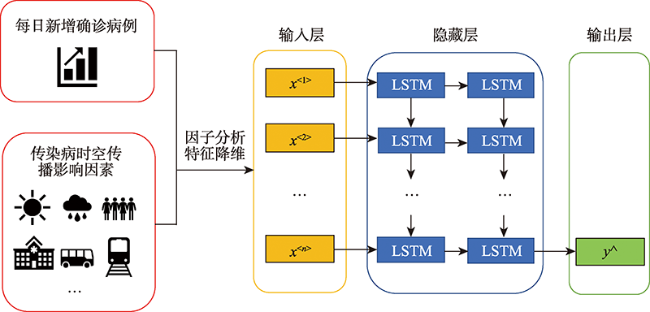
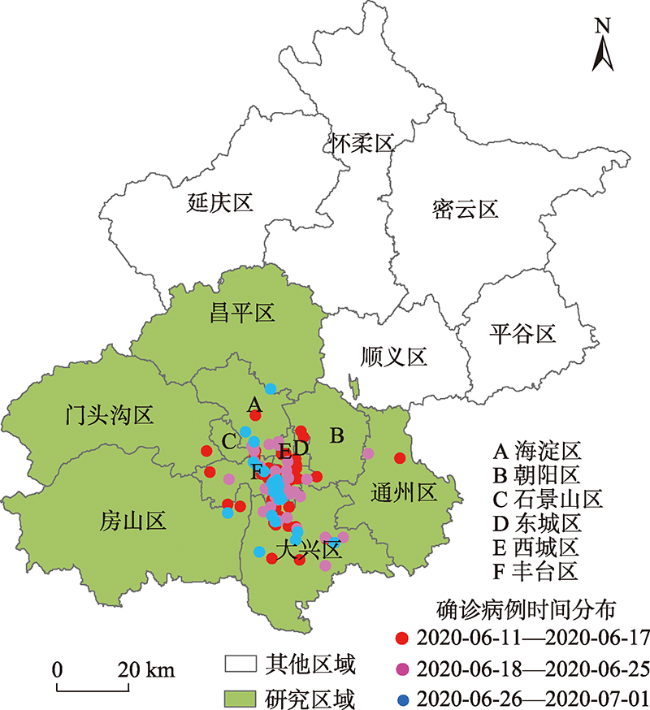
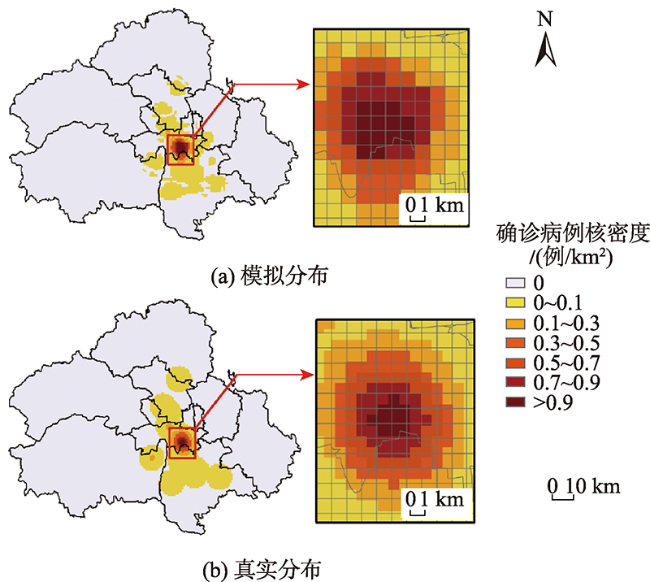
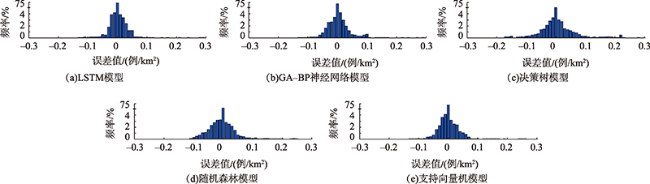
The COVID-19 epidemic poses a great threat to public health and people's lives, which has initiated new challenges to the prevention and control system of the epidemic in China. In all efforts for epidemic control and prevention, predicting the risk of epidemic spread is of great practical importance for scientific prevention and control, and precise strategies. To predict the risk of an epidemic rapidly and quantitatively, this paper fused multi-source spatiotemporal data and established a risk prediction model for epidemic transmission by coupling LSTM algorithm and cloud model. Firstly, a simulation model of the spatiotemporal spread of infectious diseases was built based on GIS and LSTM algorithm, which simulated the infectious disease's spatiotemporal transmission process by learning rules in historical epidemic data. At the same time, to improve the simulation accuracy, this paper took 1 km × 1 km for the spatial scale, and days for the temporal scale as the study scale. Secondly, this paper applied the simulated data of infectious cases and the spatiotemporal influence factors on the spread of the epidemic to construct risk evaluation indicators. Finally, the cloud model and adaptive strategies were applied to construct an epidemic risk assessment model. In this way, the epidemic risk assessment at multiple spatial scales was achieved. In the empirical study phase, based on the Beijing COVID-19 epidemic data from 11 June 2020 to 25 June 2020, this paper simulated the process of the spatial evolution of the epidemic from 26 June 2020 to 1 July 2020. To test the advantage of the LSTM model applied to simulate spatiotemporal spread of infectious diseases, four machine learning models were introduced for comparison, including GA-BP Neural Network, Decision Regression Tree, Random Forest, and Support Vector Machine. The results were as follows: ① Compared with other conventional machine learning models, the LSTM model with time-series relationship had higher simulation accuracy (MAE=0.002 61) and better fitting degree (R-Square=0.9455). This showed that the LSTM model considering the temporal relationship between epidemic data was more suitable for epidemic spatial evolution simulation. ② The application results showed that the coupled model can not only fully consider the influence of infection source factors, weather factors, epidemic spread factors and epidemic prevention factors on the spread of transmission risk and reflect the trend of risk evolution, but also quickly quantify regional risk levels. Therefore, the coupled model based on LSTM algorithm and cloud model can effectively predict the transmission risk of epidemic, and also provide a method reference for establishing spatial-temporal transmission models and assessing epidemic risk.

LI Zhao , GAO Huiying , DAI Xiaoyi , SUN Hai . An Epidemic Spread Risk Prediction Model Coupled with LSTM Algorithm and Cloud Model[J]. Journal of Geo-information Science, 2021 , 23(11) : 1924 -1925 . DOI: 10.12082/dqxxkx.2021.210576
表1 疫情风险评价指标Tab. 1 Epidemic risk assessment index |
| 一级指标 | 二级指标 |
|---|---|
| 传染源因素A | 模拟新增确诊病例核密度A1 |
| 天气因素B | 2 m处最高温度B1 |
| 2 m处最低温度B2 | |
| 总降水量B3 | |
| 总天空直接太阳辐射量B4 | |
| 疫情防御因素C | 防疫政策C1 |
| 疫情扩散因素D | 人口聚集程度D1 |
| 人口流动指数D2 |
表2 实验数据Tab. 2 Experimental data |
| 影响因素 | 基础数据 | 来源 | 数据类型 |
|---|---|---|---|
| 疫情 | 新增确诊病例(2020-06-11—2020-07-01,共309条) | 北京卫健委 | 矢量(点) |
| 天气 | 2 m处最高温度数据、2 m处最低温度数据、总降水量数据、总天空直接太阳辐射量数据 | 欧洲气象中心发布的ERA5资料[35] | 0.125°分辨率栅格 |
| 人口流动 | 基于微博签到数据的区人口流动指数[36](2020-06-11-2020-07-01) | 新浪微博发布的位置信息 | 矢量(面) |
| 人口聚集 | 百度热力图(2020-06-11—2020-07-01) | 百度地图APP | 1 km×1 km栅格 |
| 政策 | 乡镇(街道)区域风险等级 | 北京卫健委、北京市疾病预防控制中心 | 矢量(面) |
表3 隐藏层调整的模拟结果Tab. 3 Simulation results of hidden layer adjustment |
| 隐藏层神 经元个数 | MAE (6-25—6-28) | MAE (6-29—7-1) | MAE 合计 |
|---|---|---|---|
| 3 | 0.002 06 | 0.001 65 | 0.003 71 |
| 4 | 0.002 14 | 0.001 54 | 0.003 68 |
| 5 | 0.002 12 | 0.001 69 | 0.003 81 |
| 6 | 0.002 05 | 0.001 31 | 0.003 36 |
| 7 | 0.001 86 | 0.001 23 | 0.003 09 |
| 8 | 0.001 85 | 0.001 02 | 0.002 87 |
| 9 | 0.001 83 | 0.001 13 | 0.002 96 |
| 10 | 0.001 91 | 0.001 27 | 0.003 18 |
| 11 | 0.002 12 | 0.001 22 | 0.003 34 |
| 12 | 0.002 05 | 0.001 17 | 0.003 22 |
表4 模型深度调整的模拟结果Tab. 4 Simulation results of model depth adjustment |
| 层数 | MAE | R-square |
|---|---|---|
| 1 | 0.00287 | 0.9391 |
| 2 | 0.00261 | 0.9455 |
| 3 | 0.00314 | 0.9361 |
| 4 | 0.00353 | 0.9206 |
| 5 | 0.00374 | 0.9132 |
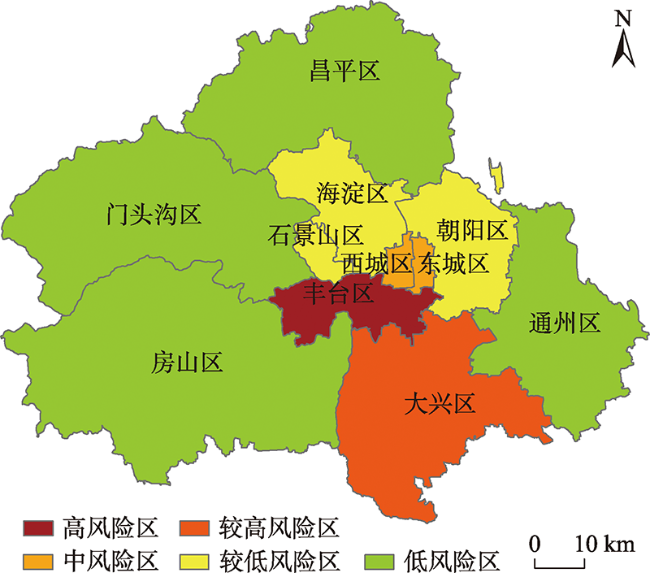
图6 北京市含确诊病例县(区)风险评价结果Fig. 6 Risk assessment results of counties (districts) with confirmed cases in Beijing |
表6 云模型的计算参数矩阵Tab. 6 Calculation parameter matrix of cloud model |
| 指标 | 低风险 | 较低风险 | 中风险 | 较高风险 | 高风险 |
|---|---|---|---|---|---|
| A1 | (0.0005, 0.0003, 0.1) | (0.0030, 0.0013, 0.1) | (0.0065, 0.0010, 0.1) | (0.0540, 0.0307, 0.1) | (0.1100, 0.0067, 0.1) |
| B1 | (146.42, 97.61, 0.1) | (293.97, 0.76, 0.1) | (296.08, 0.65, 0.1) | (298.14, 0.72, 0.1) | (300.15, 0.62, 0.1) |
| B2 | (144.63, 96.42, 0.01) | (290.35, 0.72, 0.01) | (292.29, 0.57, 0.01) | (294.10, 0.64, 0.01) | (295.83, 0.52, 0.01) |
| B3 | (0.0008, 0.0005, 0.1) | (0.0020, 0.0002, 0.1) | (0.0029, 0.0003, 0.1) | (0.0041, 0.0004, 0.1) | (0.005 9, 0.000 8, 0.1) |
| B4 | (1 288 026, 858 684,0.1) | (2 691 607, 77037, 0.1) | (2 902 592, 63620, 0.1) | (3120 919, 81 931, 0.1) | (3 379 396, 90 387, 0.1) |
| C1 | (0.1500, 0.1000, 0.01) | (0.4000, 0.0667, 0.01) | (0.6000, 0.0667, 0.01) | (0.7500, 0.0333, 0.01) | (0.850 0, 0.0333, 0.01) |
| D1 | (0.5000, 0.3333, 0.01) | (1.5000, 0.3333, 0.01) | (2.5000, 0.3333, 0.01) | (4.0000, 0.6667, 0.01) | (6.000 0, 0.6667, 0.01) |
| D2 | (0.4409, 0.2940, 0.01) | (1.5724, 0.4603, 0.01) | (3.1944, 0.6210, 0.01) | (5.3173, 0.7942, 0.01) | (8.2675, 1.1726, 0.01) |
| [1] |
|
| [2] |
裴韬, 王席, 宋辞, 等. COVID-19疫情时空分析与建模研究进展[J]. 地球信息科学学报, 2021, 23(2):188-210.
[
|
| [3] |
|
| [4] |
|
| [5] |
|
| [6] |
|
| [7] |
|
| [8] |
毕佳, 王贤敏, 胡跃译, 等. 一种基于改进SEIR模型的突发公共卫生事件风险动态评估与预测方法—以欧洲十国COVID-19为例[J]. 地球信息科学学报, 2021, 23(2):259-273.
[
|
| [9] |
夏吉喆, 周颖, 李珍, 等. 城市时空大数据驱动的新型冠状病毒传播风险评估——以粤港澳大湾区为例[J]. 测绘学报, 2020, 49(6):671-680.
[
|
| [10] |
冯明翔, 方志祥, 路雄博, 等. 交通分析区尺度上的新型冠状病毒肺炎时空扩散推估方法:以武汉市为例[J]. 武汉大学学报·信息科学版, 2020, 45(5):651-657,681.
[
|
| [11] |
|
| [12] |
|
| [13] |
|
| [14] |
|
| [15] |
|
| [16] |
|
| [17] |
|
| [18] |
|
| [19] |
|
| [20] |
任红艳, 吴伟, 李乔玄, 等. 基于反向传播神经网络模型的广东省登革热疫情预测研究[J]. 中国媒介生物学及控制杂志, 2018, 29(3):221-225.
[
|
| [21] |
李卫红, 陈业滨, 闻磊. 基于GA-BP神经网络模型的登革热时空扩散模拟[J]. 中国图象图形学报, 2015, 20(7):981-991.
[
|
| [22] |
陈业滨, 李卫红. 支持向量机模型的登革热时空扩散预测[J]. 测绘科学, 2017, 42(2):65-70.
[
|
| [23] |
|
| [24] |
|
| [25] |
|
| [26] |
宋关福, 陈勇, 罗强, 等. GIS基础软件技术体系发展及展望[J]. 地球信息科学学报, 2021, 23(1):2-15.
[
|
| [27] |
|
| [28] |
王鑫, 吴际, 刘超, 等. 基于LSTM循环神经网络的故障时间序列预测[J]. 北京航空航天大学学报, 2018, 44(4):772-784.
[
|
| [29] |
|
| [30] |
|
| [31] |
|
| [32] |
|
| [33] |
|
| [34] |
|
| [35] |
Copernicus Climate Change Service (C3S)[DB/OL]. https://cds.climate.copernicus.eu/cdsapp#!/dataset/reanalysis-era5-single-levels?tab=form.
|
| [36] |
潘碧麟, 王江浩, 葛咏, 等. 基于微博签到数据的成渝城市群空间结构及其城际人口流动研究[J]. 地球信息科学学报, 2019, 21(1):68-76.
[
|
/
| 〈 |
|
〉 |