
Journal of Geo-information Science >
The Temporal Influence Difference of Drug-related Personnels' Routine Activity on the Spatial Pattern of Theft
Received date: 2021-02-05
Request revised date: 2021-03-18
Online published: 2022-02-25
Supported by
National Natural Science Foundation of China(41901177)
National Natural Science Foundation of China(42001171)
National Natural Science Foundation of China(42071184)
Natural Science Foundation of Guangdong Province, China(2019A1515011065)
Key Project of Science and Technology Program of Guangzhou City, China(201804020016)
Copyright
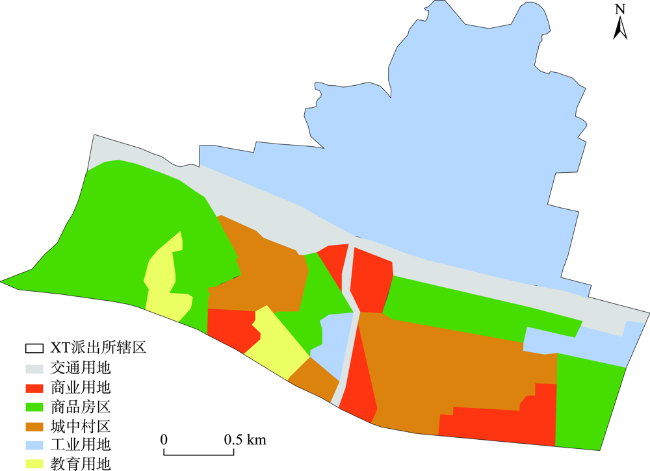
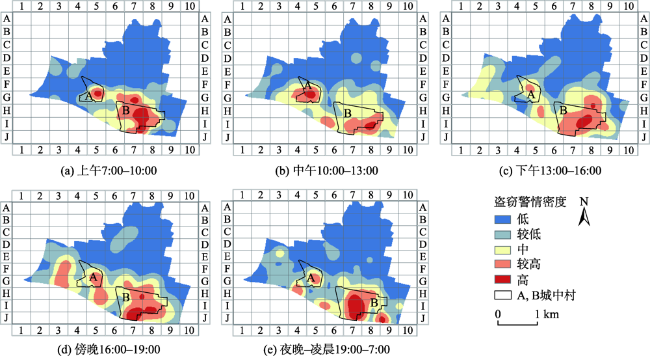
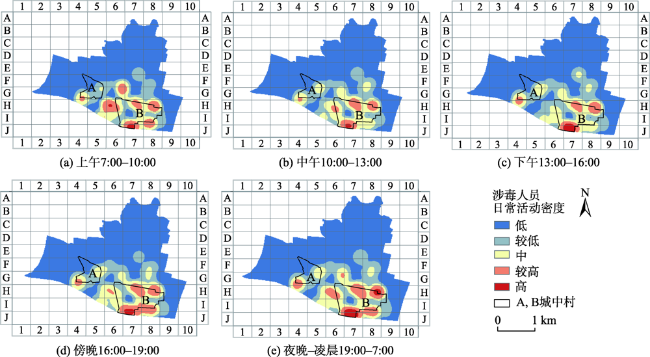
According to the routine activity theory, the spatiotemporal pattern of crime is strongly related to routine activity of victims and offenders. However, due to the difficulty of data acquisition, there is a lack of research on offenders' routine activity and the spatiotemporal pattern of crime events. The existing literature shows that there is a great correlation between drug-related persons and property crimes such as theft. Based on this, this study verifies the role of the routine activity of offenders in shaping the spatial-temporal pattern of theft through analyzing the impact of the routine activity of drug-related persons on theft. In this paper, taking XT police district with 150 m×150 m grids in ZG city in southern China as an example, the theft data, routine activity data of drug-related persons, POI data, and patrol and interrogation data were used. Poisson regression models were established respectively in different periods. The results show that, firstly, compared with traditional static arrest or policing events data, active routine activity data of potential offenders and victims could promote goodness of fit in models effectively. Secondly, compared with total amount of people in whole day, active real-time activity data of drug-related personnel and residents could explain the spatial pattern of theft better. Thirdly, static land use density has a different influence on theft events in different periods. The above results verify the relationship between the routine activity of drug-related persons and the spatiotemporal pattern of theft. The research conclusions verify and enrich the routine activity theory, which can provide a certain reference for the actual crime prediction and police deployment.
LIU Lin , SUN Qiuyuan , XIAO Luzi , SONG Guangwen , CHEN Jianguo . The Temporal Influence Difference of Drug-related Personnels' Routine Activity on the Spatial Pattern of Theft[J]. Journal of Geo-information Science, 2021 , 23(12) : 2187 -2200 . DOI: 10.12082/dqxxkx.2021.210069
表1 各变量名称及其含义Tab. 1 Name and meaning of each variable |
| 变量类型 | 变量名称 | 计算方法 |
|---|---|---|
| 因变量 | 盗窃警情 | 将2018年的盗窃警情地址通过地理编码生成坐标落点至XT派出所内382个网格中,统计各网格内警情数目 |
| 潜在犯罪者 | 涉毒人员日常活动 | 对于移动基站估算各个网格人口数据的方法[24],本文根据94个摄像头的点坐标(其中4个摄像头坐标与其他摄像头位置完全重叠)建立90个泰森多边形,通过泰森多边形与研究区382个网格进行叠置,根据叠置后的面积占比统计各个网格内涉毒人员活动人次,从而将摄像头识别的涉毒人员日常活动信息较好地分配至研究区内所有网格 |
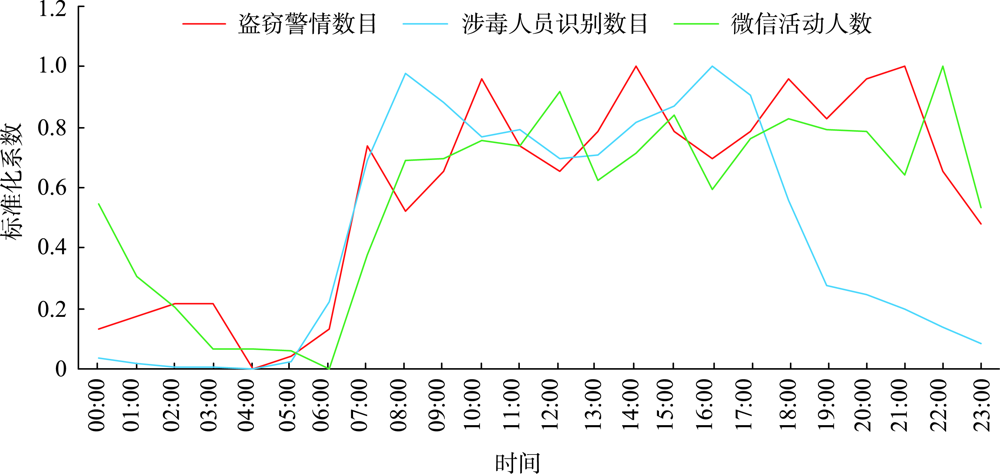
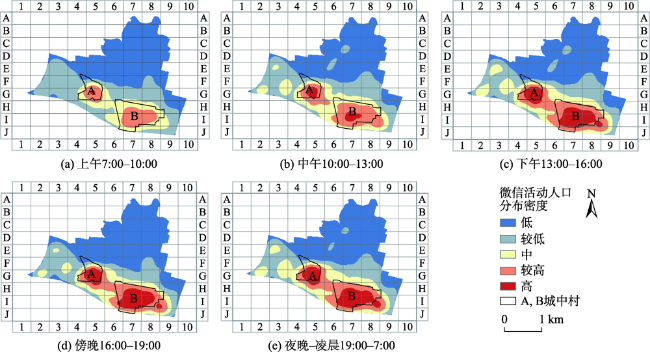
| 潜在受害者 | 微信活动人口 | 根据微信活动人口数据计算各个时段网格内活动人口数目 |
| 监管因素 | 巡逻盘查点 | 用0或1表示各个时段网格内是否有民警巡逻盘查 |
| 建成环境 | 土地利用混合度 | 根据POI数据通过信息熵公式计算网格内土地利用混合度 |
| 公交车站 | 各网格内公交车站POI的个数 | |
| 休闲娱乐设施 | 各网格内休闲娱乐设施POI的个数 | |
| 农贸批发市场 | 各网格内农贸批发市场POI的个数 | |
| 购物设施 | 各网格内购物设施POI的个数 |
表2 变量的描述性统计Tab. 2 Descriptive statistics of dependent and independent variables |
| 变量 | 平均值 | 方差 | 最小值 | 最大值 | |
|---|---|---|---|---|---|
| 盗窃警情/起 | 07:00—10:00 | 0.141 | 0.206 | 0 | 4 |
| 10:00—13:00 | 0.178 | 0.252 | 0 | 4 | |
| 13:00—16:00 | 0.194 | 0.252 | 0 | 3 | |
| 16:00—19:00 | 0.181 | 0.269 | 0 | 4 | |
| 07:00—19:00 | 0.694 | 1.751 | 0 | 8 | |
| 19:00—07:00 | 0.432 | 1.222 | 0 | 10 | |
| 涉毒人员日常活动/百人次 | 07:00—10:00 | 0.213 | 0.171 | 0 | 3.958 |
| 10:00—13:00 | 0.188 | 0.109 | 0 | 1.946 | |
| 13:00—16:00 | 0.200 | 0.144 | 0 | 2.538 | |
| 16:00—19:00 | 0.205 | 0.128 | 0 | 1.833 | |
| 07:00—19:00 | 0.806 | 2.007 | 0 | 9.675 | |
| 19:00—07:00 | - | - | - | - | |
| 微信居民活动/千人次 | 07:00—10:00 | 0.398 | 0.232 | 0 | 2.481 |
| 10:00—13:00 | 0.517 | 0.366 | 0 | 2.908 | |
| 13:00—16:00 | 0.495 | 0.336 | 0 | 2.705 | |
| 16:00—19:00 | 0.523 | 0.361 | 0 | 2.585 | |
| 07:00—19:00 | 1.933 | 5.072 | 0 | 10.650 | |
| 19:00—07:00 | 1.267 | 2.787 | 0 | 8.747 | |
| 巡逻盘查点(0或1) | 07:00—10:00 | 0.377 | 0.235 | 0 | 1 |
| 10:00—13:00 | 0.518 | 0.250 | 0 | 1 | |
| 13:00—16:00 | 0.508 | 0.251 | 0 | 1 | |
| 16:00—19:00 | 0.476 | 0.250 | 0 | 1 | |
| 07:00—19:00 | 0.652 | 0.228 | 0 | 1 | |
| 19:00—07:00 | 0.545 | 0.249 | 0 | 1 | |
| 土地利用混合度 | 0.029 | 0.0005 | 0 | 0.124 | |
| 公交车站/个 | 0.154 | 0.341 | 0 | 5 | |
| 休闲娱乐设施/个 | 0.236 | 0.622 | 0 | 10 | |
| 农贸批发市场/个 | 0.325 | 1.180 | 0 | 8 | |
| 购物设施/个 | 0.387 | 1.267 | 0 | 12 | |
表3 不同时段盗窃警情泊松回归模型结果Tab. 3 Poisson regression model for different time periods of theft |
| 变量 | 静态数据 (00:00—12:00 ) | 活动数据 (00:00—12:00) | 白天 (7:00—19:00 ) | 夜晚-凌晨 (19:00 —7:00) | 上午 (7:00—10:00) | 中午 (10:00 —13:00) | 下午 (13:00 —16:00) | 傍晚 (16:00—19:00) | ||||||||
|---|---|---|---|---|---|---|---|---|---|---|---|---|---|---|---|---|
| IRR | beta | IRR | beta | IRR | beta | IRR | beta | IRR | beta | IRR | beta | IRR | beta | IRR | beta | |
| 涉毒人员日常活动/百人 | 1.183 | 0.168*** | 1.205 | 0.187*** | 1.134 | 0.126** | 1.229 | 0.206** | 1.161 | 0.149* | 1.140 | 0.131* | 1.237 | 0.212** | ||
| 微信活动人口/千人 | 1.739 | 0.553*** | 1.708 | 0.536*** | 1.706 | 0.534*** | 1.981 | 0.684*** | 1.811 | 0.594*** | 1.644 | 0.497*** | 1.480 | 0.392*** | ||
| 有无民警盘查 | 4.684 | 1.544*** | 4.733 | 1.555*** | 3.248 | 1.178*** | 2.572 | 0.945*** | 1.398 | 0.335* | 1.339 | 0.292 | 2.603 | 0.957*** | 1.937 | 0.661*** |
| 土地利用混合度 | 1.264 | 0.234*** | 1.201 | 0.183*** | 1.023 | 0.023 | 1.475 | 0.388*** | 1.195 | 0.178 | 0.975 | -0.025 | 1.047 | 0.046 | 1.024 | 0.024 |
| 公交站点/个 | 1.004 | 0.004 | 1.028 | 0.028 | 1.024 | 0.024 | 1.039 | 0.039 | 1.092 | 0.088 | 0.995 | -0.005 | 0.994 | -0.006 | 1.062 | 0.060 |
| 休闲娱乐设施/个 | 1.028 | 0.028 | 1.017 | 0.017 | 1.019 | 0.019 | 1.000 | 0.000 | 0.858 | -0.154 | 1.124 | 0.117 | 1.053 | 0.051 | 0.939 | -0.063 |
| 农贸批发市场/个 | 1.035 | 0.034 | 1.025 | 0.024 | 1.016 | 0.016 | 1.015 | 0.015 | 1.023 | 0.023 | 0.976 | -0.025 | 1.003 | 0.003 | 1.059 | 0.058 |
| 购物设施/个 | 1.029 | 0.029 | 0.992 | -0.008 | 1.034 | 0.033 | 0.913 | -0.091 | 1.123 | 0.116 | 0.980 | -0.020 | 1.026 | 0.026 | 1.117 | 0.110 |
| 历史毒品交易点/个 | 1.097 | 0.093*** | ||||||||||||||
| 居民数目/千人 | 1.952 | 0.669*** | ||||||||||||||
| 常量 | 0.307 | -1.182*** | 0.311 | -1.168*** | 0.248 | -1.392*** | 0.146 | -1.926*** | 0.063 | -2.764*** | 0.109 | -2.217*** | 0.077 | -2.558*** | 0.090 | -2.411*** |
| 最大VIF值 | 1.87 | 1.92 | 1.97 | 1.47 | 1.39 | 1.45 | 1.46 | 1.56 | ||||||||
| AIC | 937.728 | 868.933 | 674.285 | 526.006 | 262.504 | 339.825 | 326.459 | 331.422 | ||||||||
| BIC | 973.237 | 904.442 | 709.794 | 561.514 | 298.013 | 375.334 | 361.968 | 366.931 | ||||||||
注: ***P < 0.01, ** P< 0.05, * P< 0.1, IRR为发生率比,beta为标准化系数。 |
| [1] |
肖露子. 入室盗窃者作案地选择的空间特征及其影响因素[D]. 广州:中山大学, 2018.
[
|
| [2] |
张维. 吸毒人员基本特征实证研究——以社会预防为视角[J]. 法学杂志, 2018, 39(8):134-140.
[
|
| [3] |
马誉宁. 吸毒人员侵财案件侦控对策研究[D]. 北京:中国人民公安大学, 2017.
[
|
| [4] |
朱飞, 李永升. 有组织犯罪与毒品犯罪的共生模式[J]. 吉首大学学报(社会科学版), 2010, 31(2):142-145.
[
|
| [5] |
|
| [6] |
姚桂华. 论毒品违法犯罪与其他刑事犯罪的关联性——以长沙市天心区法院判决资料为样本[D]. 湘潭:湘潭大学, 2004.
[
|
| [7] |
|
| [8] |
|
| [9] |
龙冬平, 柳林, 陈建国, 等. 街头抢劫者前犯罪经历对其后作案地选择的影响[J]. 地理科学进展, 2020, 39(5):815-828.
[
|
| [10] |
|
| [11] |
|
| [12] |
|
| [13] |
|
| [14] |
|
| [15] |
|
| [16] |
|
| [17] |
|
| [18] |
|
| [19] |
|
| [20] |
刘大千, 宋伟, 修春亮. 长春市“两抢两盗”犯罪的空间分析[J]. 地理科学, 2014, 34(11):1344-1352.
[
|
| [21] |
毛媛媛, 丁家骏. 抢劫与抢夺犯罪行为时空分布特征研究——以上海市浦东新区为例[J]. 人文地理, 2014, 29(1):49-54.
[
|
| [22] |
柳林, 梁斯毅, 宋广文. 基于潜在受害者动态时空分布的街面接触型犯罪研究[J]. 地球信息科学学报, 2020, 22(4):887-897.
[
|
| [23] |
柳林, 纪佳楷, 宋广文, 等. 基于犯罪空间分异和建成环境的公共场所侵财犯罪热点预测[J]. 地球信息科学学报, 2019, 21(11):1655-1668.
[
|
| [24] |
|
| [25] |
|
| [26] |
|
| [27] |
|
| [28] |
肖露子, 柳林, 周素红, 等. ZG市工作日地铁站点扒窃案件的时空分布及其影响因素[J]. 地理科学, 2018, 38(8):1227-1234.
[
|
| [29] |
宋广文, 肖露子, 周素红, 等. 居民日常活动对扒窃警情时空格局的影响[J]. 地理学报, 2017, 72(2):356-367.
[
|
| [30] |
高枫, 李少英, 吴志峰, 等. 广州市主城区共享单车骑行目的地时空特征与影响因素[J]. 地理研究, 2019, 38(12):2859-2872.
[
|
| [31] |
|
| [32] |
徐冲, 柳林, 周素红, 等. 微观空间因素对街头抢劫影响的空间异质性——以DP半岛为例[J]. 地理研究, 2017, 36(12):2492-2504.
[
|
| [33] |
|
| [34] |
|
| [35] |
陈强. 高级计量经济学及Stata应用[M]. 北京: 高等教育出版社, 2010.
[
|
| [36] |
|
| [37] |
|
| [38] |
陈鹏, 李欣, 胡啸峰, 等. 北京市长安街沿线的扒窃案件高发区分析及防控对策[J]. 地理科学进展, 2015, 34(10):1250-1258.
[
|
/
| 〈 |
|
〉 |
