
Journal of Geo-information Science >
Mapping and Spatio-temporal Changes Analysis of Energy Mining and Producing Sites in China Using Multi-source Data from 1990 to 2020
Received date: 2021-09-25
Revised date: 2021-11-12
Online published: 2022-03-25
Supported by
National Key Research and Development Program of China(2018YFC1800103)
National Key Research and Development Program of China(2018YFC1800106)
National Key Research and Development Program of China(2018YFC1800102)
Strategic Priority Research Program(A) of Chinese Academy of Sciences(XDA23100201)
Copyright
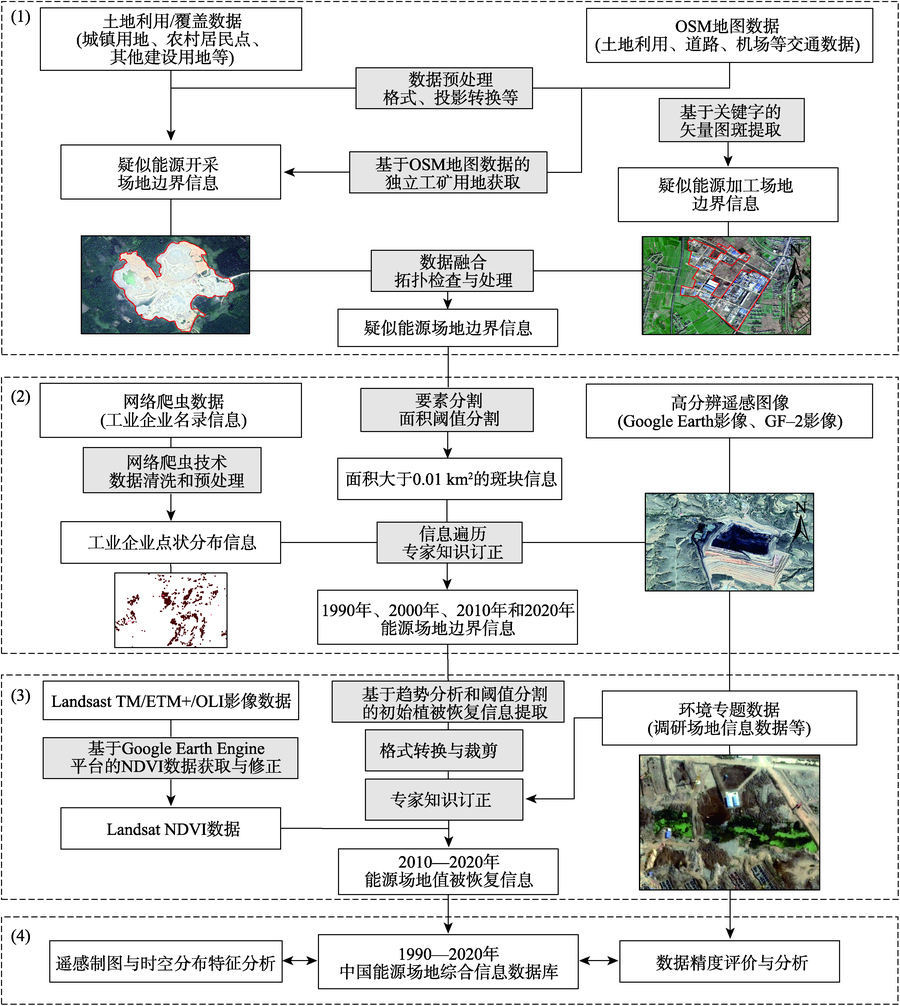
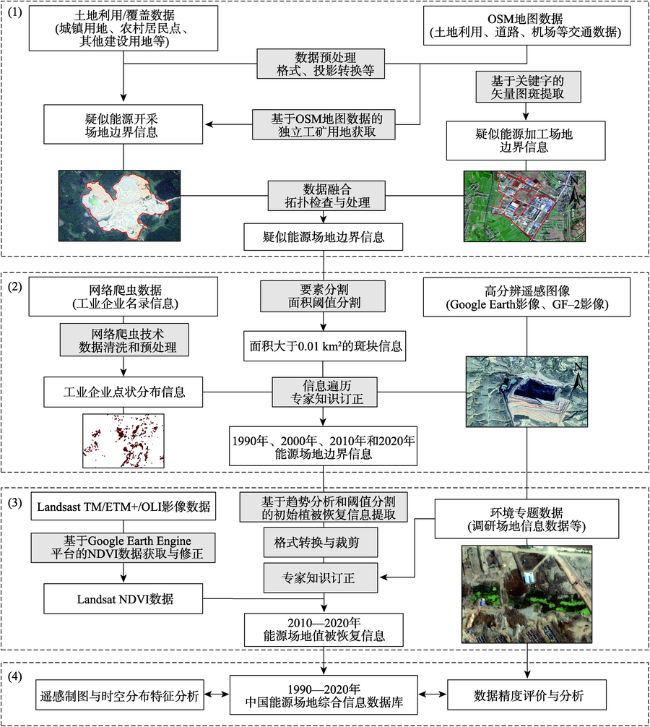
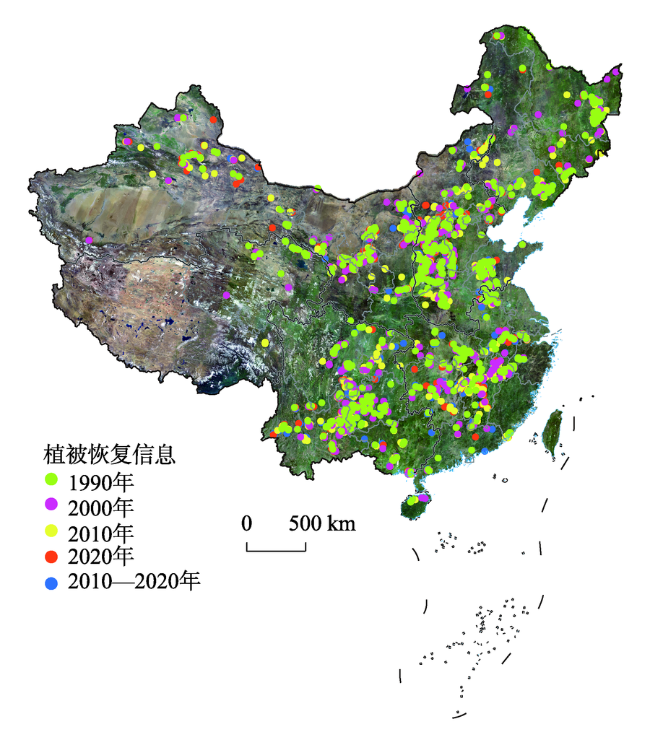
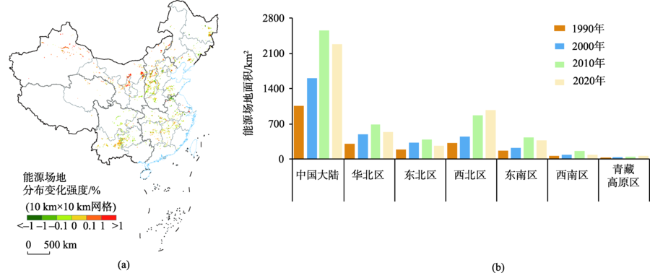
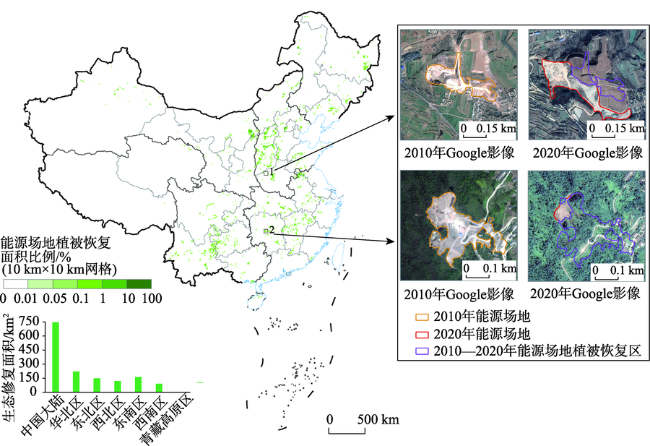
The understanding of spatio-temporal distribution of energy mining and producing sites at the national scale is still insufficient, due to the lack of effective remote sensing detection methods and high-precision data products. This study developed a new method for identifying and mapping energy mining and producing sites based on multi-source data integration and expert knowledge participation, including information from high-resolution remote sensing images, land use/cover data, web crawler data, OSM map data, and environmental thematic data. Energy mining and producing sites data as well as vegetation restoration data were produced in China for 1990, 2000, 2010, and 2020. These data products were as a part of China's land use/cover change datasets (CLUD-mining). The data products of China's energy mining and producing sites can fulfill the demands of 1:25000 mapping, with an average accuracy of 91.75%. In general, the data products have excellent quality and reliability. Results show that the construction area of China's energy mining and processing sites showed a trend of growth followed by decline. From 1990 to 2020, the area of China's energy mining and processing grew by 116.90%, from 1055.94 km2 to 2290.36 km2. From 1990 to 2010, the growth rate of the area of energy mining and processing site increased from 55.22 km2/a in 1990—2000 to 95.51 km2/a in 2000—2010, while the growth rate from 2010 to 2020 was negative, with an average annual decrease of 27.28 km2. In particular, the area of energy fields in Northwest China and Qinghai Tibet Plateau continued to grow, with a total increase of 117.42 km2. In addition, the vegetation restoration area of energy sites reached 746.76 km2 from 2010 to 2020 and mainly concentrated in North China and Southwest China, accounting for 51.41% of the total vegetation restoration area. Overall, the spatial patterns of energy mining and producing sites in China has gradually shifted from the eastern zone to the western zone. This study is of great significance in improving the understanding of the spatial-temporal distribution characteristics of energy mining and producing sites in China and can provide an important data basis for site pollution management and ecological restoration.
GUO Changqing , CHI Wenfeng , KUANG Wenhui , DOU Yinyin , FU Shujing , LEL Mei . Mapping and Spatio-temporal Changes Analysis of Energy Mining and Producing Sites in China Using Multi-source Data from 1990 to 2020[J]. Journal of Geo-information Science, 2022 , 24(1) : 127 -140 . DOI: 10.12082/dqxxkx.2022.210577
表1 数据源列表Tab. 1 List of the data sources |
| 数据类型 | 数据源名称 | 时间/年份 | 分辨率 | 数据格式 | 数据来源 |
|---|---|---|---|---|---|
| 高分辨率遥感影像 | GF-2影像数据 | 2016 | 1 m | 栅格 | 中国科学院遥感与数字地球研究所(http://www.ceode.cas.cn/) |
| Google Earth影像 数据 | 1990—2020 | 0.5 m/1 m/ 2 m | 栅格 | http://google-earth.en.softonic.com/ | |
| 土地利用/覆盖数据 | 中国土地利用/覆盖数据集(CLUD) | 1990—2020 | - | 矢量 | 中国科学院地理科学与资源研究所(http://www.igsnrr.ac.cn/) |
| 网络爬虫数据 | 网络爬虫数据 | 1990—2020 | - | 表格 | 网络爬虫技术/全国排污许可证管理信息平台(公开端)(http://permit.mee.gov.cn/)/绿网环境数据中心(http://www.lvwang.org.cn/)/天眼查(https://www.tianyancha.com/)/企查查(https://www.qcc.com/)/百度电子地图(https://map.baidu.com/) |
| OSM地图数据 | OSM地图数据 | 2020 | - | 矢量 | Open Street Map(https://www.openstreetmap.org/#map=4/36.96/104.17) |
| 环境专题数据 | 调研场地信息数据 | 2018—2020 | - | 表格 | 实地调研获取 |
| Landsat NDVI数据 | 2010—2020 | 30 m | 栅格 | https://earthengine.google.com/ | |
| 基础地理数据 | 行政区划数据 | 2018 | 1:100万 | 矢量 | 国家基础地理信息中心(http://www.ngcc.cn/) |
表2 1990—2020年中国各地理分区能源场地及其植被恢复信息数据产品精度验证信息Tab. 2 Accuracy assessment on energy mining and producing sites and their vegetation restoration information products in different geographical zones in China from 1990 to 2020 |
| 地理分区 | 指标 | 1990年 | 2000年 | 2010年 | 2020年 | 2010—2020年 植被恢复信息 | 平均精度∗/% |
|---|---|---|---|---|---|---|---|
| 华北区 | 总采样数/个 | 286 | 398 | 377 | 390 | 506 | 91.82 |
| 正确数/个 | 255 | 360 | 344 | 376 | 464 | ||
| 错误数/个 | 31 | 38 | 33 | 14 | 42 | ||
| 产品精度/% | 89.16 | 90.45 | 91.25 | 96.41 | 91.70 | ||
| 东北区 | 总采样数/个 | 123 | 188 | 157 | 139 | 201 | 91.82 |
| 正确数/个 | 111 | 170 | 145 | 131 | 186 | ||
| 错误数/个 | 12 | 18 | 12 | 8 | 15 | ||
| 产品精度/% | 90.24 | 90.43 | 92.36 | 94.24 | 92.54 | ||
| 西北区 | 总采样数/个 | 138 | 182 | 213 | 239 | 124 | 91.30 |
| 正确数/个 | 127 | 165 | 190 | 223 | 117 | ||
| 错误数/个 | 11 | 17 | 23 | 16 | 7 | ||
| 产品精度/% | 92.03 | 90.66 | 89.20 | 93.31 | 94.35 | ||
| 东南区 | 总采样数/个 | 161 | 180 | 185 | 176 | 259 | 90.78 |
| 正确数/个 | 140 | 163 | 171 | 164 | 228 | ||
| 错误数/个 | 21 | 17 | 14 | 12 | 31 | ||
| 产品精度/% | 86.96 | 90.56 | 92.43 | 93.18 | 88.03 | ||
| 西南区 | 总采样数/个 | 140 | 183 | 208 | 168 | 264 | 93.11 |
| 正确数/个 | 134 | 161 | 197 | 158 | 230 | ||
| 错误数/个 | 6 | 22 | 11 | 10 | 34 | ||
| 产品精度/% | 95.71 | 87.98 | 94.71 | 94.05 | 87.12 | ||
| 青藏高原区 | 总采样数/个 | 21 | 26 | 33 | 30 | 25 | 91.76 |
| 正确数/个 | 19 | 24 | 30 | 28 | 22 | ||
| 错误数/个 | 2 | 2 | 3 | 2 | 3 | ||
| 产品精度/% | 90.48 | 92.31 | 90.91 | 93.33 | 88.00 | ||
| 中国大陆 | 总采样数/个 | 869 | 1157 | 1173 | 1142 | 1379 | 91.75 |
| 正确数/个 | 786 | 1043 | 1077 | 1080 | 1247 | ||
| 错误数/个 | 83 | 114 | 96 | 62 | 132 | ||
| 产品精度/% | 90.45 | 90.15 | 91.82 | 94.57 | 90.43 |
注:平均精度为1990、2000、2010和2020年能源场地数据产品精度的平均值。 |
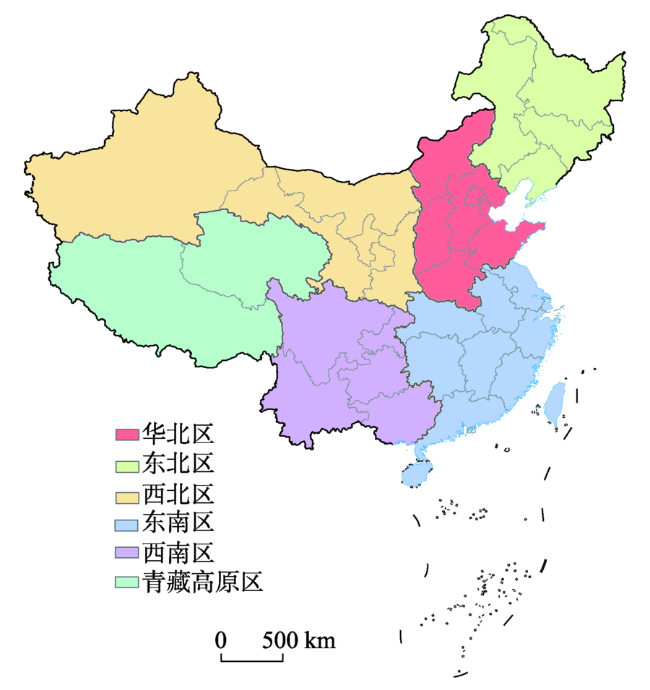
图3 1990—2020年能源场地及其植被恢复信息数据产品精度验证采样点分布注:该图基于自然资源部标准地图服务网站下载的审图号为GS(2020)4624号的标准地图制作,底图无修改。由于数据获取困难,本次研究不包括台湾。底图为2015年Landsat ETM+真彩色合成影像。 Fig. 3 Distribution map of sampling points for accuracy assessment on energy mining and producing sites and their vegetation restoration information products from 1990 to 2020 |
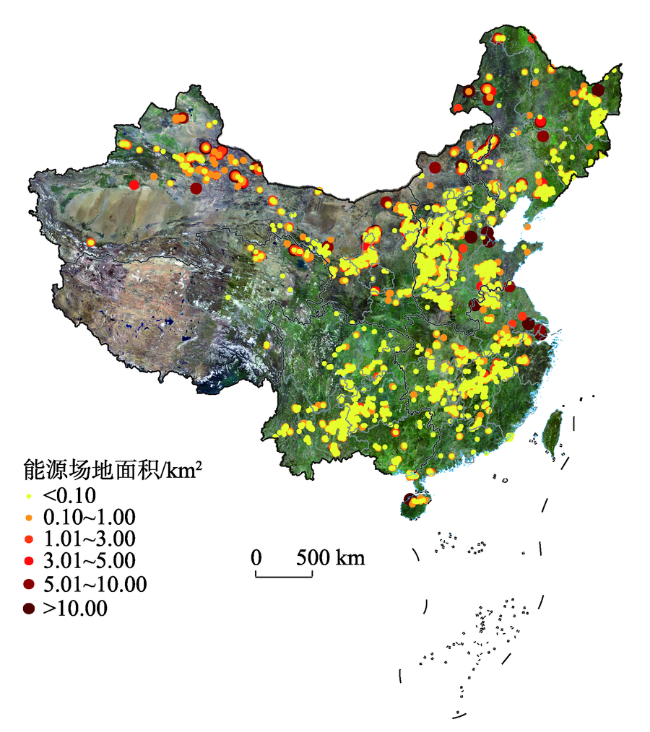
图4 2020年中国能源场地面积分级注:该图基于自然资源部标准地图服务网站下载的审图号为GS(2020)4624号的标准地图制作,底图无修改。由于数据获取困难,本次研究不包括台湾。底图为2015年Landsat ETM+真彩色合成影像。 Fig. 4 Classification map of energy mining and producing sites area in China in 2020 |
| [1] |
|
| [2] |
|
| [3] |
|
| [4] |
|
| [5] |
生态环境部环境规划院. 大气污染防治行动计划[R]. 北京: 人民出版社, 2013.
[ Chinese Academy of Environmental Planning. Action plan of prevention and control of air pollution[R]. Beijing: People Publishing House, 2013. ]
|
| [6] |
生态环境部环境规划院. 水污染防治行动计划[R]. 北京: 人民出版社, 2015.
[ Chinese Academy of Environmental Planning. Action plan of prevention and control of water pollution[R]. Beijing: People Publishing House, 2015. ]
|
| [7] |
生态环境部环境规划院. 水污染防治行动计划[R]. 北京: 人民出版社, 2016.
[ Chinese Academy of Environmental Planning. Action plan of prevention and control of soil pollution[R]. Beijing: People Publishing House, 2016. ]
|
| [8] |
|
| [9] |
|
| [10] |
卞正富, 张燕平. 徐州煤矿区土地利用格局演变分析[J]. 地理学报, 2006, 61(4):349-358.
[
|
| [11] |
|
| [12] |
|
| [13] |
|
| [14] |
杜青松, 李国玉, 彭万林, 等. 基于遥感技术的高寒矿区土地利用变化研究[J]. 环境科学与技术, 2020, 43(12):185-194.
[
|
| [15] |
侯飞, 胡召玲, 成晨. 全极化SAR图像的煤矿区土地覆盖信息分层提取方法研究[J]. 中国生态农业学报, 2013, 21(9):1142-1148.
[
|
| [16] |
宋亚婷, 江东, 黄耀欢, 等. 基于面向对象方法的露天煤矿用地类型提取优先级分析[J]. 遥感技术与应用, 2016, 31(3):572-579.
[
|
| [17] |
|
| [18] |
|
| [19] |
|
| [20] |
毕如田, 白中科, 李华, 等. 大型露天煤矿区土地扰动的时空变化[J]. 应用生态学报, 2007, 18(8):1908-1912.
[
|
| [21] |
王行风, 韩宝平, 汪云甲, 等. 基于遥感的煤矿区景观生态分类[J]. 辽宁工程技术大学学报, 2007, 26(5):776-779.
[
|
| [22] |
杨庚, 张振佳, 曹银贵, 等. 晋北大型露天矿区景观生态风险时空异质性[J]. 生态学杂志, 2021, 40(1):187-198.
[
|
| [23] |
|
| [24] |
|
| [25] |
|
| [26] |
谢克武. 大数据环境下基于python的网络爬虫技术[J]. 电子制作, 2017, 328(9):44-45.
[
|
| [27] |
|
| [28] |
|
| [29] |
金凯, 王飞, 韩剑桥, 等. 1982—2015年中国气候变化和人类活动对植被NDVI变化的影响[J]. 地理学报, 2020, 75(5):961-974.
[
|
| [30] |
骆剑承, 胡晓东, 吴田军, 等. 高分遥感驱动的精准土地利用与土地覆盖变化信息智能计算模型与方法研究[J]. 遥感学报, 2021, 25(7):1351-1373.
[
|
| [31] |
|
| [32] |
|
| [33] |
刘福江, 吴信才, 郭艳, 等. 招远金矿区植被异常及遥感找矿意义[J]. 吉林大学学报(地球科学版), 2007, 37(3):444-449+456.
[
|
| [34] |
|
| [35] |
黄丹, 刘庆生, 刘高焕, 等. 面向对象的煤矸石堆场SPOT-5影像识别[J]. 地球信息科学学报, 2015, 17(3):369-377.
[
|
| [36] |
|
| [37] |
|
| [38] |
|
| [39] |
李晨毓, 井哲帆, 何晓波. 1986—2015年长江源各拉丹冬地区冰川变化遥感监测研究[J]. 冰川冻土, 2021, 43(2):405-416.
[
|
| [40] |
|
| [41] |
|
| [42] |
|
| [43] |
|
| [44] |
|
| [45] |
|
| [46] |
|
| [47] |
王文涛, 刘燕华, 于宏源. 全球气候变化与能源安全的地缘政治[J]. 地理学报, 2014, 69(9):1259-1267.
[
|
| [48] |
陈明星, 先乐, 王朋岭, 等. 气候变化与多维度可持续城市化[J]. 地理学报, 2021, 76(8):1895-1909.
[
|
| [49] |
|
/
| 〈 |
|
〉 |