
Journal of Geo-information Science >
Multi-temporal Cultivated Land Cover Extraction and Change Analysis: A Spatiotemporal Context Method Combining Remote Sensing and Spatial Statistics
Received date: 2021-01-20
Request revised date: 2021-03-10
Online published: 2022-04-25
Supported by
National Natural Science Foundation of China(41871372)
Copyright
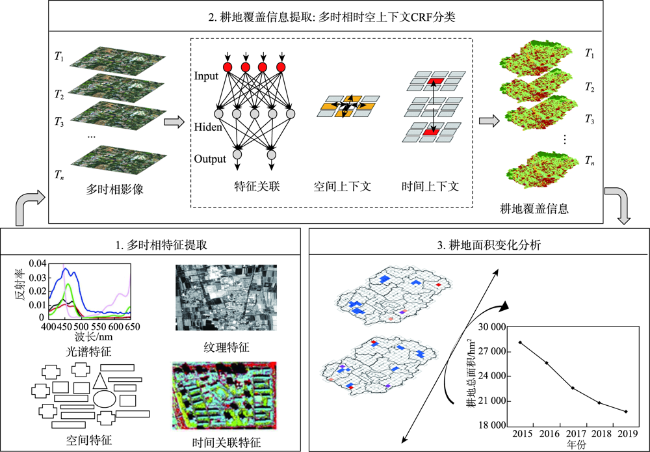
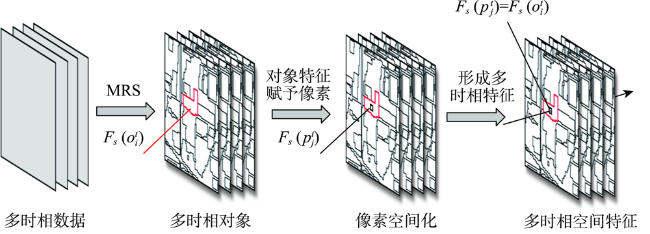
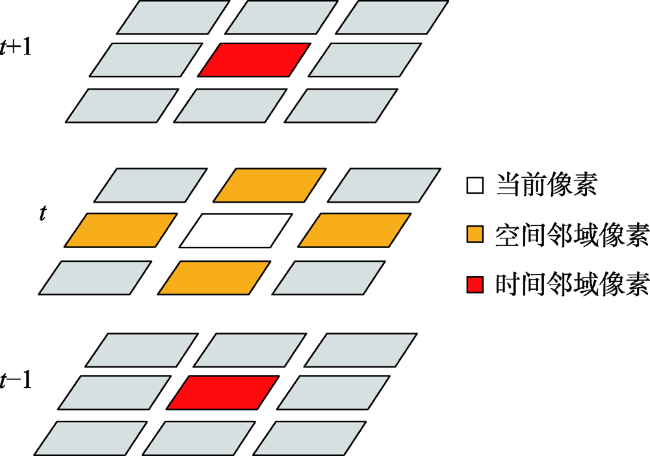
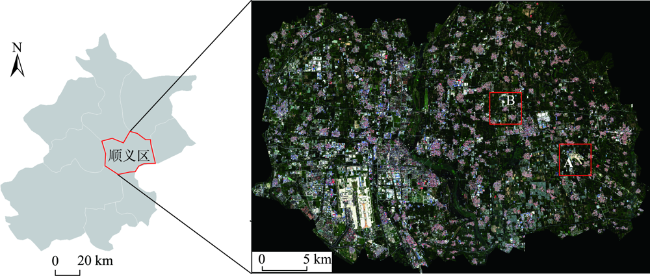
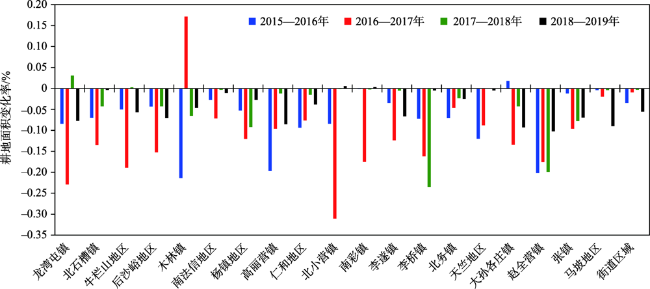
The extraction and change analysis of cultivated land covers based on multi-temporal images are important means to effectively manage and protect cultivated land resources. However, as far as the classification and extraction of multi-temporal cultivated land covers are concerned, the existing methods have limitations in the comprehensive expression of spatiotemporal features and the accurate modeling of spatiotemporal context relations among geographic objects, leading to the poor extraction accuracy of cultivated land covers. In addition, for the analysis of cultivated land change, the existing methods usually only focus on the statistical areal change of cultivated land cover based on administrative units, while consideration is seldom taken into the spatial correlation distribution characteristics of changes in cultivated land covers. Accordingly, first of all, this paper proposes a multi-temporal spatiotemporal context classification method, which comprehensively expresses and utilizes the multi-temporal spectral, texture, and spatial features of geographic objects, and models the contextual relations of features and semantics among geographic objects in both spatial and temporal dimensions of multi-temporal images, so as to improve the classification accuracy of cultivated land covers. Then, based on the extracted results of cultivated land covers, spatial statistical method of Geographic Information System (GIS) is used to analyze the spatial correlation characteristics of cultivated land changes in regular grids and administrative division units. Finally, Shunyi District of Beijing is taken as the study area while multi-temporal Sentinel-2 images in 2015-2019 are used as the data sources to conduct verification of the proposed method. The results show that, compared with the two existing common multi-temporal classification methods, the proposed method achieves the highest accuracies in the classification of multi-temporal cultivated lands. The average user's accuracy and producer's accuracy reach 91.21% and 90.53%, respectively, while the overall accuracy of all categories is 90.79%, indicating that the proposed method can accurately extract the multi-temporal cultivated land cover information. Furthermore, according to the analysis of the spatial distribution characteristics of cultivated land changes, this study found a phenomenon of regional aggregation of the cultivated land change in Shunyi District from 2015 to 2019, which mainly presents the characteristics of concentrated reduction. The aggregation reduction phenomena of cultivated land covers in Zhaoquanying Town, Gaoliying Town, Mulin Town, and Yang Town are especially obvious, indicating that the problems of cultivated land encroachment and reduction are quite serious in these areas.

XI Wenqiang , DU Shihong , DU Shouji . Multi-temporal Cultivated Land Cover Extraction and Change Analysis: A Spatiotemporal Context Method Combining Remote Sensing and Spatial Statistics[J]. Journal of Geo-information Science, 2022 , 24(2) : 310 -325 . DOI: 10.12082/dqxxkx.2022.210034
表1 多时相分类所采用的特征介绍Tab. 1 Introduction of features used in multi-temporal classification |
| 类型 | 维度 | 描述 |
|---|---|---|
| 光谱特征 | 1—8 | R, G, B, NIR, SWIR, NDVI, EVI, LSWI |
| 纹理特征 | 9—12 | GLCM-Homogeneity |
| 13—16 | GLCM-Correlation | |
| 17—20 | GLCM-Energy | |
| 21—24 | GLCM-Entropy | |
| 25—28 | GLCM-Contrast | |
| 空间特征 | 29—36 | 面积、边界长度、长宽比、矩形度、椭圆度、紧凑度、光滑度和形状指数 |
表2 类别转换矩阵 中参数设置Tab. 2 Parameters setting in class transition matrix |
| t | t+1 | ||||||
|---|---|---|---|---|---|---|---|
| 耕地 | 林地 | 草地 | 裸土 | 建筑物 | 道路 | 水体 | |
| 耕地 | 0.90 | 0.04 | 0.04 | 0.10 | 0.15 | 0.01 | 0.01 |
| 林地 | 0.02 | 0.90 | 0.02 | 0.01 | 0.01 | 0.01 | 0.01 |
| 草地 | 0.02 | 0.02 | 0.90 | 0.02 | 0.01 | 0.01 | 0.01 |
| 裸土 | 0.02 | 0.02 | 0.02 | 0.90 | 0.10 | 0.02 | 0.01 |
| 建筑物 | 0.01 | 0.01 | 0.01 | 0.08 | 0.90 | 0.05 | 0.05 |
| 道路 | 0.01 | 0.01 | 0.01 | 0.02 | 0.01 | 0.90 | 0.01 |
| 水体 | 0.01 | 0.01 | 0.01 | 0.01 | 0.01 | 0.01 | 0.90 |
表3 2015—2019年多时相Sentinel-2数据信息Tab. 3 Information of multi-temporal Sentinel-2 data from 2015 to 2019 |
| 参数 | 数值 |
|---|---|
| 空间分辨率 | 10 m |
| 光谱波段 | B2 “Blue” (490 nm) B3 “Green” (560 nm) B4 “Red” (665 nm) B8 “Near-Infrared” (842 nm) B6 “Short Wave Infrared 1” (1610 nm) |
| 成像时间 | 2015-08-13, 2016-08-21, 2017-08-06, 2018-08-16, 2019-08-18 |
图5 2017年实验区影像的样本空间分布Fig. 5 Spatial distribution of samples of experimental area in 2017 |
表4 2015—2019年5个时相影像各类样本的总数Tab. 4 The total number of samples of each class for 5 images from 2015 to 2019 |
| 样本/像素 | 类别 | ||||||
|---|---|---|---|---|---|---|---|
| 耕地 | 林地 | 草地 | 裸土 | 建成区 | 道路 | 水体 | |
| 训练 | 1 382 063 | 478 291 | 165 725 | 115 176 | 1 359 133 | 448 467 | 171 082 |
| 测试 | 690 474 | 238 686 | 80 637 | 55 349 | 678 865 | 224 026 | 83 813 |
表5 2015—2019年5个时相上各土地利用类别的平均用户精度和制图精度Tab. 5 Average user's and producer's accuracies of each class in 5 times from 2015 to 2019 (%) |
| 类别 | 分类方法 | |||
|---|---|---|---|---|
| NOC | PPC | ST-PC ST-CRF | ||
| 用户 精度 | 耕地 | 81.27 | 88.14 | 91.21 |
| 林地 | 80.01 | 87.96 | 90.03 | |
| 草地 | 80.36 | 87.32 | 88.92 | |
| 裸土 | 87.19 | 89.25 | 90.85 | |
| 建成区 | 88.82 | 84.16 | 91.84 | |
| 道路 | 89.73 | 83.58 | 90.41 | |
| 水体 | 96.79 | 95.06 | 96.62 | |
| 制图 精度 | 耕地 | 80.83 | 87.75 | 90.53 |
| 林地 | 80.94 | 87.24 | 89.72 | |
| 草地 | 81.59 | 88.38 | 90.98 | |
| 裸土 | 86.93 | 88.62 | 91.06 | |
| 建成区 | 88.95 | 84.76 | 91.17 | |
| 道路 | 88.57 | 84.19 | 90.64 | |
| 水体 | 96.02 | 95.86 | 96.93 | |
表6 2015—2019年5个时相上3种分类的整体精度和Kappa系数Tab. 6 The overall accuracies and Kappa coefficients of five times for three classifications from 2015 to 2019 |
| 年份 | 分类方法 | |||||||
|---|---|---|---|---|---|---|---|---|
| NOC | PPC | ST-PC | ||||||
| OA | K | OA | K | OA | K | |||
| 2015 | 85.11 | 0.8462 | 87.37 | 0.8672 | 90.52 | 0.8993 | ||
| 2016 | 84.23 | 0.8359 | 88.28 | 0.8713 | 91.05 | 0.9113 | ||
| 2017 | 84.53 | 0.8427 | 87.54 | 0.8705 | 90.43 | 0.8947 | ||
| 2018 | 85.26 | 0.8471 | 88.32 | 0.8746 | 90.81 | 0.9016 | ||
| 2019 | 84.15 | 0.8303 | 87.27 | 0.8657 | 91.12 | 0.9092 | ||
| 平均值 | 84.66 | 0.8404 | 87.76 | 0.8699 | 90.79 | 0.9032 | ||
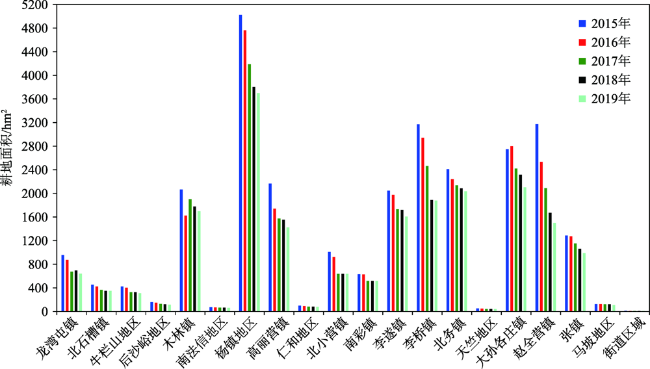
表7 2015—2019年顺义区各乡镇耕地面积Tab. 7 Cultivated land area of towns in Shunyi District from 2015 to 2019 (hm2) |
| 乡镇 | 耕地面积 | ||||
|---|---|---|---|---|---|
| 2015年 | 2016年 | 2017年 | 2018年 | 2019年 | |
| 龙湾屯镇 | 955.91 | 875.59 | 675.13 | 695.92 | 642.11 |
| 北石槽镇 | 453.43 | 421.88 | 364.89 | 349.42 | 348.31 |
| 牛栏山地区 | 424.53 | 403.28 | 327.05 | 327.88 | 309.36 |
| 后沙峪地区 | 157.90 | 151.11 | 128.06 | 122.63 | 114.01 |
| 木林镇 | 2066.39 | 1624.53 | 1902.75 | 1778.64 | 1696.36 |
| 南法信地区 | 71.40 | 69.44 | 64.48 | 64.30 | 63.60 |
| 杨镇地区 | 5023.89 | 4761.19 | 4188.13 | 3803.21 | 3699.04 |
| 高丽营镇 | 2167.58 | 1740.40 | 1573.42 | 1554.92 | 1422.35 |
| 仁和地区 | 99.62 | 90.32 | 83.44 | 82.18 | 79.06 |
| 北小营镇 | 1007.41 | 922.73 | 636.51 | 635.73 | 639.36 |
| 南彩镇 | 629.17 | 628.17 | 518.16 | 517.08 | 518.78 |
| 李遂镇 | 2046.14 | 1975.79 | 1731.35 | 1722.20 | 1607.75 |
| 李桥镇 | 3170.52 | 2942.48 | 2465.86 | 1887.23 | 1878.01 |
| 北务镇 | 2409.29 | 2239.89 | 2136.82 | 2087.35 | 2035.42 |
| 天竺地区 | 53.52 | 47.11 | 42.96 | 42.93 | 42.74 |
| 大孙各庄镇 | 2747.66 | 2796.68 | 2421.17 | 2318.53 | 2103.64 |
| 赵全营镇 | 3171.98 | 2532.47 | 2088.10 | 1672.52 | 1501.54 |
| 张镇 | 1287.64 | 1272.60 | 1150.34 | 1061.18 | 987.65 |
| 马坡地区 | 124.73 | 124.25 | 121.81 | 121.35 | 110.45 |
| 街道区域 | 10.06 | 9.71 | 9.62 | 9.60 | 9.07 |
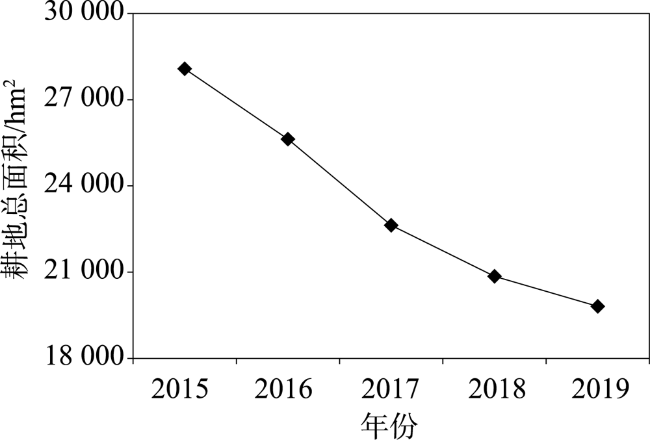
| 总面积 | 28 078.79 | 25 629.62 | 22 630.05 | 208 54.81 | 19 808.59 |
图8 2015—2019年顺义区各乡镇耕地面积Fig. 8 Cultivated land area of towns in Shunyi District from 2015 to 2019 |
| [1] |
|
| [2] |
毕于运. 中国耕地[M]. 北京: 中国农业科技出版社, 1995:1-9.
[
|
| [3] |
赵其国, 周生路, 吴绍华, 等. 中国耕地资源变化及其可持续利用与保护对策[J]. 土壤学报, 2006, 43(4):662-672.
[
|
| [4] |
张国平, 刘纪远, 张增祥. 近10年来中国耕地资源的时空变化分析[J]. 地理学报, 2003, 58(3):323-332.
[
|
| [5] |
|
| [6] |
|
| [7] |
|
| [8] |
魏鹏飞, 徐新刚, 杨贵军, 等. 基于多时相影像植被指数变化特征的作物遥感分类[J]. 中国农业科技导报, 2019, 21(2):54-61.
[
|
| [9] |
|
| [10] |
阴海明, 王立辉, 董明霞, 等. 基于多时相Sentinel-2遥感影像的江汉平原夏收作物提取方法[J]. 福建农林大学学报(自然科学版), 2021, 50(1):16-22.
[
|
| [11] |
|
| [12] |
|
| [13] |
|
| [14] |
|
| [15] |
|
| [16] |
|
| [17] |
|
| [18] |
|
| [19] |
柏林川, 武兰芳, 宋小青. 1995—2010年山东省粮食单产变化空间分异及均衡增产潜力[J]. 地理科学进展, 2013, 32(8):1257-1265.
[
|
| [20] |
|
| [21] |
|
| [22] |
|
| [23] |
|
| [24] |
|
| [25] |
|
| [26] |
Suhet. Sentinel-2 User Handbook[EB/OL]. https://sentinel.esa.int/documents/247904/685211/Sentinel-2_User_H and book, 2013-9-1.
|
/
| 〈 |
|
〉 |