
Journal of Geo-information Science >
Study on the Factors that Influencing High Spatio-temporal Resolution NDVI Fusion Accuracy in Tropical Mountainous Area
Received date: 2021-05-20
Request revised date: 2021-06-29
Online published: 2022-04-25
Supported by
National Natural Science Foundation of China(42001277)
National Key Research and Development Program of China(2016YFB0501502)
Water Conservancy Science and Technology Project of Yunnan Provincial Water Resources Department(2014003)
PhD student academic Newcomer Award funded Projects of Yunnan Normal University(01300205020503233)
Copyright
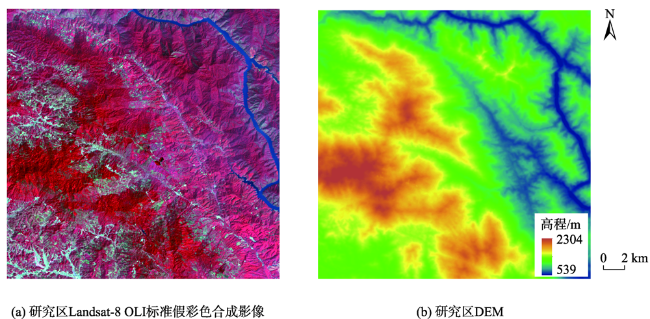
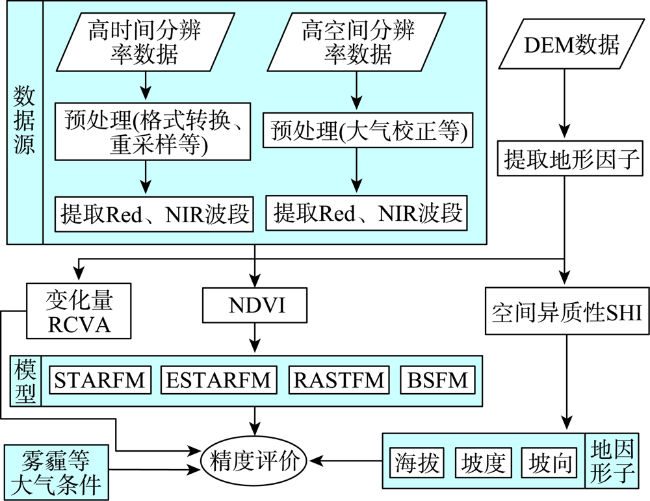
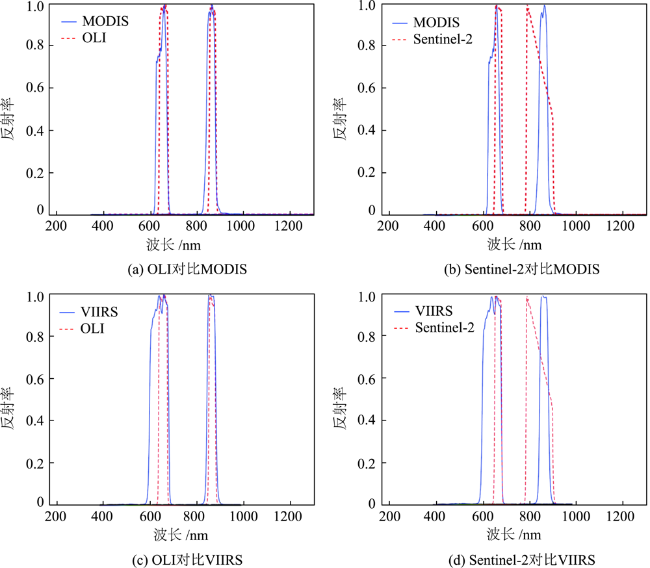
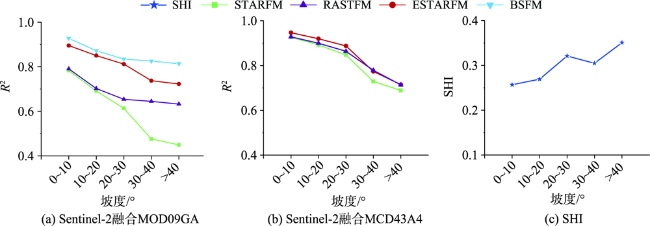
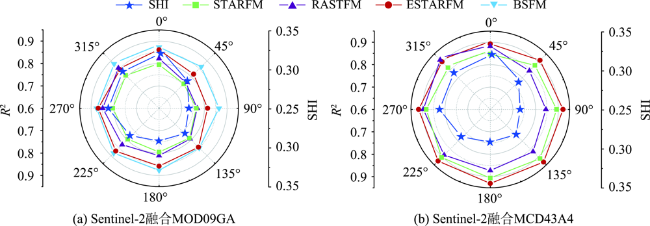
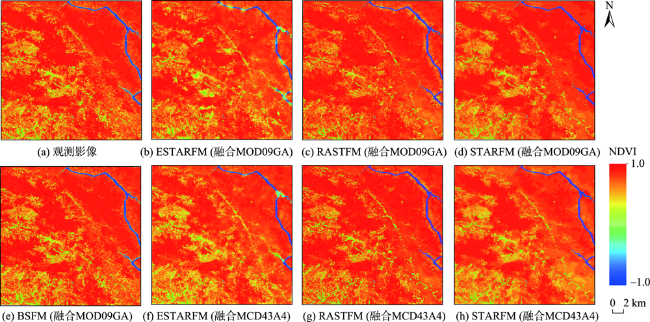
As an important data source in remote sensing application, high spatiotemporal resolution NDVI time series data is of great significance for dynamic change monitoring of land cover, especially in tropical mountainous areas, where the surface elevation changes significantly, climate conditions are complex and spatiotemporally heterogeneous. Many multi-spatiotemporal data fusion models have been proposed by scholars. However, it is rare to analyze the fusion accuracy of these models and their influencing factors in tropical mountainous areas. This study takes the Naban River Watershed in the tropical mountainous area of Southwest China as the study area. Four representative models have been selected from three types of spatiotemporal data fusion methods, namely weight function-based method, Bayesian-based method, and Hybrid method. The four models are Spatial and Temporal Adaptive Reflectance Fusion Model (STARFM), Enhanced Spatial and Temporal Adaptive Reflectance Fusion Model (ESTARFM), Spatial and Temporal Adaptive Reflectance Fusion Model (RASTFM), and Bayesian Spatiotemporal Fusion Model (BSFM). Among them, STARFM and ESTARFM are weight function-based method, BSFM is Bayesian-based method, and RASTFM is Hybrid method. This study carries out analysis of data source selection, terrain of the study area, landscape spatial heterogeneity, pixel numerical accuracy of fusion model, and atmospheric conditions such as thin clouds and haze. The results show that, firstly, the fusion accuracy decreases with the increase of time interval and its relative variation. A better match in sensor spectrum between the two input data results in a higher fusion accuracy. OLI is better than Sentinel-2 while MODIS is better than VIIRS. Compared with unadjusted data, data adjusted by the Bidirectional Reflectance Distribution Function (BRDF) can effectively improve fusion accuracy.Secondly, fusion accuracy is negatively correlated with spatial heterogeneity. Fusion accuracy decreases when spatial heterogeneity increases. There is a strong negative correlation between fusion accuracy and spatial heterogeneity at elevations. Fusion accuracy decreases when slope increases. In comparison, slope aspect has little influence on fusion accuracy. The influence of terrain on RASTFM is smaller when compared with models. Thirdly, the more high-quality high-resolution raw data as input data for the model, the higher the fusion accuracy will be. Fourthly, thin clouds and haze have a significant negative impact on the fusion accuracy. The results have important values as references for improving the high spatial-temporal data fusion model in tropical mountainous areas and establishing high spatiotemporal resolution NDVI data sets in complex geographical environment.

GAO Shupeng , LIU Xiaolong , SONG Jinling , SHI Zhengtao , YANG Lei , GUO Libiao . Study on the Factors that Influencing High Spatio-temporal Resolution NDVI Fusion Accuracy in Tropical Mountainous Area[J]. Journal of Geo-information Science, 2022 , 24(2) : 405 -419 . DOI: 10.12082/dqxxkx.2022.210281
表1 研究选用的数据Tab. 1 Data used in this study |
| 数据 | 空间 分辨率/m | 时间 分辨率/d | 波长范围/μm | DOY(年份) | 数据共享机构 |
|---|---|---|---|---|---|
| Landsat OLI | 30 | 16 | Red:0.630~0.680 NIR:0.845~0.885 | 318(2016) 016(2017) 064(2017) 096(2017) 025(2020) 073(2020) | 美国地质调查局(United States Geological Survey, USGS) (http://glovis.USGS.gov/) |
| Sentinel-2 | 10 | 10 | Red:0.650~0.680 NIR:0.785~0.900 | 326(2016) 020(2017) 040(2017) 070(2017) | 欧洲航天局(European Space Agency, ESA, ) (https://scihub.copernicus.eu/) |
| MODIS | 500 | 1 | Red:0.620~0.670 NIR:0.841~0.876 | 001(2013)~001(2018) | 使用MOD09GA、MCD43A4、MOD09A1产品。(http://reverb.echo.NASA.gov/)。 |
| VIIRS | 500 | 1 | Red:0.600~0.680 NIR:0.846~0.885 | 001(2013)~001(2018) | 使用VNP09GA、VNP43IA4、VNP09A1产品。(http://reverb.echo.NASA.gov/) |
| DEM | 30 | (http://gdem.ersdac.jspacesystems.or.jp/) |
注:DOY(Day of Year)为儒略日,表示一年中的第几天,例如2016年DOY 318表示2016年的第318天。 |
表2 OLI融合NDVI与观测NDVI的比较Tab. 2 Comparison of the predicted NDVI and the observed OLI NDVI |
| 模型 | 间隔天数/RCV | OLI融合MOD09GA | OLI融合VNP09GA | OLI融合MCD43A4 | OLI融合VNP43IA4 | ||||||
|---|---|---|---|---|---|---|---|---|---|---|---|
| R2 | RMSE | R2 | RMSE | R2 | RMSE | R2 | RMSE | ||||
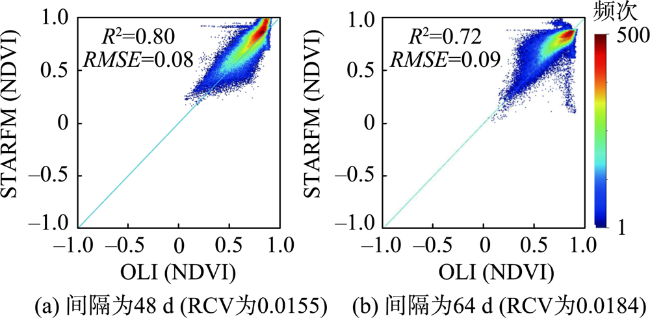
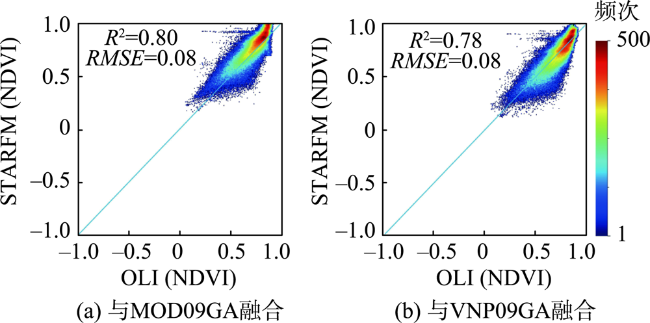
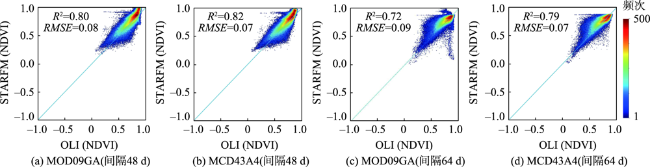
| STARFM | 48/0.0155 | 0.80 | 0.08 | 0.78 | 0.08 | 0.82 | 0.07 | 0.80 | 0.07 | ||
| 64/0.0184 | 0.72 | 0.09 | 0.72 | 0.08 | 0.79 | 0.07 | 0.77 | 0.07 | |||
| RASTFM | 48/0.0155 | 0.81 | 0.07 | 0.80 | 0.07 | 0.84 | 0.06 | 0.82 | 0.07 | ||
| 64/0.0184 | 0.76 | 0.07 | 0.75 | 0.07 | 0.80 | 0.07 | 0.79 | 0.08 | |||
| ESTARFM | 56/0.0170 | 0.88 | 0.06 | 0.85 | 0.06 | 0.90 | 0.06 | 0.89 | 0.06 | ||
| 72/0.0214 | 0.84 | 0.07 | 0.82 | 0.07 | 0.87 | 0.07 | 0.85 | 0.06 | |||
| BSFM | - | 0.95 | 0.04 | 0.93 | 0.05 | - | - | - | - | ||
注:加粗数值表示对应模型的最高融合精度。 |
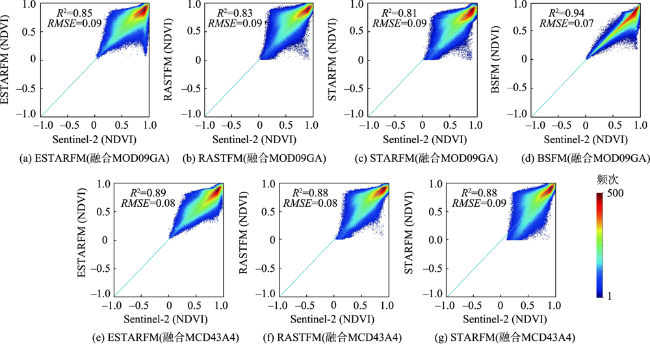
表3 Sentinel-2融合NDVI与观测NDVI的比较Tab. 3 Comparison of the predicted NDVI and the observed Sentinel-2 NDVI |
| 模型 | 间隔天数 /RCV | Sentinel-2融合MOD09GA | Sentinel-2融合VNP09GA | Sentinel-2融合MCD43A4 | Sentinel-2融合 VNP43IA4 | ||||
|---|---|---|---|---|---|---|---|---|---|
| R2 | RMSE | R2 | RMSE | R2 | RMSE | R2 | RMSE | ||
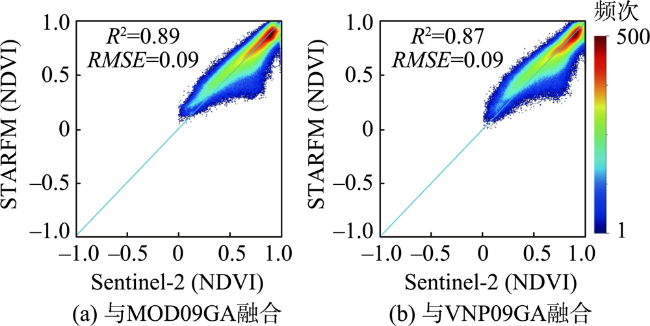
| STARFM | 20/0.0082 | 0.89 | 0.09 | 0.87 | 0.09 | 0.90 | 0.09 | 0.89 | 0.09 |
| 60/0.0145 | 0.81 | 0.09 | 0.81 | 0.09 | 0.88 | 0.09 | 0.87 | 0.09 | |
| RASTFM | 20/0.0082 | 0.89 | 0.09 | 0.88 | 0.09 | 0.91 | 0.08 | 0.90 | 0.08 |
| 60/0.0145 | 0.83 | 0.09 | 0.81 | 0.09 | 0.88 | 0.08 | 0.87 | 0.09 | |
| ESTARFM | 40/0.0114 | 0.90 | 0.06 | 0.89 | 0.07 | 0.93 | 0.06 | 0.93 | 0.06 |
| 55/0.0185 | 0.86 | 0.09 | 0.85 | 0.09 | 0.89 | 0.08 | 0.88 | 0.09 | |
| BSFM | - | 0.94 | 0.07 | 0.92 | 0.07 | - | - | - | - |
注:加粗数值表示对应模型的最高融合精度。 |
图5 OLI与不同低空间分辨率数据的融合精度(STARFM模型,间隔48 d)Fig. 5 Scatterplots of the predicted and the observed OLI (used STARFM and the interval of days is 48 d) |
表4 融合精度与地形因子SHI的相关性Tab. 4 Correlation between fusion accuracy and SHI of terrain factors |
| 地形因子 | 模型 | |||||||||
|---|---|---|---|---|---|---|---|---|---|---|
| STARFM | RASTFM | ESTARFM | BSFM | |||||||
| MOD09GA | MCD43A4 | MOD09GA | MCD43A4 | MOD09GA | MCD43A4 | MOD09GA | ||||
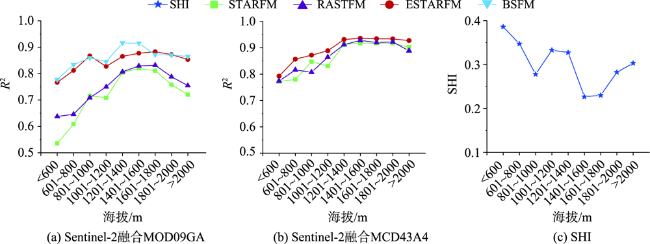
| 海拔 | -0.82 | -0.76 | -0.78 | -0.69 | -0.88 | -0.74 | -0.89 | |||
| 坡度 | -0.86 | -0.84 | -0.87 | -0.86 | -0.85 | -0.83 | -0.89 | |||
| 坡向 | -0.64 | -0.53 | -0.60 | -0.54 | -0.61 | -0.51 | -0.55 | |||
感谢朱孝林博士提供的STARFM、ESTARFM开源代码,黄波教授团队提供的RASTFM融合程序。
| [1] |
|
| [2] |
|
| [3] |
|
| [4] |
|
| [5] |
张立福, 彭明媛, 孙雪剑, 等. 遥感数据融合研究进展与文献定量分析(1992—2018)[J]. 遥感学报, 2019, 23(4):603-619.
[
|
| [6] |
李树涛, 李聪妤, 康旭东. 多源遥感图像融合发展现状与未来展望[J]. 遥感学报, 2021, 25(1):148-166.
[
|
| [7] |
|
| [8] |
|
| [9] |
|
| [10] |
|
| [11] |
|
| [12] |
|
| [13] |
|
| [14] |
|
| [15] |
黄波. 时空遥感影像融合研究的进展与趋势[J]. 四川师范大学学报(自然科学版), 2020, 43(4):427-434,424.
[
|
| [16] |
|
| [17] |
|
| [18] |
刘建波, 马勇, 武易天, 等. 遥感高时空融合方法的研究进展及应用现状[J]. 遥感学报, 2016, 20(5):1038-1049.
[
|
| [19] |
|
| [20] |
|
| [21] |
|
| [22] |
|
| [23] |
|
| [24] |
平博, 孟云闪, 苏奋振. 面向GF-1 WFV数据和MODIS数据的时空融合算法对比分析[J]. 地球信息科学学报, 2019, 21(2):157-167.
[
|
| [25] |
纳板河流域国家级自然保护区管理局. 保护区概况[EB/OL]. https://nbhbhq.xsbn.gov.cn.html,2016-09-26.
[National Nature Reserve Administration of Naban River Watershed.2016. Overview of the nature reserve[EB/OL]. https://nbhbhq.xsbn.gov.cn.html,2016-09-26.
|
| [26] |
|
| [27] |
宫世贤, 凌升海. 西双版纳雾在减少[J]. 气象, 1996(11):11-15.
[
|
| [28] |
|
| [29] |
|
| [30] |
|
| [31] |
|
| [32] |
张雪红. 基于高分辨率遥感的桉树林空间异质性与尺度效应研究[D]. 南京:南京大学, 2012.
[
|
| [33] |
|
| [34] |
|
| [35] |
|
| [36] |
|
| [37] |
|
| [38] |
|
| [39] |
|
| [40] |
|
| [41] |
|
/
| 〈 |
|
〉 |