
Journal of Geo-information Science >
Estimation of the Mass Balance of Greenland IceSheet from 2003 to 2019 based on ICESat and ICESat-2 Laser Altimetry Data
Received date: 2021-06-29
Request revised date: 2021-09-06
Online published: 2022-05-25
Supported by
Major Research Plan of the National Natural Science Foundation of China(41830105)
Copyright
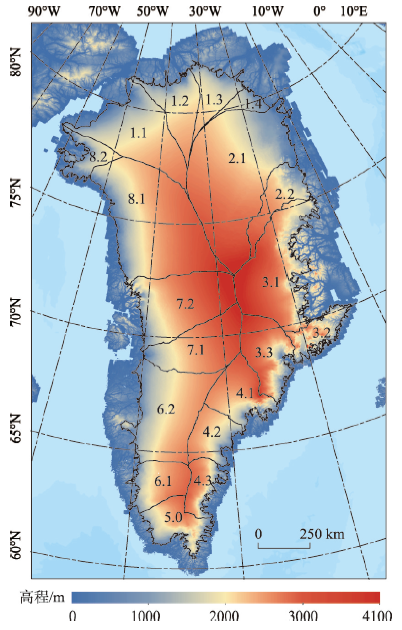
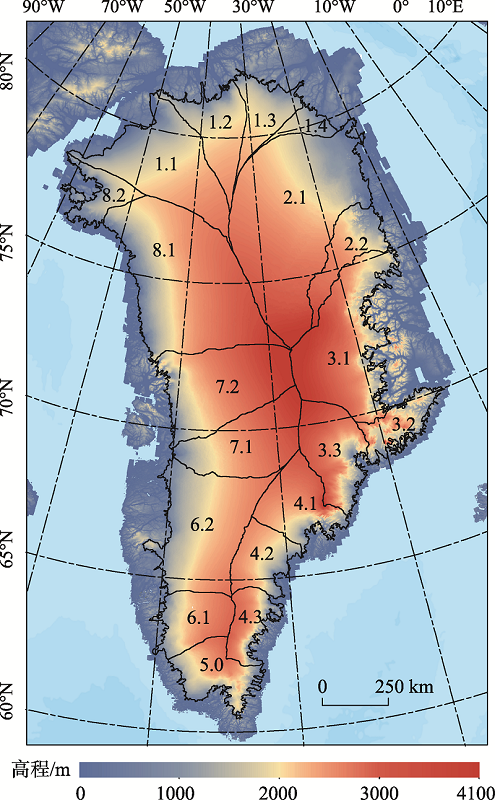
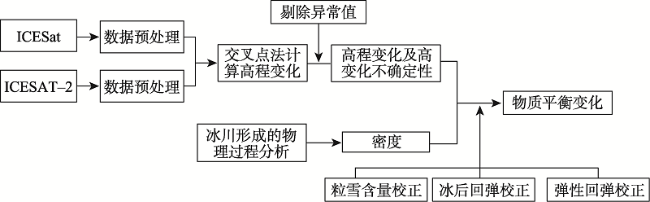
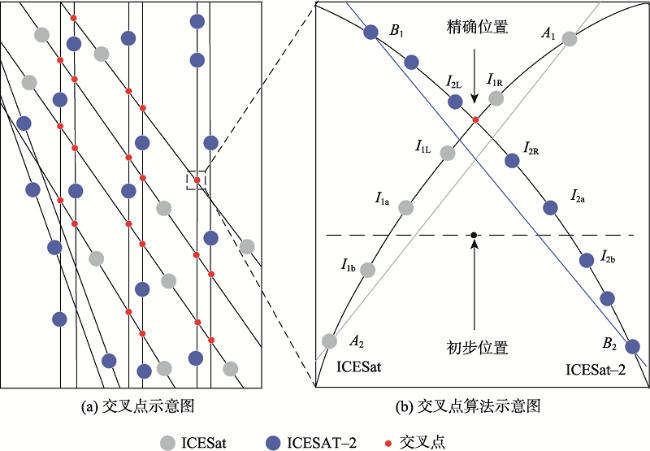
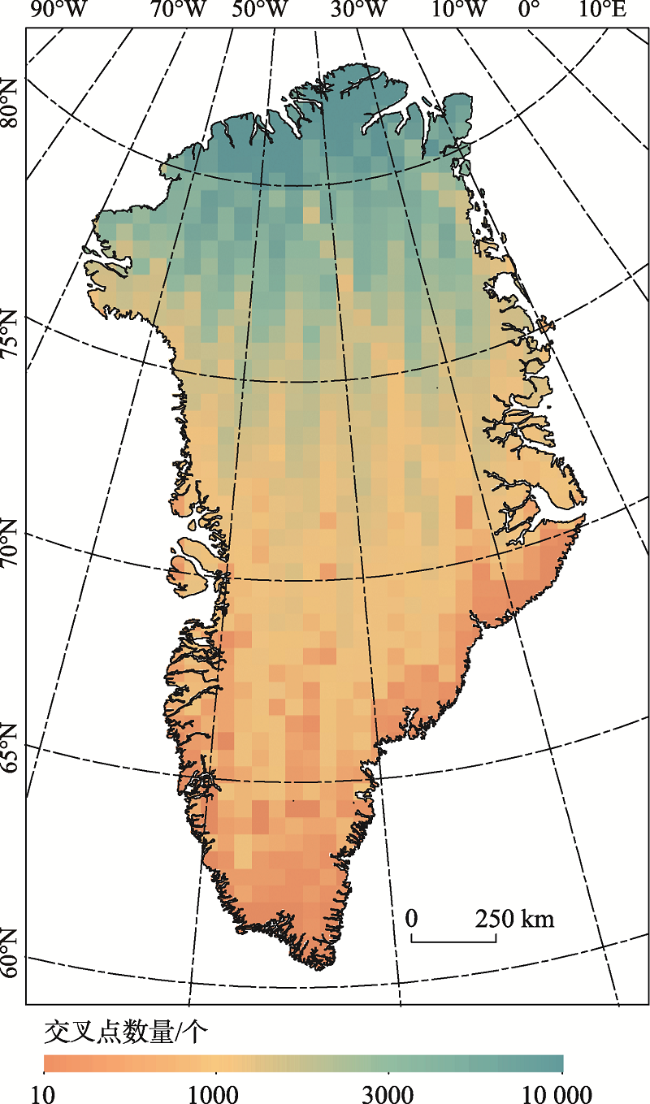
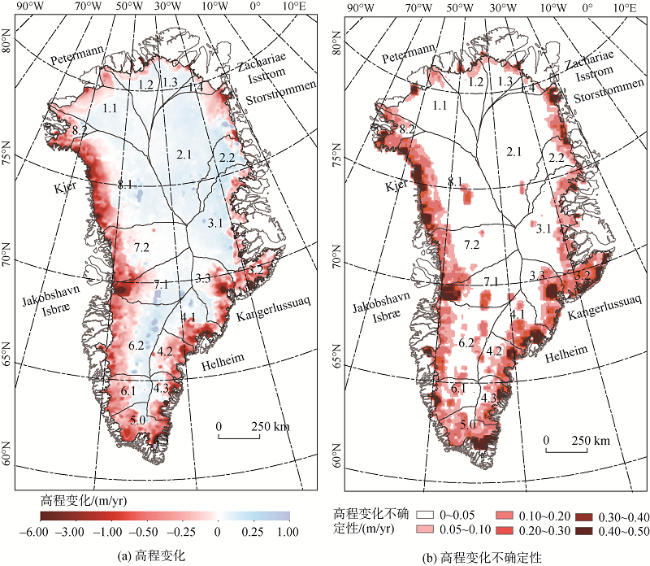
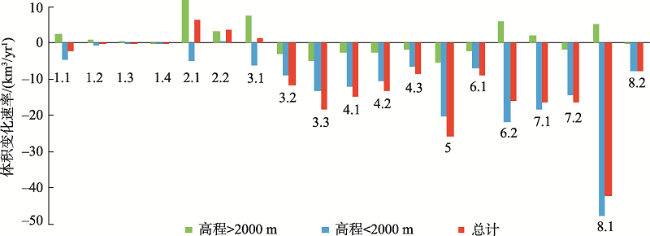
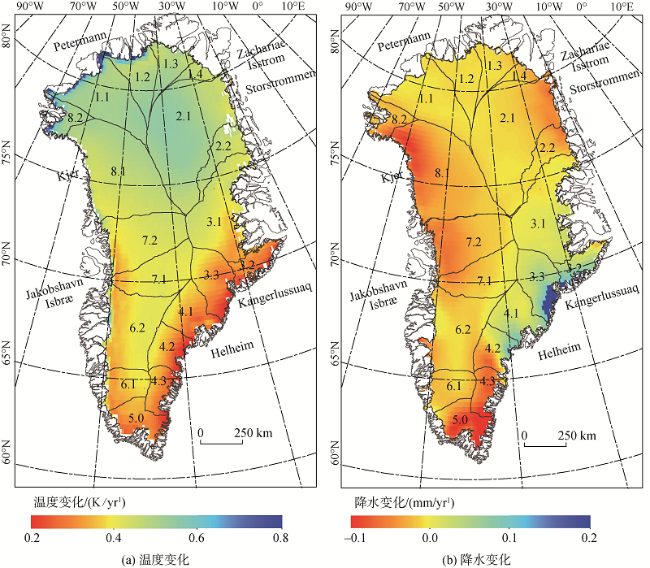
The Greenland Ice Sheet is one of the important factors affecting global climate change. Minor changes in Greenland Ice Sheet can cause significant change in sea level. Thus, it is extremely essential to estimate the Greenland Ice Sheet mass balance quantitatively, which lays foundation for understanding global sea level rise and climate change. In this study, the latest ICESat-2 satellite laser altimetry data (November 2018 to September 2019) and the ICESat data (February 2003 to October 2009) are used to estimate Greenland Ice Sheet mass balance from February 2003 to September 2019. The elevation change of the Greenland Ice Sheet is obtained by crossover analysis. During the process of calculating mass balance, we have corrections for deformation of the Firn Air Content, Glacial Isostatic Adjustment, and Elastic Rebound, and the ice-column density is estimated by ice physical process parameters, such as snow accumulation, glacier surface melting, and glacier surface dynamic change. To further analyze the spatial variation of Greenland Ice Sheet mass balance, we compared the results of mass balance across the glacier hydrological basins. Results show: (1) The main body of the Greenland Ice Sheet from 2003 to 2019 is melting with a mean annual elevation change rate of about -11.27 ± 0.83 cm/yr; (2) For ice sheet below 2000 m, the overall volume change rate is -206.0 km 3/yr, which indicates a relatively large ablation and the maximum ablation rate is -6.0 m/yr. In contrast, the ice sheet above 2000 m shows an accumulation trend. Its volume change rate is 14.2 km3/yr, with the maximum accumulation rate of 1.1 m/yr; (3) The total mass balance of Greenland Ice Sheet grounded-ice from 2003 to 2019 is -195.2 ± 13.1 Gt/yr after correction. And the mass balance change has obvious regional variation. The southeastern and northwestern drainage basins show a large ablation trend, and the northeastern drainage basin is the only accumulation zone; (4) The annual mean temperature in Greenland Ice Sheet is rising at a rate of 0.8 K/yr during the period of 2003-2019, while its mean precipitation shows a downward trend especially in the east and northwest of Greenland Ice Sheet, with a maximum decreasing rate of -0.1 mm/yr. Hence, we can conclude that the accelerated melting pattern of Greenland Ice Sheet is due to the combined effect of the increasing annual mean temperature and decreasing annual mean precipitation in this area.
LI Qingshuo , KE Changqing , ZHANG Jie , FAN Yubin , SHEN Xiaoyi . Estimation of the Mass Balance of Greenland IceSheet from 2003 to 2019 based on ICESat and ICESat-2 Laser Altimetry Data[J]. Journal of Geo-information Science, 2022 , 24(3) : 558 -571 . DOI: 10.12082/dqxxkx. 2022.210361
表1 2003—2019年格陵兰冰盖各流域体积和质量变化Tab. 1 Changes in volume and mass of Greenland Ice Sheet by drainage from 2003 to 2019 |
| 流域 名称 | 体积变化 /(km3/yr) | 粒雪含量校正 /(km3/yr) | 垂直位移校正 /(km3/yr) | 重力回弹校正 /(km3/yr) | 质量变化/(Gt/yr) | |
|---|---|---|---|---|---|---|
| 子流域 | 流域 | |||||
| 1.1 | -2.3 ± 0.9 | -4.1 ± 1.4 | 0.3 ± 0.1 | 0.1 ± 0.0 | -5.6 ± 1.7 | -10 ± 2.8 |
| 1.2 | -0.3 ± 0.9 | -2.3 ± 1.0 | 0.1 ± 0.0 | 0.1 ± 0.0 | -2.3 ± 1.4 | |
| 1.3 | -0.3 ± 1.2 | -1.4 ± 0.7 | 0.0 ± 0.0 | 0.2 ± 0.0 | -1.4 ± 1.4 | |
| 1.4 | -0.4 ± 1.1 | -0.5 ± 0.3 | 0.0 ± 0.0 | 0.1 ± 0.0 | -0.7 ± 1.1 | |
| 2.1 | 6.3 ± 0.9 | -3.6 ± 3.3 | 0.2 ± 0.1 | 0.1 ± 0.0 | 1.8 ± 3.4 | 4.2 ± 3.6 |
| 2.2 | 3.6 ± 1.0 | -0.5 ± 0.8 | 0.0 ± 0.0 | 0.0 ± 0.0 | 2.4 ± 1.1 | |
| 3.1 | 1.4 ± 0.8 | 0.7 ± 3.2 | 0.2 ± 0.1 | 0.0 ± 0.0 | 2.0 ± 3.3 | -22.8± 3.8 |
| 3.2 | -11.8 ± 0.8 | -0.1 ± 1.5 | 0.2 ± 0.0 | 0.0 ± 0.0 | -9.5 ± 1.8 | |
| 3.3 | -18.2 ± 1.6 | -0.7 ± 2.7 | 0.3 ± 0.1 | 0.0 ± 0.0 | -15.3 ± 3.1 | |
| 4.1 | -14.8 ± 1.6 | -3.9 ± 2.4 | 0.3 ± 0.1 | 0.0 ± 0.0 | -15.7 ± 2.9 | -37.9 ± 5.5 |
| 4.2 | -13.3 ± 2.4 | -3.2 ± 2.7 | 0.3 ± 0.1 | 0.0 ± 0.0 | -13.7 ± 3.6 | |
| 4.3 | -8.4 ± 2.1 | -1.9 ± 1.6 | 0.2 ± 0.0 | 0.0 ± 0.0 | -8.5 ± 2.9 | |
| 5 | -25.8 ± 1.9 | -16.2 ± 2.4 | 0.5 ± 0.1 | 0.0 ± 0.0 | -36.7 ± 3.1 | -36.7 ± 3.1 |
| 6.1 | -9.1 ± 2.6 | -2.4 ± 2.1 | 0.2 ± 0.0 | 0.0 ± 0.0 | -9.6 ± 3.3 | -26.5 ± 6.6 |
| 6.2 | -16.2 ± 1.9 | -4.3 ± 5.4 | 0.6 ± 0.1 | 0.0 ± 0.0 | -16.9 ± 5.7 | |
| 7.1 | -16.4 ± 1.0 | -2.7 ± 3.0 | 0.4 ± 0.1 | -0.2 ± 0.0 | -15.5 ± 3.1 | -17.5 ± 4.8 |
| 7.2 | -16.5 ± 1.0 | -1.5 ± 3.5 | 0.5 ± 0.1 | -0.2 ± 0.0 | -2.0 ± 3.7 | |
| 8.1 | -43.9 ± 1.5 | -6.0 ± 4.0 | 0.9 ± 0.1 | -0.3 ± 0.0 | -40.6 ± 4.3 | -48.0 ± 4.6 |
| 8.2 | -7.91 ± 1.0 | -1.0 ± 1.3 | 0.1 ± 0.0 | 0.0 ± 0.0 | -7.4 ± 1.6 | |
| 总计 | -191.74 ± 6.6 | -23.0 ± 11.3 | 5.4 ± 0.3 | 0.5 ± 0.0 | -195.2 ± 13.1 | |
注:加粗部分为累积和消融变化量最大的流域和子流域。其中粒雪含量校正、垂直位移校正、重力回弹校正引用自文献[20]。 |
| [1] |
|
| [2] |
|
| [3] |
|
| [4] |
史红岭, 陆洋, 杜宗亮, 等. 基于ICESat块域分析法探测2003—2008年南极冰盖质量变化[J]. 地球物理学报, 2011, 54(4):958-964.
[
|
| [5] |
|
| [6] |
李家军. 基于cryosat-2测高数据的格陵兰岛冰盖高程变化研究[D]. 东营:中国石油大学(华东),2015.
[
|
| [7] |
叶玥, 程晓, 刘岩, 等. 南极和格陵兰冰盖物质平衡研究进展[J]. 极地研究, 2020, 32(4):571-585.
[
|
| [8] |
黄海兰, 王正涛, 金涛勇, 等. 利用ICESat激光测高数据确定极地冰盖高程变化[J]. 武汉大学学报·信息科学版, 2012, 37(10):1221-1223,1251.
[
|
| [9] |
|
| [10] |
|
| [11] |
陈国栋, 张胜军. 利用ICESat数据确定格陵兰冰盖高程和体积变化[J]. 地球物理学报, 2019, 62(7):2417-2428.
[
|
| [12] |
杨帆, 温家洪. ICESat与ICESat-2应用进展与展望[J]. 极地研究, 2011, 23(2):138-148.
[
|
| [13] |
安德笼, 杨进, 武永斌, 等. ICESat-2激光测高卫星应用研究进展[J]. 海洋测绘, 2019, 39(6):9-15.
[
|
| [14] |
杨康. 格陵兰冰盖表面融水存储、输送与释放遥感研究[D]. 南京:南京大学, 2014.
[
|
| [15] |
|
| [16] |
|
| [17] |
|
| [18] |
|
| [19] |
|
| [20] |
|
| [21] |
|
| [22] |
|
| [23] |
|
| [24] |
|
| [25] |
|
| [26] |
|
| [27] |
|
| [28] |
张栋. 基于ICESat和冰雷达数椐的南极Lambert冰川流域冰盖特征提取研究[D]. 南京:南京大学, 2013.
[
|
| [29] |
陈国栋. 利用ICESat数据确定北极冰雪消融方法的研究[D]. 武汉大学, 2015.
[
|
| [30] |
张震. 基于ICEsat GLAS东帕米尔高原冰川物质平衡监测[J]. 伊犁师范学院学报(自然科学版), 2018, 12(2):42-48.
[
|
| [31] |
|
| [32] |
韩少帅. 2010-2019年南极冰盖的高程变化与物质平衡[D]. 南京:南京大学, 2020.
[
|
| [33] |
|
| [34] |
陈国栋, 王鹏, 赵伟. 基于交叉点不符值的ICESat冰盖测高精度估计[J]. 测绘科学技术学报, 2018, 35(3):226-230.
[
|
| [35] |
|
| [36] |
|
| [37] |
|
| [38] |
|
| [39] |
|
| [40] |
韩少帅, 柯长青, 夏文韬. 基于CryoSat-2雷达高度计数据的南极内陆冰盖高程变化与物质平衡[J]. 冰川冻土, 2019, 41(1):19-26.
[
|
| [41] |
|
| [42] |
|
| [43] |
|
| [44] |
|
| [45] |
|
| [46] |
|
| [47] |
|
| [48] |
|
| [49] |
|
| [50] |
|
| [51] |
冯贵平, 王其茂, 宋清涛. 基于GRACE卫星重力数据估计格陵兰岛冰盖质量变化[J]. 海洋学报, 2018, 40(11):73-84.
[
|
| [52] |
|
| [52] |
|
| [53] |
|
| [54] |
|
| [55] |
高瑀, 王正涛, 李夫鹏, 超能芳. 联合GRACE、Swarm、GRACE-FO卫星观测确定格陵兰岛冰盖质量时空变化特征[J]. 地球物理学报, 2021, 64(7):2405-2416.
[
|
| [56] |
丁锴. 全新世全球温度千年尺度变化的特征与成因分析[D]. 南京:南京师范大学, 2019.
[
|
| [57] |
|
/
| 〈 |
|
〉 |