
Journal of Geo-information Science >
Multi-scenario Evaluation of County-scale Development Potential based on Shared Socioeconomic Pathways and Dynamic Simulation Approach
Received date: 2021-08-31
Revised date: 2021-11-02
Online published: 2022-06-25
Supported by
National Key Research and Development Program of China(2018YFD1100801)
Copyright
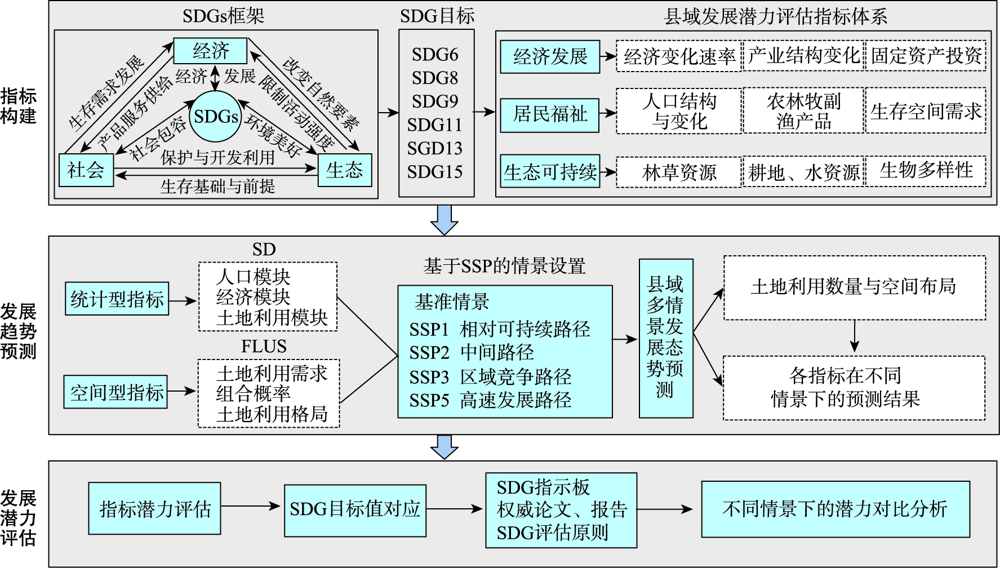
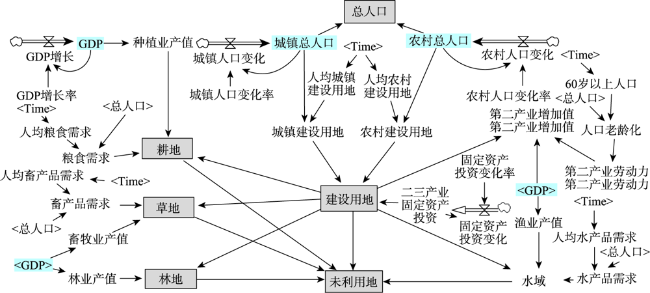
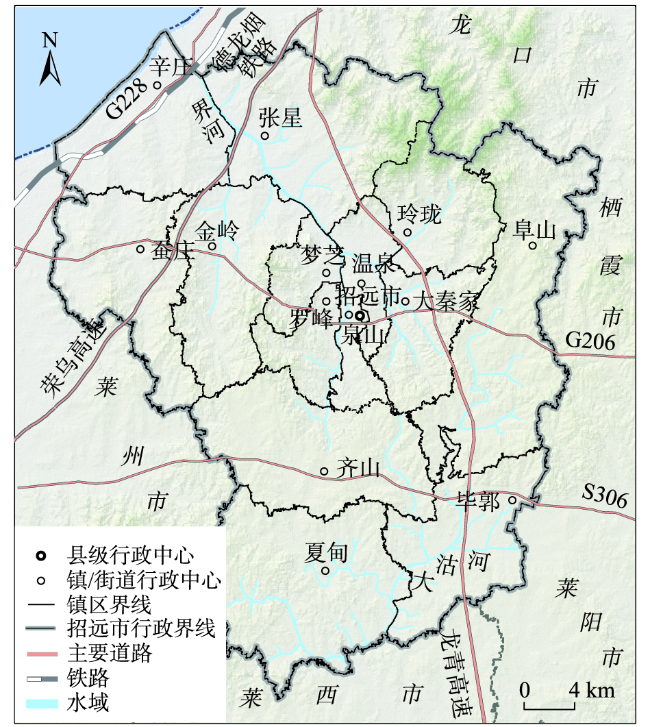
As a key issue of sustainable development, scientific assessment of sustainable development potential at county scale provides a solid support for policy making of regional planning. The existing studies have mostly evaluated development potentials of counties using the aggregation of multi-dimensional indicators based on actual development conditions, but rarely focused on the evolution of development potentials in future. Here, we construct an indicator system for the evaluation of sustainable development potential at county scale based on the 2030 Sustainable Development Goals (SDGs), and project the changes in evaluation indicators based on the integration of System Dynamics model (SD) and Future Land Use Simulation model (FLUS). The Zhaoyuan City in Shandong Province, one of China's top 100 economic counties and famous of its gold mining, was selected as a case study to explore the potential of its transition from the mining-dependent to the sustainable development mode. To examine the impacts of different development modes on sustainable development potentials of the study area, we designed five simulation scenarios based on multiple Shared Socioeconomic Pathways (SSPs), i.e., business-as-usual scenario, SSP1, SSP2, SSP3, and SSP5, and performed the evaluation under different pathways from a simulation perspective. The results show that: (1) A majority of indicators on economic and social dimensions are likely to be improved under all scenarios, while ecological indicators, e.g. carbon sequestration, forest, grass, water shape index, and number of forest, grass, and water patches, will be significantly declined; (2) The changing rate of development potentials during the period of 2018-2030 will be less than that from 2009 to 2018 due to the development transition from extensive to the high-quality mode; (3) Compared with the year of 2018, the development potential on average in 2030 under SSP1 and SSP2 scenarios will be increased by 17.36% and 9.8%, respectively, while those under SSP3 and SSP5 will be decreased by 0.5% and 4.20%, respectively. The SSP1 can maximize the development sustainability of the study area, but SSP5 may exert significantly negative impact; (4) future development of Zhaoyuan City should focus on the promotion of SSP1 scenario and cope with backward indicators such as the labor force proportion in different industries, aging population, and carbon sequestration. Overall, we aim to clarify the mapping relationship between 2030 Sustainable Development Goals and development potentials at county scale and provide a comprehensive evaluation framework for development potentials under multiple simulation scenarios. Our work is expected to provide scientific guidance for development policy making and high-quality development transition of Zhaoyuan City.
LI Fuxiang , LIU Dianfeng , KONG Xuesong , LIU Yaolin . Multi-scenario Evaluation of County-scale Development Potential based on Shared Socioeconomic Pathways and Dynamic Simulation Approach[J]. Journal of Geo-information Science, 2022 , 24(4) : 684 -697 . DOI: 10.12082/dqxxkx.2022.210523
表1 县域可持续发展潜力评估指标体系Tab. 1 Indicator system for sustainable development potential evaluation at county scale |
| 目标层 | 准则层 | 指标层 | 属性 | 对应SDGs |
|---|---|---|---|---|
| 经济 发展 | 人均经济增长 | 人均GDP年增长率/% | 适中型 | SDG8 |
| 农业生产 | 人均农林牧渔产值/(万元/人) | 正向型 | SDG8 | |
| 非农经济发展 | 二三产业增加值占GDP比重/% | 正向型 | SDG9 | |
| 生产性就业 | 二三产业劳动力占总人口比重/% | 正向型 | SDG8 | |
| 经济发展投资 | 二三产业固定资产投资占GDP比重/% | 正向型 | SDG8 | |
| 居民 福祉 | 城乡发展 | 城镇化率/% | 适中型 | SDG11 |
| 人口活力 | 人口老龄化程度/% | 负向型 | SDG11 | |
| 生活空间 | 城市人均用地/(km2/万人) | 适中型 | SDG11 | |
| 乡村人均用地/(km2/万人) | 适中型 | SDG11 | ||
| 建设用地聚集指数(AI) | 正向型 | SDG11 | ||
| 生态 可持续 | 土地生产要素 | 人均耕地面积/(km2/人) | 正向型 | SDG15 |
| 可持续管理森林 | 林地面积比重年变化率/% | 适中型 | SDG15 | |
| 水生态可持续 | 水域面积比重年变化率/% | 适中型 | SDG6 | |
| 草地可持续 | 草地面积比重年变化率/% | 适中型 | SDG15 | |
| 生物多样性保护 | 碳固持/(t/hm2) | 正向型 | SDG13 | |
| 林草水域斑块数量(NP) | 负向型 | SDG15 | ||
| 林草水域形状指数(LSI) | 正向型 | SDG15 | ||
| 香农多样性指数(SHDI) | 正向型 | SDG15 |
表2 不同模拟情景的参数设置Tab. 2 Parameters setting under different simulation scenarios (%) |
| 参数 | SSP1 | SSP2 | SSP3 | SSP5 | BAU |
|---|---|---|---|---|---|
| GDP增长率 | 7.50 | 6.00 | 4.50 | 9.00 | 6.79 |
| 城镇化增长率 | 2.00 | 1.50 | 1.00 | 2.00 | 1.25 |
| 城镇人口变化率 | 0.60 | 0.40 | 0.20 | 0.30 | 0.22 |
| 农村人口变化率 | -0.50 | -0.30 | -0.10 | -0.20 | -0.41 |
| 固定资产投资增长率 | 7.00 | 5.00 | 3.00 | 8.00 | 7.00 |
表3 各指标上限值、下限值确定Tab. 3 Each indicator upper limit value, the lower limit value is determined |
| 指标 | 上限值 | 下限值 | 参考来源 |
|---|---|---|---|
| 人均GDP年增长率/% | 7.00 | 7.00 | 2018年中国评估报告[40] |
| 人均农林牧渔产值/(万元/人) | 2.97 | 0.00 | Xu等[11] |
| 二三产业增加值占GDP比重/% | 95.00 | 57.00 | 2018年中国评估报告 |
| 二三产业劳动力占总人口比重/% | 73.60 | 28.70 | SDG指数和指示板[41] |
| 二三产业固定资产投资占GDP比重/% | 71.72 | 46.85 | 2018年中国评估报告 |
| 城镇化率/% | 70.00 | 70.00 | 曹祺文等[31] |
| 人口老龄化程度/% | 16.10 | 30.00 | 2018年中国评估报告 |
| 城市人均用地/(km2/万人) | 2.50 | 2.50 | SDG指数和指示板 |
| 乡村人均用地/(km2/万人) | 3.50 | 3.50 | SDG指数和指示板 |
| 建设用地聚集指数(AI) | 84.74 | 82.70 | 前五的平均值、倒数2.5%位置值 |
| 人均耕地面积/(km2/人) | 3.10 | 1.50 | 2018年中国评估报告 |
| 林地面积比重年变化率/% | 0.10 | -2.00 | SDG指数和指示板 |
| 水域面积比重年变化率/% | 0.10 | -2.00 | SDG指数和指示板 |
| 草地面积比重年变化率/% | 0.10 | -2.00 | SDG指数和指示板 |
| 碳固持/(t/hm2) | 107.75 | 107.00 | 前五的平均值、倒数2.5%位置值 |
| 林草水域斑块数量(NP) | 9913.00 | 10 609.00 | 前五的平均值、倒数2.5%位置值 |
| 林草水域形状指数(LSI) | 154.73 | 153.50 | 前五的平均值、倒数2.5%位置值 |
| 香农多样性指数(SHDI) | 1.07 | 1.01 | 前五的平均值、倒数2.5%位置值 |
表4 主要数据及其来源Tab. 4 Data and sources in this study |
| 数据类别 | 数据名称 | 时间/年 | 数据来源 | 数据用途 |
|---|---|---|---|---|
| 土地利用 | 土地利用数据 | 2009—2018 | 招远市自然资源和规划局 | SD、FLUS 模型的输入和验证数据及指标计算 |
| 社会经济 | 总人口、城乡人口 | 2009—2018 | 招远市自然资源和规划局 | SD模型构建及指标计算 |
| 农林牧渔产值 | 2009—2018 | |||
| 固定资产投资 | 2009—2018 | |||
| GDP、一二三产业增加值 | 2009—2018 | |||
| 一二三产业劳动力 | 2009—2018 | |||
| 自然环境 | DEM | 2018 | 地理空间数据云平台[44] | FLUS模型输入数据 |
| 基础地理信息 | 铁路、省道、国道、高速公路、城镇中心位置 | 2018 | OpenStreetMap[45] | FLUS模型输入数据 |
表5 不同情景下2030年各指标预测结果Tab. 5 Projects of individual indicators in 2030 under different scenarios |
| 指标 | 2009年 | 2018年 | BAU | SSP1 | SSP2 | SSP3 | SSP5 |
|---|---|---|---|---|---|---|---|
| 人均GDP年增长率/% | 15.00 | 6.00 | 6.36 | 6.98 | 5.66 | 4.31 | 8.26 |
| 人均农林牧渔产值/(万元/人) | 0.63 | 1.40 | 3.50 | 3.75 | 3.14 | 2.62 | 4.44 |
| 二三产业增加值占GDP比重/% | 93.26 | 93.56 | 94.78 | 95.29 | 94.90 | 93.37 | 97.78 |
| 二三产业劳动力占总人口比重/% | 36.49 | 40.42 | 47.30 | 46.27 | 46.15 | 46.01 | 46.09 |
| 二三产业固定资产投资占GDP比重/% | 56.15 | 64.44 | 70.01 | 66.71 | 61.08 | 57.54 | 61.27 |
| 城镇化率/% | 33.64 | 44.01 | 45.88 | 47.28 | 46.09 | 44.90 | 45.49 |
| 人口老龄化程度/% | 18.49 | 26.40 | 37.70 | 37.12 | 37.06 | 36.98 | 37.02 |
| 城市人均用地/(km2/万人) | 2.96 | 2.80 | 2.72 | 2.72 | 2.74 | 2.77 | 2.81 |
| 乡村人均用地/(km2/万人) | 2.78 | 3.97 | 3.85 | 3.80 | 3.83 | 3.84 | 4.00 |
| 建设用地聚集指数 | 82.71 | 82.89 | 84.93 | 85.07 | 84.7 | 84.46 | 84.43 |
| 人均耕地面积/(km2/人) | 1.64 | 1.64 | 1.60 | 1.57 | 1.58 | 1.58 | 1.55 |
| 林地面积比重年变化率/% | -0.14 | -0.13 | -0.13 | -0.13 | -0.11 | -0.11 | -0.15 |
| 水域面积比重年变化率/% | 0.00 | 0.00 | -0.01 | -0.01 | -0.01 | -0.01 | -0.02 |
| 草地面积比重年变化率/% | -0.02 | -0.01 | -0.04 | -0.04 | -0.03 | -0.02 | -0.05 |
| 碳固持/(t/hm2) | 107.39 | 107.82 | 107.75 | 107.69 | 107.78 | 107.81 | 107.61 |
| 林草水域斑块数量 | 8793.00 | 9162.00 | 10 541.00 | 10 478.00 | 10 637.00 | 10 591.00 | 10 609.00 |
| 林草水域形状指数 | 153.50 | 154.94 | 154.61 | 154.55 | 154.74 | 154.82 | 153.77 |
| 香农多样性指数 | 1.01 | 1.03 | 1.07 | 1.07 | 1.06 | 1.06 | 1.06 |
4.4 多情景县域发展潜力 |
表6 不同情景下2030年各指标及综合发展潜力评估结果Tab. 6 Scores of individual indicator and their aggregations in 2030 under different scenarios |
| 指标 | 2009年 | 2018年 | BAU | SSP1 | SSP2 | SSP3 | SSP5 |
|---|---|---|---|---|---|---|---|
| 人均GDP年增长率/% | 0.00 | 87.50 | 92.50 | 100.00 | 83.75 | 66.25 | 83.75 |
| 人均农林牧渔产值/(万元/人) | 20.39 | 40.23 | 100.00 | 100.00 | 100.00 | 88.14 | 100.00 |
| 二三产业增加值占GDP比重/% | 95.05 | 95.04 | 99.43 | 100.00 | 99.72 | 95.72 | 100.00 |
| 二三产业劳动力占总人口比重/% | 17.34 | 24.11 | 41.44 | 40.13 | 38.88 | 38.55 | 38.72 |
| 二三产业固投占GDP比重/% | 37.39 | 70.82 | 85.39 | 73.84 | 57.22 | 42.97 | 58.00 |
| 城镇化率/% | 0.00 | 25.51 | 33.66 | 49.51 | 37.22 | 32.95 | 34.59 |
| 人口老龄化程度/% | 82.81 | 15.90 | 0.00 | 0.00 | 0.00 | 0.00 | 0.00 |
| 城市人均用地/(km2/万人) | 0.00 | 35.13 | 52.31 | 51.58 | 47.26 | 40.21 | 32.89 |
| 乡村人均用地/(km2/万人) | 0.00 | 34.60 | 52.11 | 58.31 | 54.76 | 52.59 | 30.71 |
| 建设用地聚集指数 | 0.00 | 9.05 | 100.00 | 100.00 | 100.00 | 86.20 | 85.15 |
| 人均耕地面积/(km2/人) | 8.52 | 8.65 | 6.12 | 4.36 | 4.85 | 5.17 | 3.22 |
| 林地面积比重年变化率/% | 88.57 | 88.82 | 89.03 | 89.08 | 89.81 | 90.21 | 87.90 |
| 水域面积比重年变化率/% | 95.15 | 95.08 | 94.63 | 94.62 | 94.73 | 94.79 | 94.50 |
| 草地面积比重年变化率/% | 94.46 | 94.54 | 93.54 | 93.52 | 93.88 | 94.10 | 92.96 |
| 碳固持/(t/hm2) | 58.14 | 74.01 | 72.20 | 77.38 | 48.50 | 30.82 | 0.00 |
| 林草水域斑块数量 | 100.00 | 100.00 | 9.77 | 18.82 | 0.00 | 2.59 | 0.00 |
| 林草水域形状指数 | 0.00 | 100.00 | 88.53 | 85.70 | 84.33 | 54.41 | 22.18 |
| 香农多样性指数 | 0.00 | 45.86 | 100.00 | 100.00 | 89.32 | 80.64 | 80.06 |
| 综合潜力分值 | 38.37 | 59.49 | 68.75 | 69.82 | 65.32 | 59.19 | 56.99 |
| [1] |
屠爽爽, 龙花楼, 李婷婷, 等. 中国村镇建设和农村发展的机理与模式研究[J]. 经济地理, 2015,35(12):141-147,160.
[
|
| [2] |
刘彦随, 周扬, 李玉恒. 中国乡村地域系统与乡村振兴战略[J]. 地理学报, 2019,74(12):2511-2528.
[
|
| [3] |
马仁锋, 王筱春, 李文婧, 等. 省域尺度县域综合发展潜力空间分异研究——以云南省为实证[J]. 地理科学, 2011,31(3):344-350.
[
|
| [4] |
郭丽英, 任志远, 靳晓燕. 西北地区特色农业发展潜力与定位分析[J]. 人文地理, 2006,21(1):65-67.
[
|
| [5] |
杨红, 陈百明, 高永, 等. 基于可持续发展的北京市大兴区土地整理潜力评价[J]. 农业工程学报, 2006,22(8):77-82.
[
|
| [6] |
丁正山, 钱新锋, 张学文, 等. 基于旅游发展潜力的县域单元旅游空间功能区划探讨——以江苏省常熟市为例[J]. 地理研究, 2012,31(10):1905-1915.
[
|
| [7] |
杨秀, 余龄敏, 赵秀峰, 等. 乡村振兴背景下的乡村发展潜力评估、分类与规划引导[J]. 规划师, 2019,35(19):62-67.
[
|
| [8] |
何杰, 金晓斌, 梁鑫源, 等. 城乡融合背景下淮海经济区乡村发展潜力——以苏北地区为例[J]. 自然资源学报, 2020,35(8):1940-1957.
[
|
| [9] |
余晓霞, 米文宝. 县域社会经济发展潜力综合评价——以宁夏为例[J]. 经济地理, 2008,28(4):612-616.
[
|
| [10] |
张燕, 徐建华, 曾刚, 等. 中国区域发展潜力与资源环境承载力的空间关系分析[J]. 资源科学, 2009,31(8):1328-1334.
[
|
| [11] |
|
| [12] |
徐晶, 张正峰. 面向SDGs的中国土地可持续评价指标研究[J]. 地理与地理信息科学, 2020,36(4):77-84.
[
|
| [13] |
王鹏龙, 高峰, 黄春林, 等. 面向SDGs的城市可持续发展评价指标体系进展研究[J]. 遥感技术与应用, 2018,33(5):784-792.
[
|
| [14] |
高峰, 赵雪雁, 宋晓谕, 等. 面向SDGs的美丽中国内涵与评价指标体系[J]. 地球科学进展, 2019,34(3):295-305.
[
|
| [15] |
朱婧, 孙新章, 何正. SDGs框架下中国可持续发展评价指标研究[J]. 中国人口·资源与环境, 2018,28(12):9-18.
[
|
| [16] |
|
| [17] |
张军泽, 王帅, 赵文武, 等. 可持续发展目标关系研究进展[J]. 生态学报, 2019,39(22):8327-8337.
[
|
| [18] |
|
| [19] |
|
| [20] |
|
| [21] |
|
| [22] |
|
| [23] |
|
| [24] |
|
| [25] |
|
| [26] |
|
| [27] |
|
| [28] |
|
| [29] |
|
| [30] |
|
| [31] |
曹祺文, 顾朝林, 管卫华. 基于土地利用的中国城镇化SD模型与模拟[J]. 自然资源学报, 2021,36(4):1062-1084.
[
|
| [32] |
|
| [33] |
|
| [34] |
|
| [35] |
|
| [36] |
孙定钊, 梁友嘉. 基于改进Markov-CA模型的黄土高原土地利用多情景模拟[J]. 地球信息科学学报, 2021,23(5):825-836.
[
|
| [37] |
孙才志, 周舟, 赵良仕. 基于SD模型的中国西南水—能源—粮食纽带系统仿真模拟[J]. 经济地理, 2021,41(6):20-29.
[
|
| [38] |
张晓荣, 李爱农, 南希, 等. 基于FLUS模型和SD模型耦合的中巴经济走廊土地利用变化多情景模拟[J]. 地球信息科学学报, 2020,22(12):2393-2409.
[
|
| [39] |
外交部. 2030年可持续发展议程[EB/OL]. https://www.fmprc.gov.cn/web/ziliao_674904/zt_674979/dnzt_674981/qtzt/2030kcxfzyc_686343/.
[ Ministry of Foreign Affairs. 2030 agenda for sustainable development[EB/OL]. https://www.fmprc.gov.cn/web/ziliao_674904/zt_674979/dnzt_674981/qtzt/2030kcxfzyc_686343/. ]
|
| [40] |
中国可持续发展目标(SDGs)指标构建及进展评估报告2018[EB/OL]. https://www.vzkoo.com/read/8d07506fdff3eae62e30c2286d6f6cfb.html.
[ China's Sustainable Development Goals (SDGs) indicator construction and progress assessment report 2018[EB/OL]. https://www.vzkoo.com/read/8d07506fdff3eae62e30c2286d6f6cfb.html. ]
|
| [41] |
Sustainable development report[EB/OL]. https://www.sdgindex.org/.
|
| [42] |
刘立程, 刘春芳, 王川, 等. 黄土丘陵区生态系统服务供需匹配研究——以兰州市为例[J]. 地理学报, 2019,74(9):1921-1937.
[
|
| [43] |
王钰, 胡宝清. 西江流域生态脆弱性时空分异及其驱动机制研究[J]. 地球信息科学学报, 2018,20(7):947-956.
[
|
| [44] |
地理空间数据云[EB/OL]. https://www.gscloud.cn/sources/accessdata/438?pid=2.
[ Geospatial data cloud [EB/OL]. https://www.gscloud.cn/sources/accessdata/438?pid=2. ]
|
| [45] |
OpenStreetMap[EB/OL]. https://www.openstreetmap.org/#map=4/36.95/104.15.
|
| [46] |
李杰兰, 陈兴鹏, 王雨, 等. 基于系统动力学的青海省可持续发展评价[J]. 资源科学, 2009,31(9):1624-1631.
[
|
| [47] |
马历, 龙花楼. 中国乡村地域系统可持续发展模拟仿真研究[J]. 经济地理, 2020,40(11):1-9.
[
|
| [48] |
|
/
| 〈 |
|
〉 |