
Journal of Geo-information Science >
A New Method to Reconstruct MODIS EVI Time Series Data Set based on Graph Theory
Received date: 2021-04-06
Revised date: 2021-07-06
Online published: 2022-06-25
Supported by
National Natural Science Foundation of China(51679233)
13thFive-Year National Key Research and Development Program of China(2017YFC0403600)
Special Fund for Science and Technology Development of Guangdong Province(2017A030310057)
Copyright
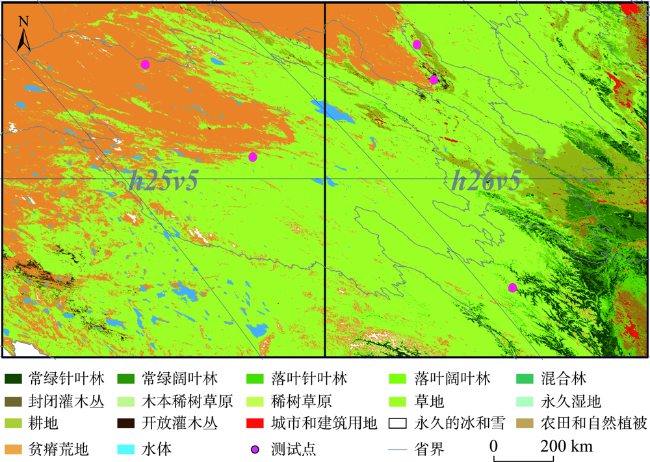
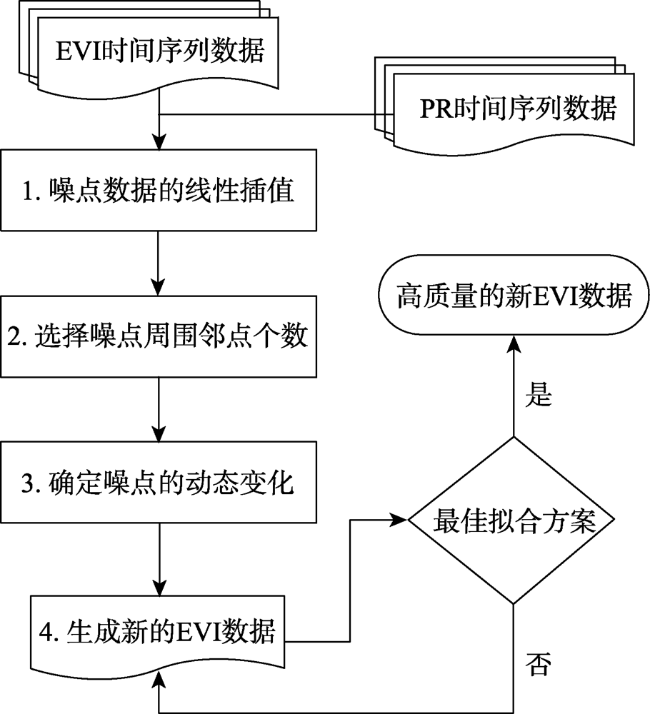
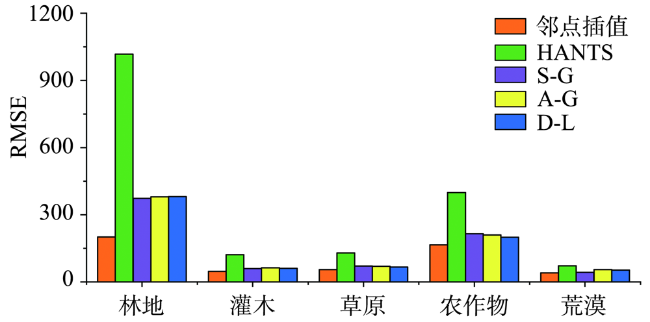
The MODIS Enhanced Vegetation Index (EVI) time-series data has been widely used in many research fields such as vegetation observation, ecological environment, and global meteorological changes. However, even though the EVI time series data has undergone strict preprocessing, there are still some noises in it. Therefore, this paper develops a simple and effective method to reconstruct EVI time-series data and eliminate the noise in EVI time-series data, especially some noise caused by atmospheric clouds and snow cover. The theory of the new method is derived from graph theory, using the relationship of the Laplacian matrix to assign the weight of the pixel of the selected neighborhood window in EVI to get the fitting of the center pixel. The new method has been applied to MODIS MOD13A1 products from 2016 to 2018 and compared with the S-G filtering method, Harmonic Analysis of Time Series method, Double Logistic function method, and Asymmetric Gaussian model function method. The results show that in the desert, grassland, and woodland, the absolute difference of the leave-one verification test of the new method is the smallest, which is better than other methods; when fitting EVI time-series data of different vegetation types, the graph theory neighbor method presents a better detailed fitting curve; the RMSE values of the new method in the five vegetation types are 200.59, 46.58, 63.48, 165.47, and 40.95 respectively, which are the smallest values among the five methods and are more effective in obtaining high-fidelity and high-quality EVI time-series data. The method research in this article can provide a useful reference for the denoising of vegetation remote sensing time-series data and the study of the ecological environment.

CHEN Wen , SUN Liqun , LI Qinglan , CHEN Chen , LI Jiaye . A New Method to Reconstruct MODIS EVI Time Series Data Set based on Graph Theory[J]. Journal of Geo-information Science, 2022 , 24(4) : 738 -749 . DOI: 10.12082/dqxxkx.2022.210181
表1 MCD12Q1 PR图层质量评估分类Tab. 1 MCD12Q1 PR layer quality assessment classification |
| 代号 | 质量情况(PR) | 描述 |
|---|---|---|
| 255 | 无数据 | 未处理 |
| 0 | 良好数据 | 可直接使用 |
| 1 | 边缘数据 | 部分可用,具体参考质量数据 |
| 2 | 雪/冰 | 不可用,雪/冰覆盖 |
| 3 | 云 | 不可用,云层覆盖 |
表2 5类测试点留一验证的对比数据Tab. 2 Leave one to verify the comparative data for the 5 types of test points |
| 类型 | 普通值 | 最大值 | 最小值 | ||||||||
|---|---|---|---|---|---|---|---|---|---|---|---|
| 真实值 | 邻点插值 | 绝对差值 | 真实值 | 邻点插值 | 绝对差值 | 真实值 | 邻点插值 | 绝对差值 | |||
| 林地 | 5619 | 5579.871 | 39.129 | 7124 | 7049.797 | 74.203 | 1058 | 941.051 | 116.949 | ||
| 灌木 | 1116 | 1166.937 | 50.937 | 1888 | 1745.814 | 142.186 | 657 | 704.244 | 47.244 | ||
| 草原 | 857 | 895.397 | 38.397 | 1826 | 1655.251 | 170.749 | 430 | 526.679 | 96.679 | ||
| 农作物 | 3128 | 3474.913 | 346.913 | 5715 | 5487.952 | 227.048 | 897 | 944.294 | 47.294 | ||
| 荒漠 | 886 | 882.815 | 3.185 | 982 | 958.190 | 23.810 | 548 | 605.805 | 57.805 | ||
表3 5类测试点在不同方法的留一验证Tab. 3 Five types of test points in different methods leave one to verify |
| 类型 | 真实值 | 线性插值数据 | 邻点插值 | S-G方法 | HANTS方法 | A-G方法 | D-L方法 | 最小绝对差 |
|---|---|---|---|---|---|---|---|---|
| 林地 | 5619 | 5488.500 | 5579.871 | 5481.347 | 5211.238 | 5476.249 | 5684.763 | 邻点插值 |
| 灌木 | 1116 | 1132.000 | 1166.937 | 1127.458 | 996.877 | 1137.098 | 1149.358 | S-G方法 |
| 草原 | 857 | 867.500 | 895.397 | 801.331 | 743.219 | 799.136 | 786.916 | 邻点插值 |
| 农作物 | 3128 | 3291.000 | 3474.913 | 3318.579 | 2879.664 | 3218.487 | 3279.521 | A-G方法 |
| 荒漠 | 886 | 875.000 | 882.815 | 863.136 | 923.531 | 844.394 | 837.469 | 邻点插值 |
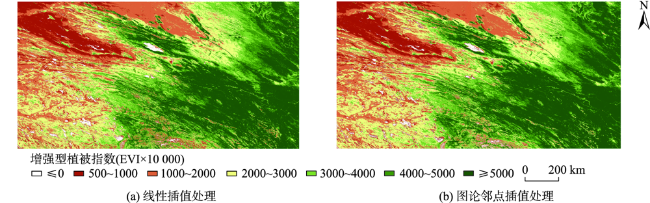
图7 2016年7月中旬实验区域图论邻点方法处理前后的EVI数据分布Fig. 7 EVI data distribution before and after processing with graph theory neighbor method in the experimental area in mid-July 2016 |
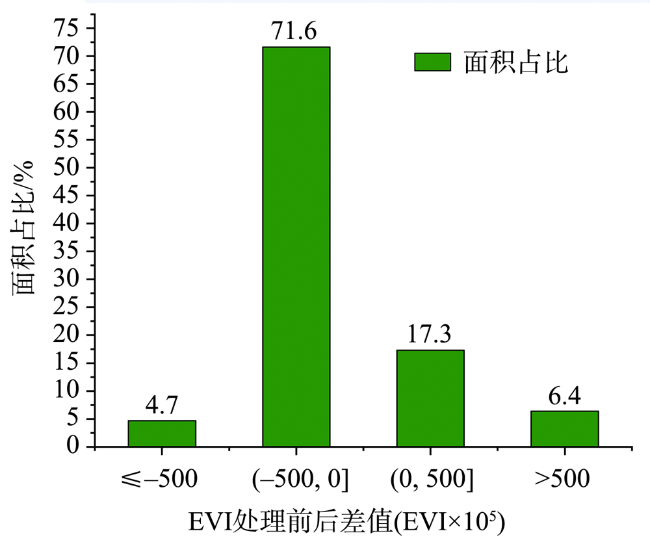
图8 EVI处理前后差值的面积占比Fig. 8 The area ratio of the difference before and after EVI processing |
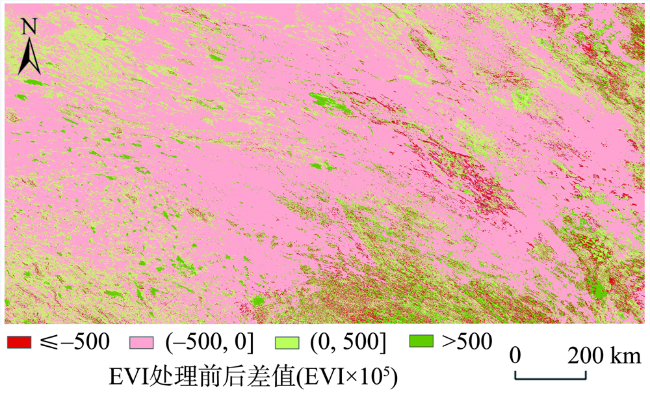
图9 2016年7月中旬实验区域EVI处理前后的差值分布Fig. 9 Distribution of differences before and after EVI treatment in the study area in mid-July 2016 |
衷心感谢中国科学院深圳先进技术研究院高性能计算研究中心提供技术帮助以及NASA提供了本文的原始EVI数据。
| [1] |
|
| [2] |
王正兴, 刘闯,
[
|
| [3] |
孙立双, 马运涛, 毕天平, 等. 辽宁地区不同地表覆盖类型EVI和NDVI特征[J]. 沈阳建筑大学学报(自然科学版), 2013,29(6):1024-1029.
[
|
| [4] |
周惠慧, 王楠, 黄瑶, 等. 不同时间间隔下的遥感时间序列重构模型比较分析[J]. 地球信息科学学报, 2016,18(10):1410-1417.
[
|
| [5] |
刘建文, 周玉科. 站点尺度的青藏高原时序NDVI重构方法比较与应用[J]. 地理科学进展, 2018,37(3):427-437.
[
|
| [6] |
贾若楠, 杜鑫, 李强子, 等. 近15年锡林郭勒盟植被变化时空特征及其对气候的响应[J]. 中国水土保持科学, 2016,14(5):47-56.
[
|
| [7] |
刘倩楠, 岳彩荣, 欧阳志云, 等. 基于MODIS—NDVI时序数据的重庆市植被变化研究[J]. 测绘与空间地理信息, 2012,35(3):99-102.
[
|
| [8] |
|
| [9] |
|
| [10] |
|
| [11] |
|
| [12] |
|
| [13] |
|
| [14] |
蒋雪冰, 胡月明, 刘振华, 等. 基于线性内插的扩展卡尔曼滤波法NDVI时间序列重构研究[J]. 科技通报, 2017,33(2):137-142.
[
|
| [15] |
|
| [16] |
|
| [17] |
|
| [18] |
|
| [19] |
|
| [20] |
何月, 樊高峰, 张小伟, 等. 浙江省植被物候变化及其对气候变化的响应[J]. 自然资源学报, 2013,28(2):220-233.
[
|
| [21] |
张晗, 任志远. 多种时序NDVI重建方法比较与应用分析[J]. 中国农业科学, 2014,47(15):2998-3008.
[
|
| [22] |
|
| [23] |
|
| [24] |
|
| [25] |
|
| [26] |
|
| [27] |
|
| [28] |
|
| [29] |
|
| [30] |
|
| [31] |
耿丽英, 马明国. 长时间序列 NDVI 数据重建方法比较研究进展[J]. 遥感技术与应用, 2014,29(2):362-368.
[
|
| [32] |
王乾坤, 于信芳, 舒清态, 等. MODIS EVI时序数据重建方法及拟合分析[J]. 地球信息科学学报, 2015,17(6):732-741.
[
|
| [33] |
|
/
| 〈 |
|
〉 |


