
Journal of Geo-information Science >
A Downscaling Method for Land Surface Air Temperature of ERA5 Reanalysis Dataset under Complex Terrain Conditions in Mountainous Areas
Received date: 2021-07-11
Revised date: 2021-09-22
Online published: 2022-06-25
Supported by
National Key Research and Development Program of China(2019YFC1510203)
National Natural Science Foundation of China(42171101)
National Natural Science Foundation of China(41871028)
S&T Program of Hebei(19975414D)
Copyright
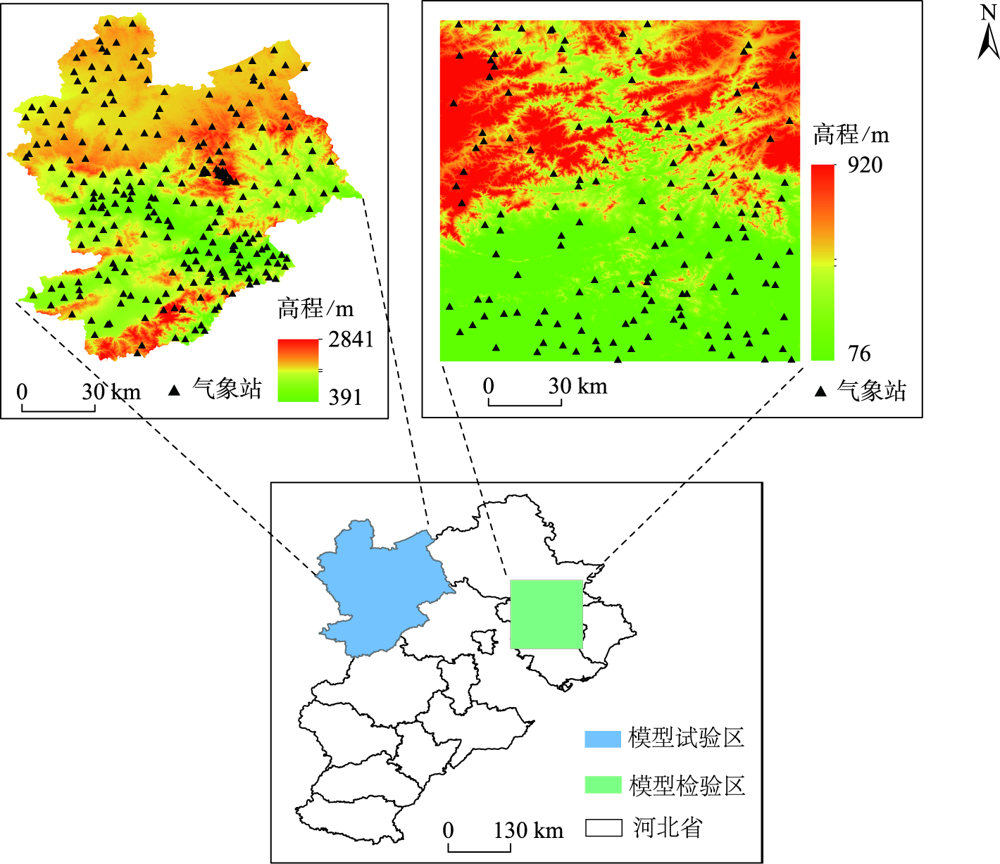
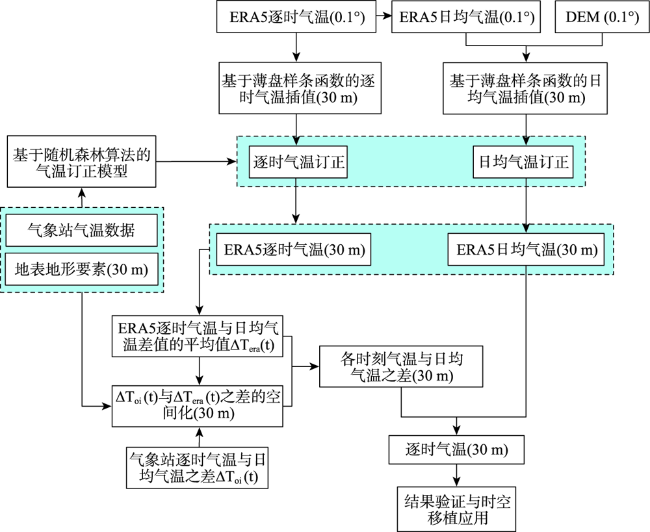
Gridded land surface air temperature with high spatial and temporal resolution is an important input parameter for various geospatial and climate models. Due to the complex terrain and strong spatial heterogeneity of air temperature in mountainous areas, how to obtain surface air temperature data with higher spatial and temporal resolution has always been a research hotspot and difficult question. By selecting the complex terrain region of Zhangjiakou, Hebei province as the experimental area, we first interpolate daily average air temperature at the height of 2 m from ERA5 reanalysis dataset based on local thin plate spline function. Then, by using random forest algorithm, combined with a small amount of weather observation data, terrain data, and land surface parameters, this research constructs the daily average temperature correction model and the hourly temperature estimation model to downscale ERA5 reanalysis air temperature with the resolution of 0.1 ° (about 11 km) to 30 m resolution. Finally, the model is extended and applied to other times and regions without field observation to test the generalizability of the developed downscaling method. The results show that the accuracy of the downscaling method is high, and the mean Root Mean Square Error (RMSE) for January is about 2.4 ℃, which is better than the interpolation results using data measured from meteorological stations. The spatial distribution of the air temperature derived by the developed method is more reasonable, and the texture is more abundant. The average RMSE values of other time and region are 2.9 ℃ and 2.5 ℃, respectively, which are smaller than the RMSE using direct interpolation of reanalysis data. The overall results show that the developed method can be used to downscale the ERA5 reanalysis data to obtain accurate air temperature data with higher spatial and temporal resolution in mountainous areas when there are few meteorological stations.
YU Fachuan , ZHU Shanyou , ZHANG Guixin , ZHU Jiaheng , ZHANG Nan , XU Yongming . A Downscaling Method for Land Surface Air Temperature of ERA5 Reanalysis Dataset under Complex Terrain Conditions in Mountainous Areas[J]. Journal of Geo-information Science, 2022 , 24(4) : 750 -765 . DOI: 10.12082/dqxxkx.2022.210386
表1 本文使用的Landsat8遥感影像Tab. 1 Landsat8 remote sensing image used in the research |
| 覆盖范围 | 轨道号 | 成像日期 |
|---|---|---|
| 方法研究试验区 | 124_031 | 2020-01-31 |
| 124_032 | 2020-01-31 | |
| 125_031 | 2020-01-22 | |
| 125_032 | 2020-01-22 | |
| 模型移植检验区 | 122_032 | 2020-01-01 |
表2 日均气温插值订正所用的地形地表参数Tab. 2 Land surface parameters used to correct daily mean air temperature |
| 参数名称 | 参数描述 | 参考文献 |
|---|---|---|
| NDSI | [36] | |
| NDVI | [37] | |
| Albedo | [38] | |
| LST' | 大气与地表结合部的温度状况,和气温具有较高的相关性 | [39-40] |
| DEM | 通过有限的高程数据对地面地形的数字化模拟。气温随高程的增加而降低 | [41-42] |
| Slope | 坡面的垂直高度和水平方向的距离之比 | [43] |
| Aspect | 坡面在水平面上的投影方向 | [43] |
| SVF | [44] |
注: 表示宽波段光谱反照率, 、 、 、 、 、 分别表示Landsat 8遥感影像的海岸波段、绿波段、红波段、近红外波段、短波红外1、短波红外2的光谱反射率, 表示方位角间距, 为在一个方位角间距范围内的最大山体高度角。 |
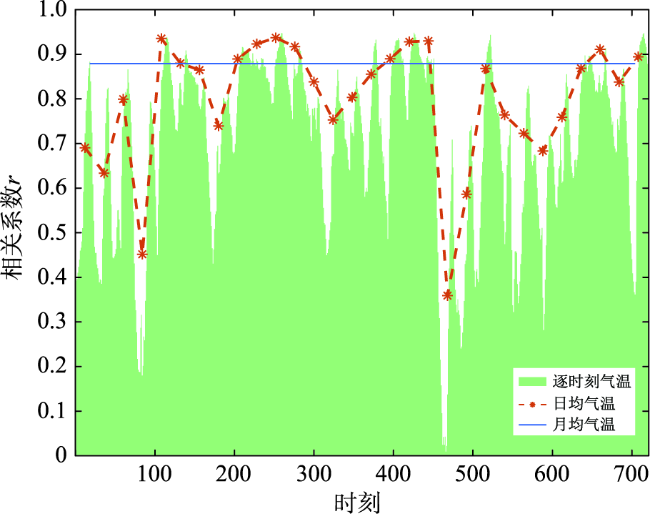
表3 不同时间尺度上再分析气温精度分析Tab. 3 Accuracy analysis of reanalysis temperature on different time scales |
| 指标 | 月均气温 | 日均气温 | 逐时气温 |
|---|---|---|---|
| r | 0.88 | 0.80 | 0.71 |
| MAE/℃ | 2.40 | 2.70 | 3.10 |
| RMSE/℃ | 3.00 | 3.30 | 3.80 |
表4 再分析资料降尺度前后精度对比Tab. 4 Error comparison of reanalysis air temperature data before and after downscaling (℃) |
| 数据 | MAE | MBE |
|---|---|---|
| 0.1°分辨率再分析气温 | 3.88 | 3.53 |
| 降尺度后30 m分辨率气温(训练集) | 1.22 | -0.09 |
| 降尺度后30 m分辨率气温(验证集) | 2.13 | 0.47 |
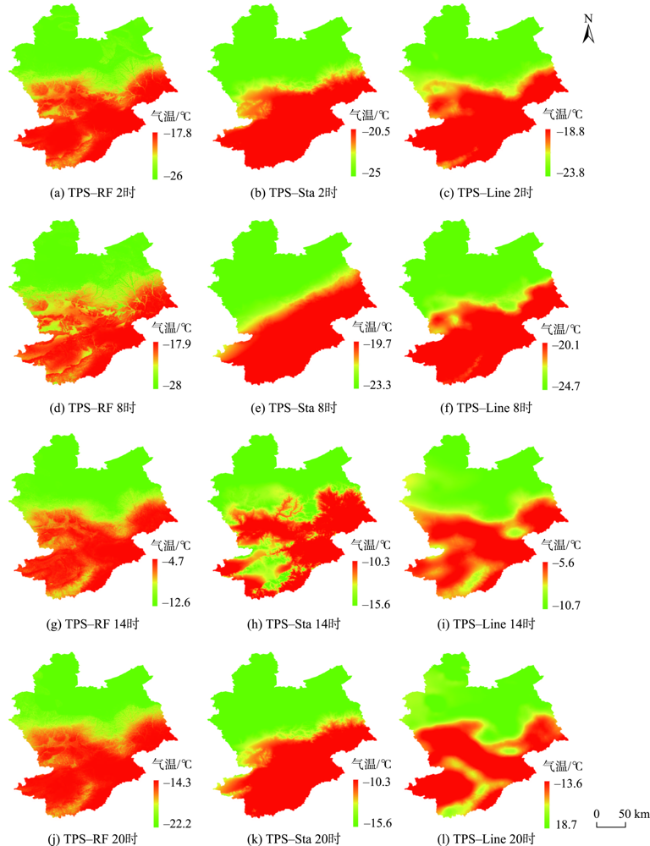
图5 试验区2020年1月14日部分时刻3种方法降尺度结果对比Fig. 5 Comparison of downscaling results of different methods in the test area on January 14, 2020 |
表5 试验区2020年1月14日不同降尺度方法精度Tab. 5 Error comparison of different downscaling methods in the test area on January 14, 2020 |
| 指标 | TPS-RF | TPS-Sta | TPS-Line |
|---|---|---|---|
| RMSE/℃ | 2.68 | 4.17 | 2.92 |
| MAE/℃ | 2.13 | 3.61 | 2.33 |
| r | 0.82 | 0.84 | 0.79 |
表6 2020年1月20日试验区各方法降尺度空间分布结果对比Tab. 6 Comparison of downscaling spatial distribution results of different methods in the test area on January 20, 2020 |
| 模型 | 2时 | 8时 | 14时 | 20时 |
|---|---|---|---|---|
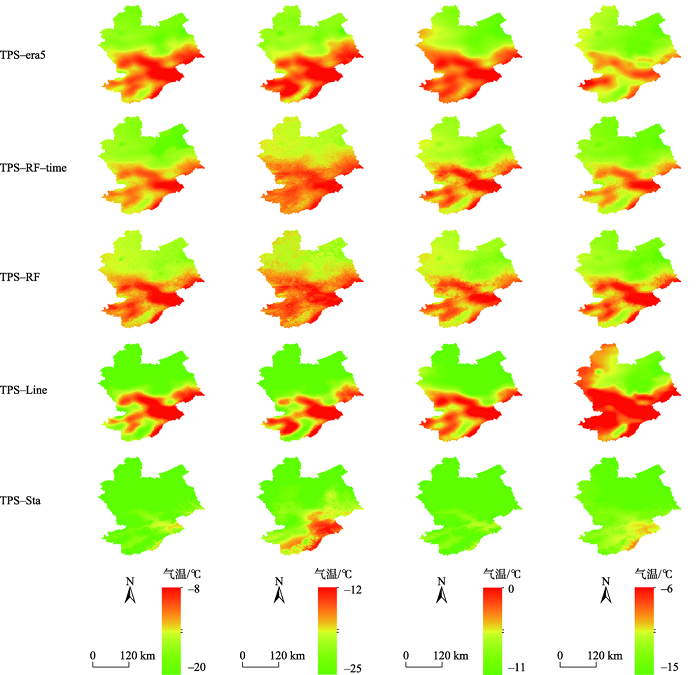 | ||||
表7 试验区2020年1月各降尺度方法精度对比Tab. 7 Comparison of different downscaling methods in the test area in January 2020 |
| 是否使用站点 观测数据 | 方法 | RMSE/℃ | MAE/℃ | r |
|---|---|---|---|---|
| 否 | TPS-era5 | 3.93 | 3.14 | 0.74 |
| TPS-RF-time | 2.89 | 2.35 | 0.77 | |
| 是 | TPS-RF | 2.37 | 1.88 | 0.80 |
| TPS-Line | 2.63 | 2.10 | 0.73 | |
| TPS-Sta | 3.50 | 3.10 | 0.87 |
表8 模型空间移植检验区域的多种降尺度结果对比Tab. 8 Comparison of different downscaling results by transfering the model from the test area to the checking region |
| 模型 | 2时 | 8时 | 14时 | 20时 |
|---|---|---|---|---|
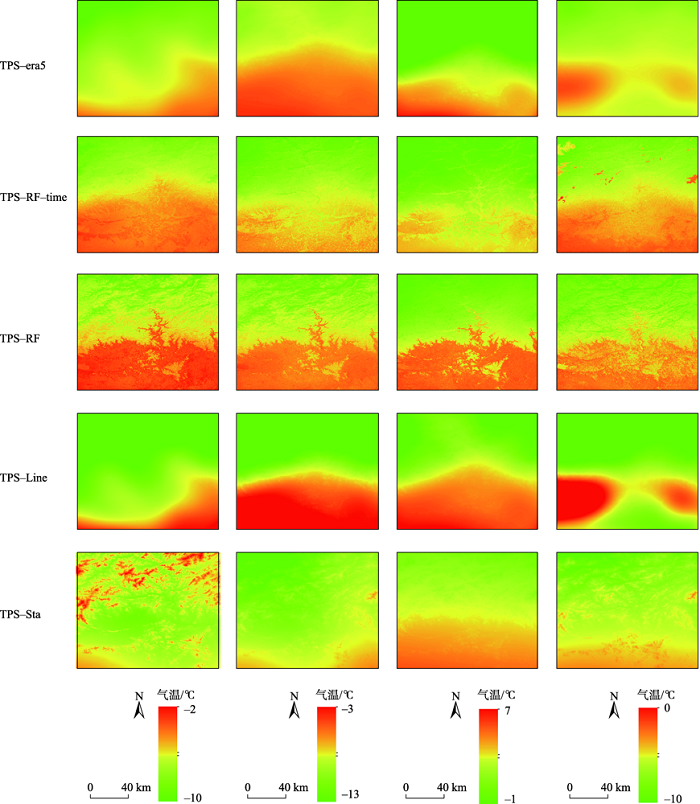 | ||||
表9 模型空间移植检验区域1月各降尺度方法精度对比Tab. 9 Comparison of different downscaling methods for the checking region in January |
| 是否使用站点 观测数据 | 方法 | RMSE/℃ | MAE/℃ | r |
|---|---|---|---|---|
| 否 | TPS-era5 | 2.69 | 2.12 | 0.72 |
| TPS-RF-area | 2.41 | 1.93 | 0.73 | |
| 是 | TPS-RF | 2.00 | 1.53 | 0.76 |
| TPS-Line | 2.00 | 1.56 | 0.74 | |
| TPS-Sta | 2.25 | 2.00 | 0.86 |
| [1] |
|
| [2] |
|
| [3] |
|
| [4] |
|
| [5] |
|
| [6] |
|
| [7] |
段平, 盛业华, 李佳, 等. 自适应的IDW插值方法及其在气温场中的应用[J]. 地理研究, 2014,33(8):31-38.
[
|
| [8] |
|
| [9] |
|
| [10] |
|
| [11] |
|
| [12] |
李莎, 舒红, 徐正全. 利用时空Kriging进行气温插值研究[J]. 武汉大学学报·信息科学版, 2012,37(2):237-241.
[
|
| [13] |
|
| [14] |
|
| [15] |
|
| [16] |
徐翔, 许瑶, 孙青青, 等. 复杂山地环境下气候要素的空间插值方法比较研究[J]. 华中师范大学学报(自然科学版), 2018,52(1):122-129.
[
|
| [17] |
易桂花, 张廷斌, 何奕萱, 等. 四种气温空间插值方法适用性分析[J]. 成都理工大学学报(自然科学版), 2020,47(1):115-128.
[
|
| [18] |
谭剑波, 李爱农, 雷光斌. 青藏高原东南缘气象要素Anusplin和Cokriging空间插值对比分析[J]. 高原气象, 2016,35(4):875-886.
[
|
| [19] |
郑小波, 罗宇翔, 于飞, 等. 西南复杂山地农业气候要素空间插值方法比较[J]. 中国农业气象, 2008,29(4):458-462.
[
|
| [20] |
|
| [21] |
|
| [22] |
|
| [23] |
|
| [24] |
|
| [25] |
|
| [26] |
|
| [27] |
|
| [28] |
|
| [29] |
高谦, 江志红, 李肇新. 多模式动力降尺度对中国中东部地区极端气温指数的模拟评估[J]. 气象学报, 2017,75(6):917-933.
[
|
| [30] |
肖林鸿, 高艳红,
[
|
| [31] |
钞振华. 中国西部地区气温资料的统计降尺度研究[J]. 干旱区研究, 2011,28(5):879-879.
[
|
| [32] |
|
| [33] |
胡德勇, 乔琨, 王兴玲 等. 利用单窗算法反演Landsat 8 TIRS数据地表温度[J]. 武汉大学学报·信息科学版, 2017,42(7):869-876.
[
|
| [34] |
徐涵秋. 新型Landsat8卫星影像的反射率和地表温度反演[J]. 地球物理学报, 2015,58(3):741-747.
[
|
| [35] |
|
| [36] |
|
| [37] |
|
| [38] |
|
| [39] |
|
| [40] |
|
| [41] |
|
| [42] |
|
| [43] |
|
| [44] |
|
/
| 〈 |
|
〉 |
