
Journal of Geo-information Science >
Spatial-temporal Dynamics of Evapotranspiration and Its Components in Nine River Basins of China from 1980 to 2020 based on GlEAM-ET Products
Received date: 2021-08-31
Request revised date: 2021-11-04
Online published: 2022-07-25
Supported by
Natural Science Foundation of China(51979263)
Natural Science Foundation of China(41701019)
Natural Science Foundation of China(42177436)
Innovation and Entrepreneurship Training Program for College Students in Jiangsu Province(202110300100Y)
Natural Science Foundation of Jiangsu Province(BK20201393)
Copyright
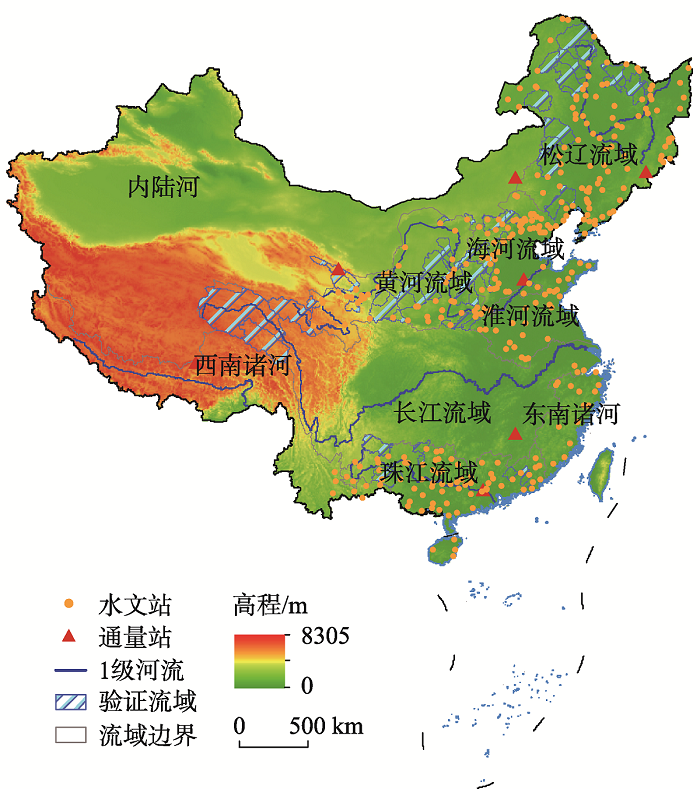
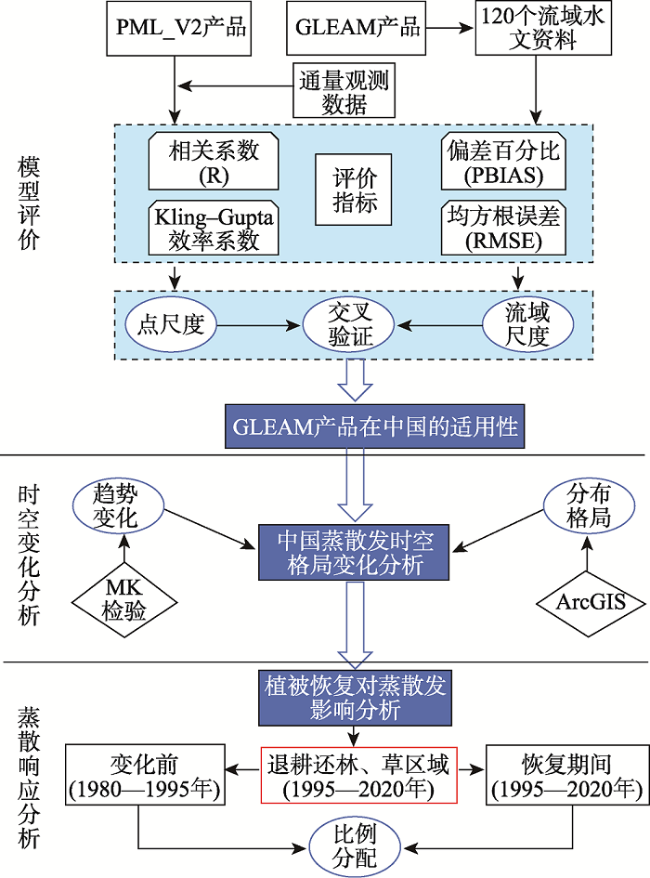
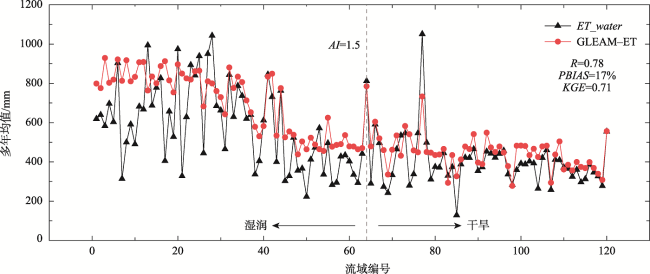
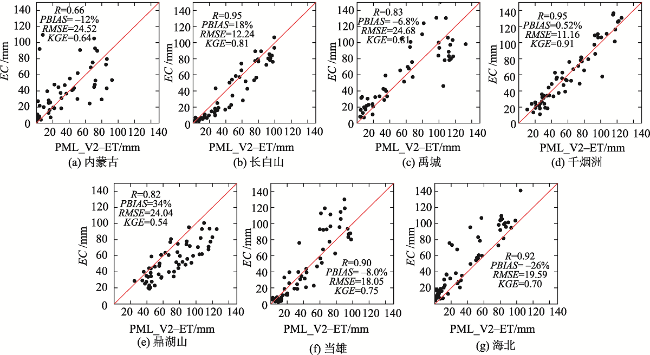
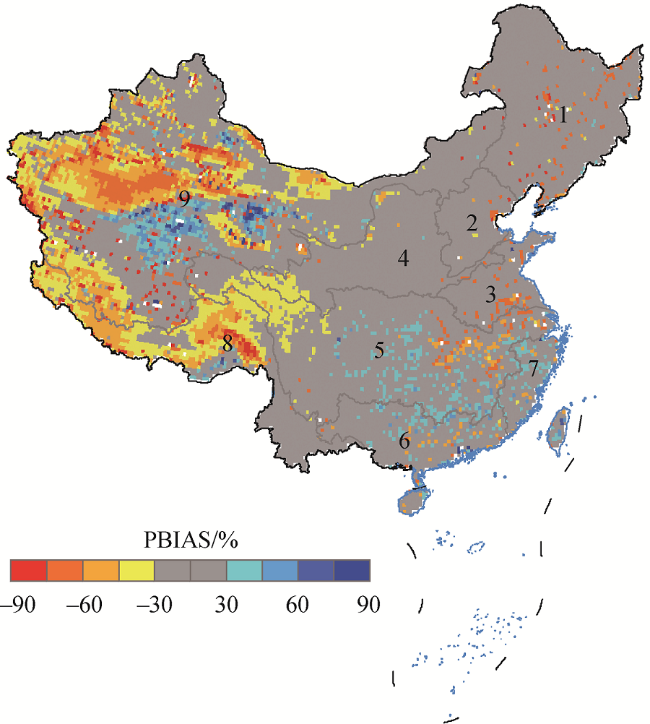
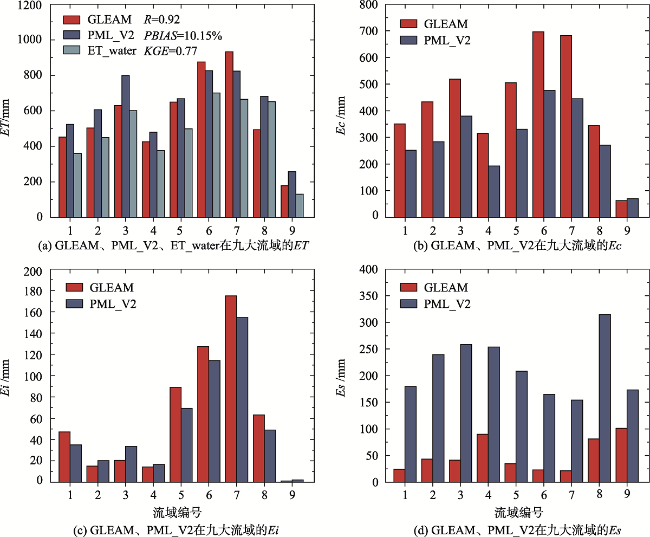
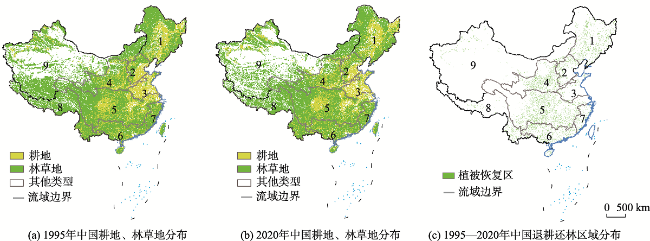
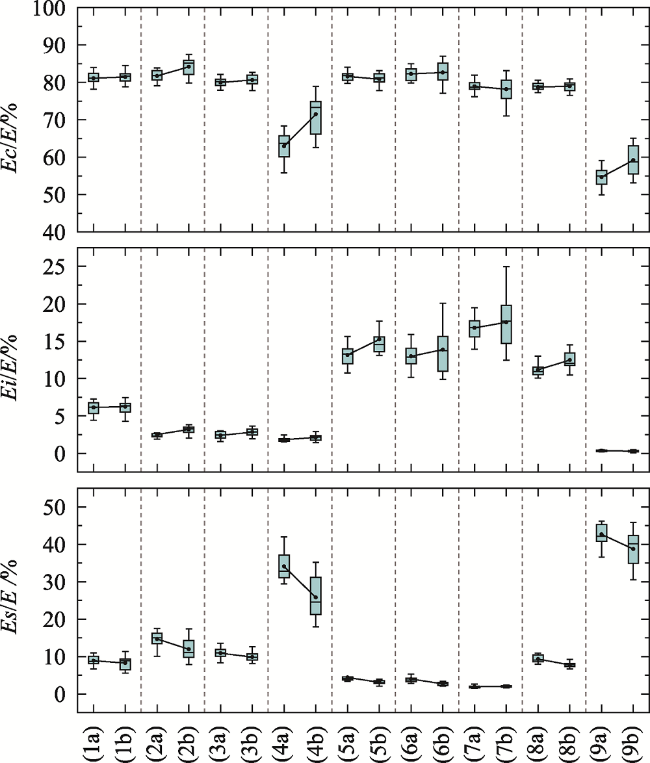
Evapotranspiration (ET) is the link of water exchange between land surface and atmosphere, and has an important effect on the water cycle and energy cycle. In the context of climate change and increasing anthropogenic activities, significant changes in ET have been detected over past decades, which has profoundly impacted the global water cycle system and climate system. Thus, accurate estimation of spatiotemporal variability of ET and its components under a changing environment is essential for water resources planning and management. In this paper, we used the GLEAM-ET dataset to investigate the spatial-temporal dynamics of ET and its components in nine river basins of China. The applicability of the GLEAM model is verified at multiple scales in China based on ET observations at 7 flux sites, ET_water based on water balance principle in 120 basins and the PML_V2 evapotranspiration product. The spatial and temporal patterns of ET and its components (i.e., vegetation transpiration Ec, retained evapotranspiration Ei, and soil evapotranspiration Es) are comprehensively analyzed in the context of revegetation. The results show that: (1) The GLEAM-ET product has a good applicability in nine major river basins in China, and its performance is related to the climate zone. The applicability in arid areas is better than that in humid areas. In addition, the GLEAM and PML_V2 models have a good correlation in nine major watersheds (R>0.7), and their distribution pattern and change trend are consistent overall; (2) From 1980 to 2020, the average ET of China is 416.88 mm, and the growth rate is 1.21 mm/yr. Both Ec and ET show a decreasing pattern from southeast to northwest, while Es shows a reverse trend. The Ec and ET show a significant increasing trend in the 9 major watersheds (p<0.001). The Ei and Es show a significant increase and decrease in the monsoon watersheds, respectively, and an insignificant decrease (p>0.05) and a significant increase trend in inland watersheds, respectively; (3) The proportion of each ET component obviously changes under the background of vegetation restoration. The change of Ec proportion is different from north to south. The Ec proportion decreases in the southern basin and increases in the northern basin. The proportion of Ei and Es increases and decreases, respectively, over all basins. The ET components in the Yellow River Basin respond most obviously to vegetation restoration, with Ec increasing by 5.21% and Es decreasing by 5.56%. These findings will help to provide guidance for water resource management and planning the formulation of ecological restoration policies on the Loess Plateau.
YANG Zelong , LI Yanzhong , BAI Peng , DU Shenwen , HAO Yi , QIAN Chang , LI Chaofan . Spatial-temporal Dynamics of Evapotranspiration and Its Components in Nine River Basins of China from 1980 to 2020 based on GlEAM-ET Products[J]. Journal of Geo-information Science, 2022 , 24(5) : 889 -901 . DOI: 10.12082/dqxxkx.2022.210519
表1 7个通量观测站点气候及生态类型Tab. 1 Climate and ecological types at 7 flux observation sites |
| 站名 | 气候类型 | 生态类型 |
|---|---|---|
| 内蒙古站 | 温带大陆性气候 | 内蒙古温带草原生态系统 |
| 长白山站 | 温带季风气候 | 温带森林生态系统 |
| 禹城站 | 温带季风气候 | 农田 |
| 千烟洲站 | 亚热带季风气候 | 红壤丘陵区农林复合生态系统 |
| 鼎湖山站 | 亚热带季风气候 | 南亚热带森林生态系统 |
| 当雄站 | 高原山地气候 | 青藏高原农牧业 |
| 海北站 | 高原山地气候 | 青藏高原草甸带 |
表2 典型涡度相关观测EC与PML_V2-ET月际趋势对比分析Tab. 2 Comparative analysis of intermonthly trend between EC and PML_V2-ET observed by canonical vorticity correlation |
| 内蒙古 | 千烟洲 | 当雄 | 海北 | 禹城 | 长白山 | 鼎湖山 | |
|---|---|---|---|---|---|---|---|
| EC | -0.18 | 0.22 | 0.14 | -0.32 | 0.07 | -0.10 | 0.25 |
| PML_V2-ET | 0.12 | 0.06 | 0.12 | 0.03 | -0.03 | -0.04 | 0.02 |
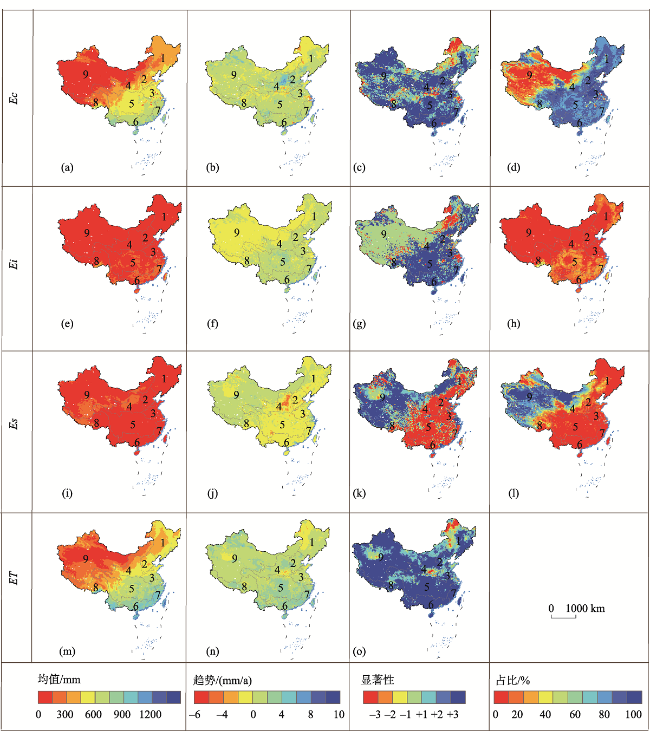
图7 中国蒸散发及其组分在1980—2020年的多年均值、年际变化趋势、显著性、比例分配空间格局注:显著性图例中, 、 代表增加或减少,1、2、3代表显著(p<0.05)、非常显著(p<0.01)、极显著(p<0.001)。该图基于自然资源部标准地图服务网站下载的审图号为GS(2019)1822号的标准地图制作,底图无修改。图中数字1~9对应中国九大流域。 Fig. 7 Spatial pattern of multi-annual mean, interannual variation trend, significance, and proportional distribution of evapotranspiration and its components in China from 1980 to 2020 |
表3 退耕还林草前后,对中国九大流域ET组分比例分配的一致性检验Tab. 3 Consistency test of ET component proportion distribution in 9 major river basins in China before and after returning farmland to forest and grassland |
| 流域编号 | 1 | 2 | 3 | 4 | 5 | 6 | 7 | 8 | 9 |
|---|---|---|---|---|---|---|---|---|---|
| Ec/E | 0.265 | 0.002** | 0.420 | 0.003** | 0.162 | 0.432 | 0.004** | 0.097 | 0.009** |
| Ei/E | 0.231 | 0.002** | 0.002** | 0.007** | 0.008** | 0.156 | 0.004** | 0.002** | 0.521 |
| Es/E | 0.005** | 0.004** | 0.045* | 0.045* | 0.001** | 0.002** | 0.000*** | 0.037* | 0.011* |
注:*,**,***表示变化趋势显著(p<0.05)、非常显著(p<0.01)、极显著(p<0.001)。 |
感谢中国科学院地理科学与资源研究所的马宁和张永强老师对本文的指导。
| [1] |
|
| [2] |
魏光辉, 董新光, 杨鹏年, 等. 基于灰色关联分析与多元线性回归模型的水面蒸发预测[J]. 节水灌溉, 2010, 2:41-44.
[
|
| [3] |
|
| [4] |
宋璐璐, 尹云鹤, 吴绍洪. 蒸散发测定方法研究进展[J]. 地理科学进展, 2012, 31(9):1186-1195.
[
|
| [5] |
|
| [6] |
|
| [7] |
陈鑫涛, 邓超. 多种蒸散发产品在黄河流域的评估和融合[J]. 水电能源科学, 2021,39(5):5-8+57.
[
|
| [8] |
|
| [9] |
詹云军, 章文, 严岩, 等. 长江流域实际蒸散发演变趋势及影响因素分析[J]. 生态学报, 2021, 41(17):1-12.
[
|
| [10] |
温媛媛, 赵军, 王炎强, 等. 基于MOD16的山西省地表蒸散发时空变化特征分析[J]. 地理科学进展, 2020, 39(2):255-264.
[
|
| [11] |
|
| [12] |
刘昌明, 李艳忠, 刘小莽, 等. 黄河中游植被变化对水量转化的影响分析[J]. 人民黄河, 2016, 38(10):7-12.
[
|
| [13] |
|
| [14] |
|
| [15] |
|
| [16] |
|
| [17] |
|
| [18] |
|
| [19] |
|
| [20] |
中华人民共和国水利部水文局. 中华人民共和国水文年鉴[M]. 中华人民共和国水利部水文局, 1980— 2000.
[ Hydrology Bureau Ministry of Water Resources, PRC. Hydrology Yearbook of the People's Republic of China[M]. Hydrology Bureau Ministry of Water Resources, PRC, 1980-2000. ]
|
| [21] |
郑红星, 刘静. 东北地区近40年干燥指数变化趋势及其气候敏感性[J]. 地理研究, 2011, 30(10):1765-1774.
[
|
| [22] |
|
| [23] |
|
| [24] |
焦伟, 陈亚宁, 李稚, 等. 基于多种回归分析方法的西北干旱区植被NPP遥感反演研究[J]. 资源科学, 2017, 39(3):545-556.
[
|
| [25] |
|
| [26] |
|
| [27] |
|
| [28] |
|
| [29] |
刘昌明. 黄河流域水循环演变若干问题的研究[J]. 水科学进展, 2004, 15(5):608-614.
[
|
| [30] |
李艳忠, 刘昌明, 刘小莽, 等. 植被恢复工程对黄河中游土地利用/覆被变化的影响[J]. 自然资源学报, 2016, 31(12):2005-2020.
[
|
| [31] |
|
| [32] |
张永强, 孔冬冬, 张选泽, 等. 2003—2017年植被变化对全球陆面蒸散发的影响[J]. 地理学报, 2021, 76(3):584-594.
[
|
| [33] |
贺添, 邵全琴. 基于MOD16产品的我国2001-2010年蒸散发时空格局变化分析[J]. 地球信息科学学报, 2014, 16(6):979-988.
[
|
| [34] |
|
| [35] |
|
| [36] |
|
| [37] |
|
| [38] |
|
/
| 〈 |
|
〉 |

