
Journal of Geo-information Science >
Urban Vegetation Classification based on Multi-scale Feature Perception Network for UAV Images
Received date: 2021-09-23
Request revised date: 2021-11-09
Online published: 2022-07-25
Supported by
National Natural Science Foundation of China(41971311)
National Natural Science Foundation of China(41902182)
Natural Science Foundation of Anhui Province(2008085QD188)
Copyright
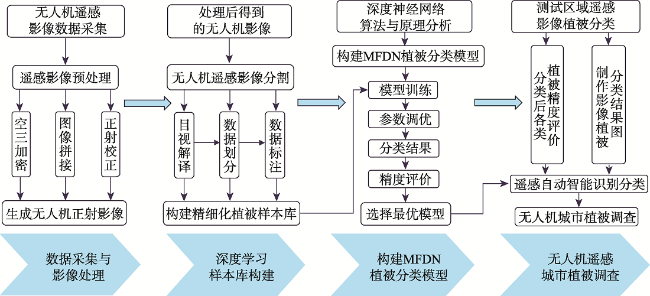
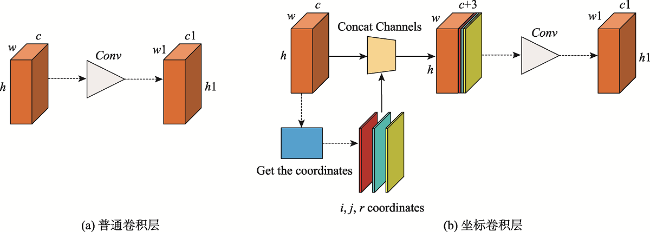
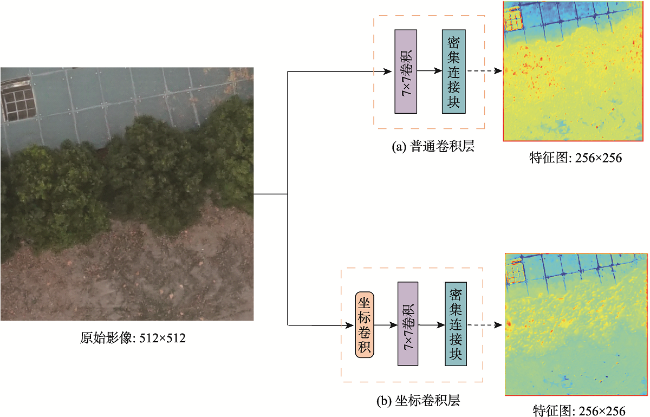
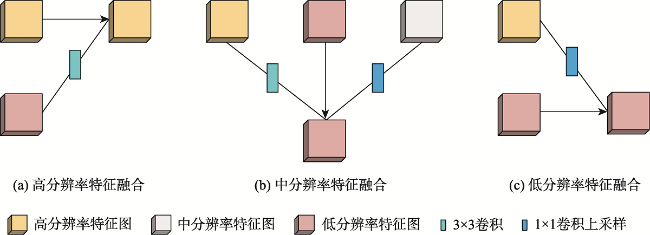
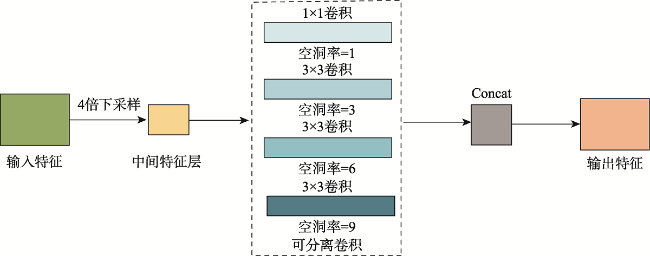
At present, the classification of urban vegetation is affected by similar characteristics and similar spectra, resulting in misclassification of vegetation. Therefore, a Multi-scale Feature Perception Network (MFDN) combined with high-resolution UAV visible light images is designed to classify urban vegetation. This network addresses the problem of misclassification and reduces the loss of spatial information by introducing coordinate convolution in the input layer. It constructs parallel networks to enhance multi-scale feature information and introduces repeated multi-scale fusion modules between networks to maintain high-resolution representation in the entire process and reduce the loss of detailed features. In addition, the separation feature module is added to expand the receptive field and obtain multi-scale features, thereby effectively alleviating the phenomenon of misclassification and omission of urban vegetation. The results show that the MFDN method improves the classification of urban vegetation mainly through spatial patterns rather than spectral information from UAV visible light images. The average overall accuracy is 89.54%, the average F1 score is 75.85%, and the average IOU is 65.45%. The segmentation results are accurate and complete. Therefore, the proposed method is compatible with the easy-to-operate low-cost UAV system, is suitable for rapid survey of urban vegetation, and can provide technical support and scientific basis for urban space utilization and ecological resource survey.
KUAI Yu , WANG Biao , WU Yanglan , CHEN Botao , CHEN Xingdi , XUE Weibao . Urban Vegetation Classification based on Multi-scale Feature Perception Network for UAV Images[J]. Journal of Geo-information Science, 2022 , 24(5) : 962 -980 . DOI: 10.12082/dqxxkx.2022.210572
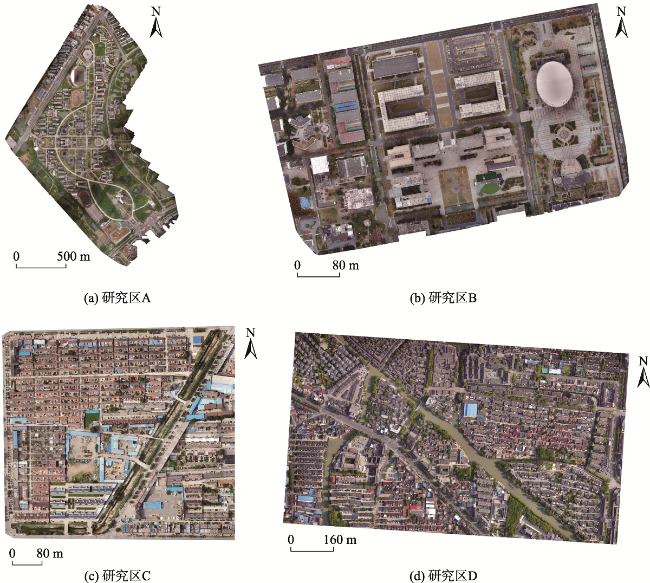
表1 无人机飞行参数Tab. 1 UAV flight parameters |
| 影像 | 研究区A | 研究区B | 研究区C | 研究区D |
|---|---|---|---|---|
| 位置 | 安徽省 | 江苏省 | 山东省 | 江苏省 |
| 高度/m | 260 | 150 | 450 | 450 |
| 分辨率/m | 0.03 | 0.02 | 0.04 | 0.04 |
| 时间 | 2019-05-16 | 2020-11-07 | 2019-05-28 | 2021-05-02 |
| 飞行次数/次 | 1 | 1 | 1 | 1 |
| 航向重叠度/% | 70 | 70 | 70 | 70 |
| 旁向重叠度/% | 80 | 80 | 80 | 80 |
| 图像尺寸/像素 | 57 285×86 854 | 32 066×21 832 | 15 850×15 061 | 34 505×23 399 |
表2 所有测试区域的平均总体精度和平均F1得分Tab. 2 Average overall accuracy and average F1 score of all test areas (%) |
| 区域 | 草地 | 灌丛 | 乔木 | OA | Mean F1 |
|---|---|---|---|---|---|
| 研究区B | 76.77 | 77.95 | 80.94 | 89.87 | 78.55 |
| 研究区C | 66.64 | 58.96 | 80.02 | 86.22 | 68.54 |
| 研究区D | 78.32 | 74.23 | 88.80 | 92.52 | 80.45 |
| 平均精度 | 73.91 | 70.38 | 83.25 | 89.54 | 75.85 |
表3 所有测试区域的IOU和MeanIOU结果Tab. 3 IOU and MeanIOU results for all test areas (%) |
| IOU | Mean IOU | |||
|---|---|---|---|---|
| 草地 | 灌丛 | 乔木 | ||
| 研究区B | 66.95 | 66.77 | 71.30 | 68.34 |
| 研究区C | 54.02 | 47.93 | 70.26 | 57.40 |
| 研究区D | 67.22 | 64.01 | 80.57 | 70.60 |
| 平均精度 | 63.73 | 59.57 | 74.04 | 65.45 |
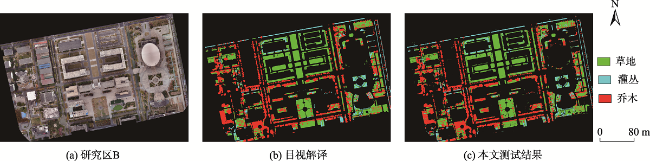
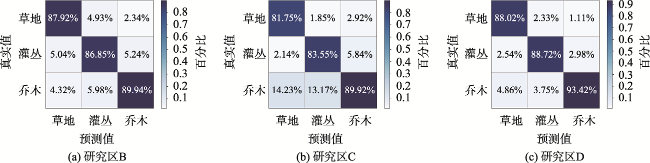
表4 研究区B混淆矩阵精度评价Tab. 4 Accuracy evaluation of confusion matrix in study area B (%) |
| 草地 | 灌丛 | 乔木 | UA | |
|---|---|---|---|---|
| 草地 | 87.92 | 4.93 | 2.34 | 88.40 |
| 灌丛 | 5.04 | 86.85 | 5.24 | 88.37 |
| 乔木 | 4.32 | 5.98 | 89.94 | 93.47 |
| PA | 97.92 | 86.85 | 89.94 | |
| OA 89.87 | Kappa 81.72 | |||
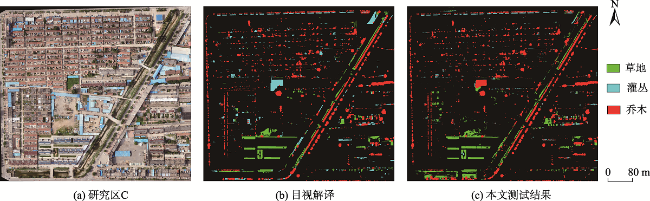
表5 研究区C混淆矩阵精度评价Tab. 5 Accuracy evaluation of confusion matrix in study area C (%) |
| 草地 | 灌丛 | 乔木 | UA | |
|---|---|---|---|---|
| 草地 | 81.75 | 1.85 | 2.92 | 81.40 |
| 灌丛 | 2.14 | 83.55 | 5.84 | 81.77 |
| 乔木 | 14.23 | 13.17 | 89.92 | 89.47 |
| PA% | 81.75 | 83.55 | 89.92 | |
| OA 86.22 | Kappa 78.57 | |||
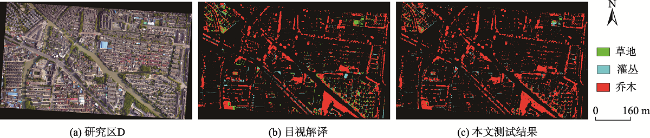
表6 研究区D混淆矩阵精度评价Tab. 6 Accuracy evaluation of confusion matrix in study area D (%) |
| 草地 | 灌丛 | 乔木 | UA | |
|---|---|---|---|---|
| 草地 | 88.02 | 2.33 | 1.11 | 86.53 |
| 灌丛 | 2.54 | 88.72 | 2.98 | 88.98 |
| 乔木 | 4.86 | 3.75 | 93.42 | 94.05 |
| PA | 88.02 | 88.72 | 93.42 | |
| OA 92.52 | Kappa 84.74 | |||
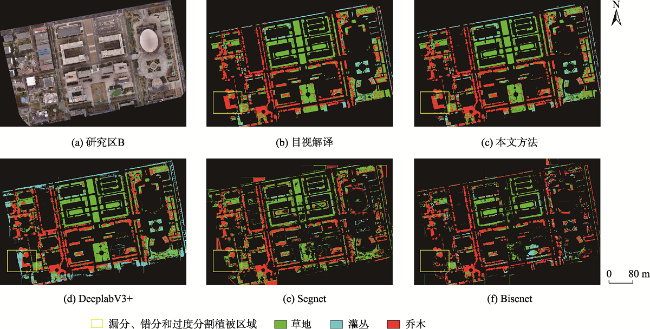
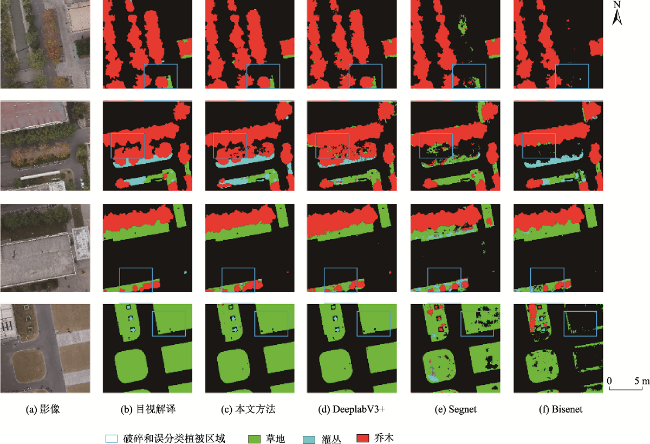
图13 不同深度学习方法在研究区B植被分类结果Fig. 13 Vegetation classification results of different deep learning methods in study area B |
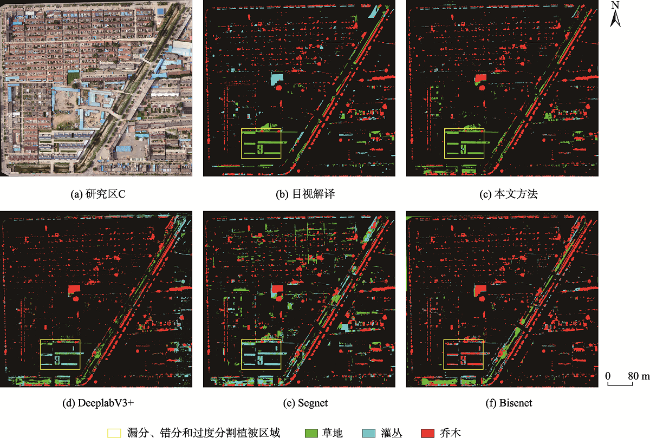
图14 不同深度学习方法在研究区C植被分类结果Fig. 14 Vegetation classification results of different deep learning methods in study area C |
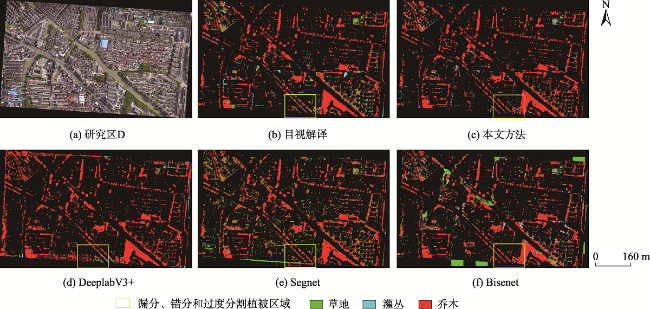
图15 不同深度学习方法在研究区D植被分类结果Fig. 15 Vegetation classification results of different deep learning methods in study area D |
表7 不同深度学习方法在3个测试区域的OA和F1结果Tab. 7 OA and F1 results of different deep learning methods in three test areas (%) |
| 区域 | 方法 | 草地 | 灌丛 | 乔木 | OA | Mean F1 |
|---|---|---|---|---|---|---|
| 研究区B | MFDN | 76.77 | 77.95 | 80.94 | 89.87 | 78.55 |
| DeeplabV3+ | 72.21 | 69.45 | 75.66 | 87.64 | 72.11 | |
| Segnet | 53.70 | 58.05 | 64.08 | 83.45 | 58.61 | |
| Bisenet | 50.01 | 45.66 | 63.98 | 79.01 | 53.19 | |
| 研究区C | MFDN | 66.64 | 58.96 | 80.02 | 86.22 | 68.54 |
| DeeplabV3+ | 63.23 | 58.24 | 74.55 | 83.18 | 65.34 | |
| Segnet | 48.70 | 50.01 | 71.11 | 80.91 | 56.61 | |
| Bisenet | 31.62 | 42.14 | 68.77 | 78.17 | 47.51 | |
| 研究区D | MFDN | 78.32 | 74.23 | 88.80 | 92.52 | 80.45 |
| DeeplabV3+ | 70.21 | 69.55 | 83.92 | 90.83 | 74.56 | |
| Segnet | 72.21 | 60.06 | 71.66 | 82.31 | 67.97 | |
| Bisenet | 39.01 | 43.74 | 72.06 | 76.66 | 51.60 |
表8 不同深度学习方法在3个测试区域的IOU结果Tab. 8 IOU results of different deep learning methods in three test areas (%) |
| IOU | Mean IOU | ||||
|---|---|---|---|---|---|
| 草地 | 灌丛 | 乔木 | |||
| 研究区B | MFDN | 66.95 | 66.77 | 71.30 | 68.34 |
| DeeplabV3+ | 61.71 | 60.80 | 65.75 | 62.42 | |
| Segnet | 46.65 | 43.42 | 52.96 | 48.34 | |
| Bisenet | 40.15 | 35.98 | 43.61 | 39.91 | |
| 研究区C | MFDN | 54.02 | 47.93 | 70.26 | 57.40 |
| DeeplabV3+ | 50.11 | 46.33 | 65.01 | 56.75 | |
| Segnet | 40.07 | 41.22 | 60.27 | 47.18 | |
| Bisenet | 20.97 | 31.07 | 57.66 | 36.56 | |
| 研究区D | MFDN | 67.22 | 64.01 | 80.57 | 70.60 |
| DeeplabV3+ | 61.44 | 60.62 | 74.35 | 65.47 | |
| Segnet | 62.36 | 50.97 | 56.98 | 56.77 | |
| Bisenet | 28.96 | 32.77 | 61.43 | 41.05 | |
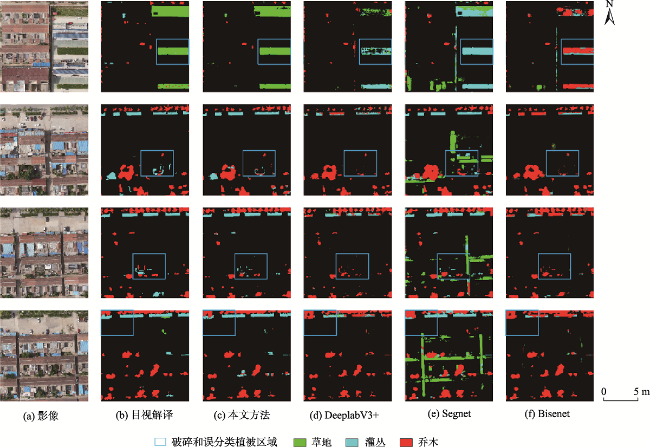
图16 不同深度学习方法在研究区B植被分类结果细节展示Fig. 16 Detailed display of vegetation classification results of different deep learning methods in study area B |
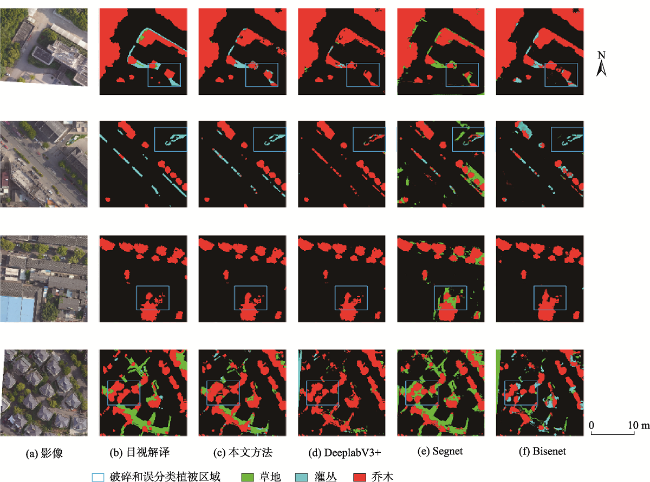
图17 不同深度学习方法在研究区C植被分类结果细节展示Fig. 17 Detailed display of vegetation classification results of different deep learning methods in study area C |
表9 网络效率对比分析Tab. 9 Comparative analysis of network efficiency |
| 方法 | 浮点运算数(Flops)/G | 参数数量(Params)/百万 | 测试时间/s | 空间占用/M |
|---|---|---|---|---|
| MFDN | 246.54 | 50.28 | 6.21 | 191 |
| DeeplabV3+ | 333.77 | 59.35 | 7.18 | 679 |
| Segnet | 150.18 | 8.91 | 4.08 | 102 |
| Bisenet | 84.38 | 6.33 | 3.48 | 72 |
表10 5种植被分类方法的评价指标对比Tab. 10 Comparison of evaluation indexes of five planting classification methods (%) |
| 研究区B | 研究区C | 研究区D | |||||||
|---|---|---|---|---|---|---|---|---|---|
| OA | F1 | IOU | OA | F1 | IOU | OA | F1 | IOU | |
| MFDN | 89.87 | 78.55 | 68.34 | 86.22 | 68.54 | 57.40 | 92.52 | 80.45 | 70.60 |
| MFDN-noCoord | 88.29 | 75.51 | 65.52 | 84.69 | 66.24 | 57.29 | 90.86 | 78.45 | 64.80 |
| MFDN-noRMF | 87.15 | 71.62 | 59.55 | 83.55 | 64.33 | 54.87 | 89.94 | 74.06 | 62.04 |
| MFDN-noDSC | 88.03 | 71.76 | 60.19 | 83.72 | 65.21 | 55.56 | 90.77 | 77.17 | 67.26 |
| MFDN-Baseline | 86.76 | 68.56 | 58.66 | 82.23 | 60.94 | 51.44 | 89.02 | 72.52 | 61.74 |
| [1] |
李莹, 于海洋, 王燕, 等. 基于无人机重建点云与影像的城市植被分类[J]. 国土资源遥感, 2019, 31(1):152-158.
[
|
| [2] |
刘保生. 基于高分辨率IKONOS影像的城市植被信息提取方法浅析[J]. 测绘通报, 2016(S1):182-184,187.
[
|
| [3] |
汪雪淼, 孟庆岩, 赵少华, 等. GF-2在城市绿地分类及景观格局度量中的应用[J]. 地球信息科学学报, 2020, 22(10):1971-1982.
[
|
| [4] |
浮媛媛, 赵云升, 赵文利, 等. 基于多源亮度温度的城市典型植被分类研究[J]. 激光与光电子学进展, 2015, 52(7):267-272.
[
|
| [5] |
|
| [6] |
皮新宇, 曾永年, 贺城墙. 融合多源遥感数据的高分辨率城市植被覆盖度估算[J]. 遥感学报, 2021, 25(6):1216-1226.
[
|
| [7] |
王美雅, 徐涵秋. 中国大城市的城市组成对城市热岛强度的影响研究[J]. 地球信息科学学报, 2018, 20(12):1787-1798.
[
|
| [8] |
姚方方, 骆剑承, 沈占锋, 等. 高分辨率影像城市植被自动提取算法[J]. 地球信息科学学报, 2016, 18(2):248-254.
[
|
| [9] |
|
| [10] |
|
| [11] |
赵云景, 龚绪才, 杜文俊, 等. 基于无人机图像颜色指数的植被识别[J]. 国土资源遥感, 2016, 28(1):78-86.
[
|
| [12] |
林志玮, 涂伟豪, 黄嘉航, 等. 基于FC-DenseNet的低空航拍光学图像树种识别[J]. 国土资源遥感, 2019, 31(3):225-233.
[
|
| [13] |
|
| [14] |
|
| [15] |
戴鹏钦, 丁丽霞, 刘丽娟, 等. 基于FCN的无人机可见光影像树种分类[J]. 激光与光电子学进展, 2020, 57(10):101001.
[
|
| [16] |
|
| [17] |
|
| [18] |
|
| [19] |
耿仁方, 付波霖, 蔡江涛, 等. 基于无人机影像和面向对象随机森林算法的岩溶湿地植被识别方法研究[J]. 地球信息科学学报, 2019, 21(8):1295-1306.
[
|
| [20] |
周欣昕, 吴艳兰, 李梦雅, 等. 基于特征分离机制的深度学习植被自动提取方法[J]. 地球信息科学学报, 2021, 23(9):1675-1689.
[
|
| [21] |
|
| [22] |
|
| [23] |
|
| [24] |
张军国, 韩欢庆, 胡春鹤, 等. 基于无人机多光谱图像的云南松虫害区域识别方法[J]. 农业机械学报, 2018, 49(5):249-255.
[
|
| [25] |
|
| [26] |
肖武, 任河, 吕雪娇, 等. 基于无人机遥感的高潜水位采煤沉陷湿地植被分类[J]. 农业机械学报, 2019, 50(2):184-193.
[
|
| [27] |
|
| [28] |
井然, 邓磊, 赵文吉, 等. 基于可见光植被指数的面向对象湿地水生植被提取方法[J]. 应用生态学报, 2016, 27(5):1427-1436.
[
|
| [29] |
|
| [30] |
|
| [31] |
|
| [32] |
|
| [33] |
|
| [34] |
|
| [35] |
|
| [36] |
|
| [37] |
|
| [38] |
林志玮, 涂伟豪, 黄嘉航, 等. 深度语义分割的无人机图像植被识别[J]. 山地学报, 2018, 36(6):135-145.
[
|
| [39] |
|
| [40] |
|
| [41] |
|
| [42] |
|
| [43] |
|
| [44] |
|
| [45] |
|
| [46] |
|
| [47] |
|
/
| 〈 |
|
〉 |