
Journal of Geo-information Science >
Spatio-temporal Evolution and the Multi-scale Socio-economic Influencing Mechanism of PM2.5 in the Yellow River Basin during the China's 13th Five-Year Plan
Received date: 2021-09-06
Revised date: 2021-10-09
Online published: 2022-08-25
Supported by
National Natural Science Foundation of China(42041007)
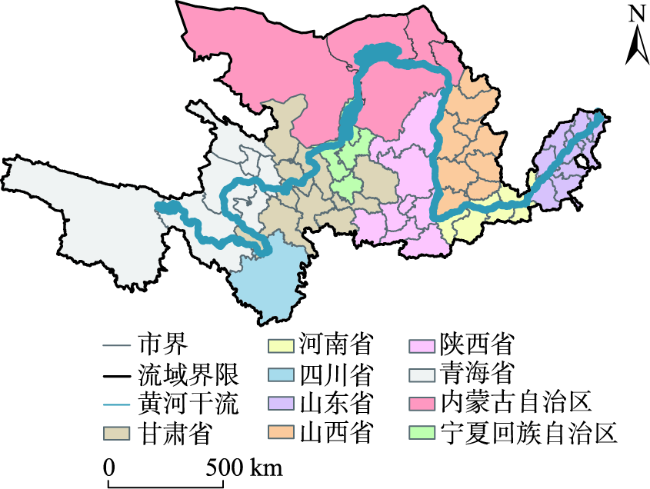
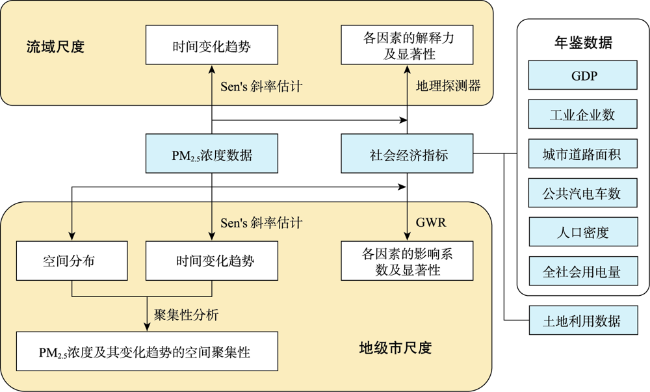
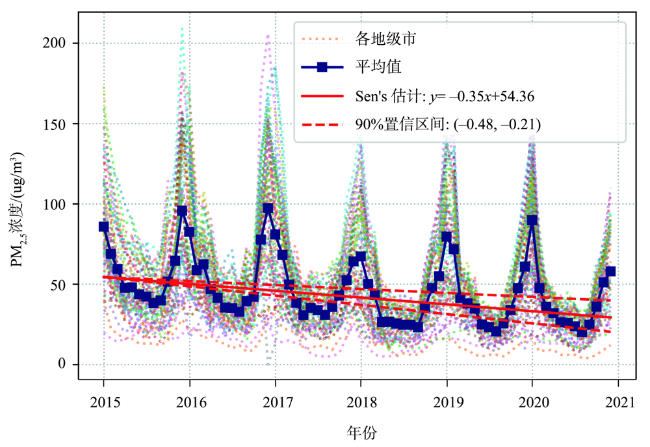
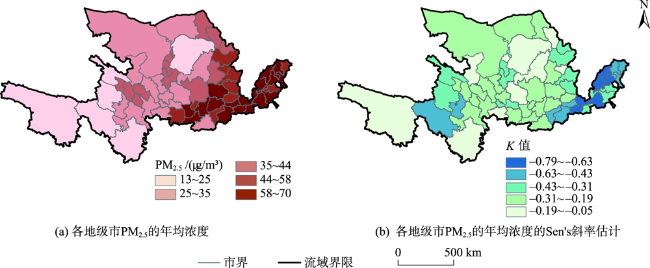
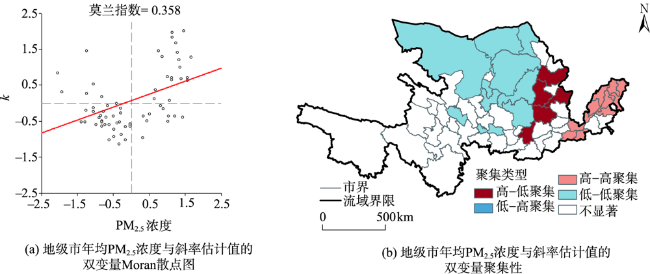
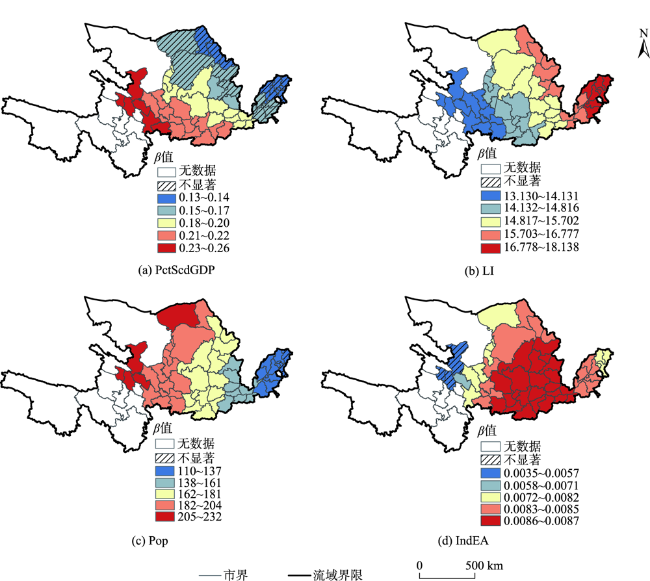
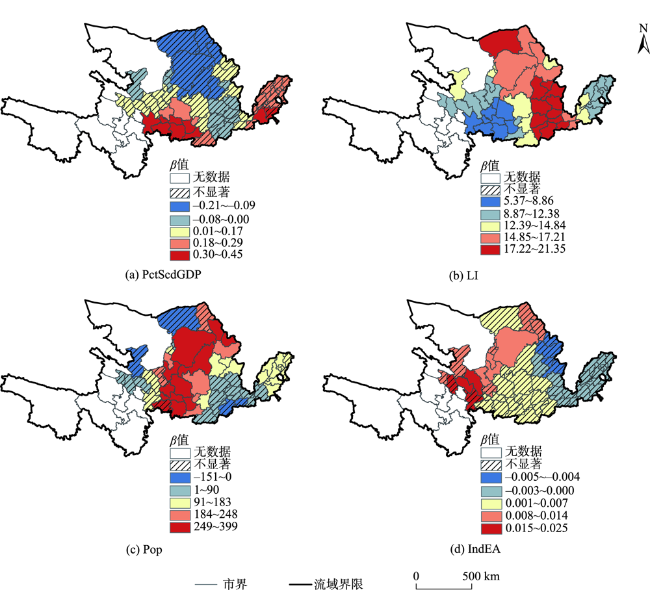
The ecological protection and high-quality development of the Yellow River Basin is a major mission in the new era of China, and the air pollution abatement is among the necessities of the high-quality development. It is of great significance to explore the spatiotemporal variation of PM2.5 and its socio-economic influencing mechanisms for the air pollution abatement and high-quality development of the Yellow River Basin. By conducting time series estimation, spatial autocorrelation analysis, geodetector, and geographically weighted regression, this paper reveals the spatiotemporal variations and trends of PM2.5 concentration from 2015 to 2020 in the Yellow River Basin, and quantitatively explores the driving mechanism of socio-economic factors on both watershed scale and city scale. The main findings are as follows: (1) During the study period, the Yellow River Basin has an overall reduction in PM2.5 pollution. The PM2.5 concentration decreases with a fluctuating downward trend of 4.2 μg/m3 per year on average; (2) The PM2.5 concentrations in Shandong and Henan are high but decrease fast, whereas the concentrations in Shanxi and Shaanxi are also high but decrease slowly; (3) Future prediction based on the current trend shows that among the 61 cities in the Yellow River Basin, 54 cities will achieve the goal asserted in the 14th Five Year Plan of China, which proposes to reduce PM2.5 concentration by 10% in 2025. However, it would be a struggle for other 7 cities, i.e., Jincheng, Xi'an, Yulin, Taiyuan, Linfen, and Yuncheng, to meet the policy requirement due to their heavier pollution and slower improvements; (4) Population density, industrial enterprises amount, and land use intensity are the main socio-economic factors leading to the increasement of PM2.5 concentration in the Yellow River Basin, of which the explanatory power reached more than 50%; (5) From 2015 to 2019, the main regions influenced by high land use intensity and population density are transferred to the central part of the Yellow River Basin, which indicates that Shanxi, Shaanxi, and Inner Mongolia should be regarded as the key area to carry out the PM2.5 control programs; (6) Promoting the urban-rural development coordinated with environmental carrying capacity, as well as controlling the industrial scale and improving the environmental protection level of industrial enterprises are practical strategies to control the PM2.5 pollution in the Yellow River basin. Findings of this study are expected to provide theoretical reference for relevant decision makers in order to boost the high-quality development of the Yellow River Basin.

GENG Jiachen , SHEN Shi , CHENG Changxiu . Spatio-temporal Evolution and the Multi-scale Socio-economic Influencing Mechanism of PM2.5 in the Yellow River Basin during the China's 13th Five-Year Plan[J]. Journal of Geo-information Science, 2022 , 24(6) : 1163 -1175 . DOI: 10.12082/dqxxkx.2022.210534
表1 数据来源及描述Tab. 1 Data source and description |
| 数据 | 描述 | 来源 |
|---|---|---|
| 行政区划 | 2015年中国地市行政边界矢量数据 | https://www.resdc.cn/ |
| PM2.5浓度值 | 2015—2020年逐月空气质量数据,基于全国367个城市的站点实测 | https://www.aqistudy.cn/ |
| 土地利用 | 2015年和2020年基于Landsat TM影像的1 km分辨率栅格数据 | https://www.resdc.cn/ |
| 社会经济数据 | 中国国家统计局,2016—2020年《中国城市年鉴》 | http://www.stats.gov.cn/ |
表2 社会经济因素的指标体系Tab. 2 Indicators of socio-economic factors |
| 社会经济因素 | 变量名 | 描述 |
|---|---|---|
| 产业结构 | GDP | 当年价格/亿元 |
| GDP_P1 | 第一产GDP占比/% | |
| GDP_P2 | 第二产GDP占比/% | |
| GDP_P3 | 第三产GDP占比/% | |
| IndEA | 工业企业数量/个 | |
| 市政交通 | UrbRA | 城市道路面积/万m2 |
| Bus | 公共汽电车拥有量/辆 | |
| 开发强度 | LI | 土地利用程度指数,LI∈[1, 4] |
| Pop | 人口密度/(万人/km2) | |
| 能源消耗 | Elc | 全社会用电量/(万kW/h) |
表3 土地利用程度分级赋值Tab. 3 Classification of land use degree |
| 未利用土地级 | 林、草、水用地级 | 农业用地级 | 城镇聚落用地级 | |
|---|---|---|---|---|
| 土地利用类型 | 未利用地或难利用地 | 林地、草地、水域 | 耕地、园地、人工草地 | 城镇、居民点、工矿用地、交通用地 |
| 分级指数 | 1 | 2 | 3 | 4 |
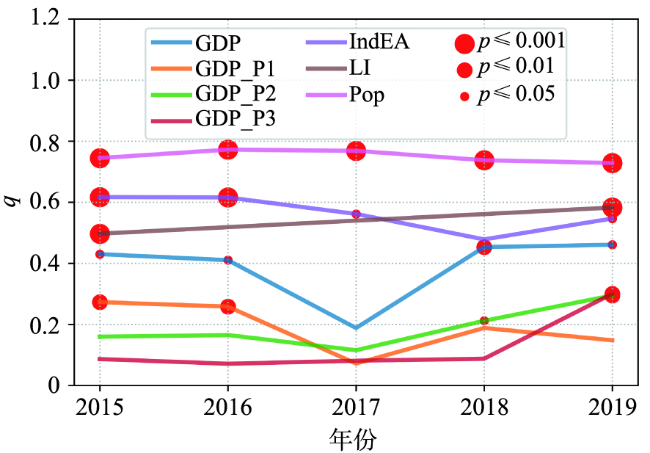
表4 社会经济因子对PM2.5的解释力及显著性Tab. 4 The GeoDetector q-statisticand and significance of socioeconomic factors on PM2.5 |
| 社会经 济因子 | 2015年 | 2016年 | 2017年 | 2018年 | 2019年 | |||||||||
|---|---|---|---|---|---|---|---|---|---|---|---|---|---|---|
| q | p | q | p | q | p | q | p | q | p | |||||
| GDP | 0.43 | 0.0229* | 0.41 | 0.0373* | 0.19 | 0.9520 | 0.45 | 0.0088** | 0.46 | 0.0149* | ||||
| GDP_P1 | 0.27 | 0.0071** | 0.26 | 0.0092** | 0.07 | 0.6521 | 0.19 | 0.1292 | 0.15 | 0.3571 | ||||
| GDP_P2 | 0.16 | 0.2463 | 0.17 | 0.0858 | 0.12 | 0.4193 | 0.21 | 0.0424* | 0.29 | 0.0045** | ||||
| GDP_P3 | 0.09 | 0.6530 | 0.07 | 0.6956 | 0.08 | 0.6823 | 0.09 | 0.3958 | 0.30 | 0.0028** | ||||
| IndEA | 0.62 | 0.0001*** | 0.62 | 0.0001*** | 0.56 | 0.0442* | 0.48 | 0.0861 | 0.55 | 0.0154* | ||||
| UrbRA | 0.20 | 0.9243 | 0.21 | 0.8495 | 0.16 | 0.9362 | 0.14 | 0.9106 | 0.13 | 0.9720 | ||||
| Bus | 0.17 | 0.9940 | 0.22 | 0.9822 | 0.25 | 0.9642 | 0.16 | 0.9745 | 0.19 | 0.9926 | ||||
| LI | 0.50 | 0.0001*** | - | - | - | - | - | - | 0.58 | 0.0001*** | ||||
| Elc | 0.11 | 0.9855 | 0.11 | 0.9905 | 0.19 | 0.8483 | 0.10 | 0.9617 | 0.25 | 0.7489 | ||||
| Pop | 0.74 | 0.0001*** | 0.77 | 0.0001*** | 0.77 | 0.0001*** | 0.74 | 0.0001*** | 0.73 | 0.0001*** | ||||
注:*p<0.05;**p<0.01;***p<0.001。 |
| [1] |
杨永春, 穆焱杰, 张薇. 黄河流域高质量发展的基本条件与核心策略[J]. 资源科学, 2020, 42(3):409-423.
[
|
| [2] |
|
| [3] |
中华人民共和国生态环境部. 2019年全国生态环境质量简况[J]. 环境保护, 2020, 48(10):8-10.
Ministry of Ecology and Environment of the People’s Republic of China. Brief introduction of national ecological environment quaility in 2019. Environmental Protection, 2020, 48(10):8-10. ] DOI: 10.14026/j.cnki.0253-9705.2020.10.002
|
| [4] |
|
| [5] |
|
| [6] |
|
| [7] |
|
| [8] |
|
| [9] |
|
| [10] |
刘海猛, 方创琳, 黄解军, 等. 京津冀城市群大气污染的时空特征与影响因素解析[J]. 地理学报, 2018, 73(1):177-191.
[
|
| [11] |
王敏, 冯相昭, 杜晓林, 等. 黄河流域空气质量时空分布及影响因素分析[J]. 环境保护, 2019, 47(24):56-61.
[
|
| [12] |
|
| [13] |
|
| [14] |
|
| [15] |
|
| [16] |
|
| [17] |
|
| [18] |
|
| [19] |
李衡, 韩燕. 黄河流域PM2.5时空演变特征及其影响因素分析[J/OL]. 世界地理研究:1-14[2021-09-30]
[
|
| [20] |
陈世强, 张航, 齐莹, 等. 黄河流域雾霾污染空间溢出效应与影响因素[J]. 经济地理, 2015, 40(5):40-48.
[
|
| [21] |
|
| [22] |
|
| [23] |
|
| [24] |
|
| [25] |
|
| [26] |
|
| [27] |
|
| [28] |
庄大方, 刘纪远. 中国土地利用程度的区域分异模型研究[J]. 自然资源学报, 1997, 12(2):105-111.
[
|
| [29] |
|
| [30] |
|
| [31] |
|
| [32] |
王劲峰, 徐成东. 地理探测器:原理与展望[J]. 地理学报, 2017, 72(1):116-134.
[
|
| [33] |
|
| [34] |
覃文忠. 地理加权回归基本理论与应用研究[D]. 上海: 同济大学, 2007.
[The basic theoretics and application research on geographically weighted regression[D]. Shanghai: Tongji University, 2007. ]
|
| [35] |
臧振峰, 张凤英, 李永华, 等. 我国主要粮产区PM2.5、PM10时空分布特征及影响因素--以河南省为例[J]. 自然资源学报, 2021, 36(5):1163-1175.
[ Spatio-temporal distribution and affecting factors of PM2.5 and PM10 in major grain producing areas in China: A case study of Henan province[J]. Journal of Natural Resources, 2021, 36(5):1163-1175. ] DOI: 10.31497/zrzyxb.20210506
|
| [36] |
郑菊花, 申伟宁. 黄河中下游地区空气质量溢出效应与驱动因素[J]. 统计与决策, 2021, 37(14):66-69.
[
|
| [37] |
程昌秀, 沈石, 李强坤. 黄河流域人地系统研究的大数据支撑与方法探索[J]. 中国科学基金, 2021, 35(4):529-536.
[
|
| [38] |
马歆, 和舒敏, 黄婷婷, 等. 城市用地扩张的时空格局特征及驱动因素分析--以中原城市群为例[J]. 生态经济, 2020, 36(3):105-112.
[
|
| [39] |
|
| [40] |
|
| [41] |
黄小刚, 邵天杰, 赵景波, 等. 汾渭平原PM2.5浓度的影响因素及空间溢出效应[J]. 中国环境科学, 2019, 39(8):3539-3548.
[
|
| [42] |
|
| [43] |
王胜杰, 解淑艳, 王军霞, 等. 2016-2019年汾渭平原城市空气质量状况分析[J]. 中国环境监测, 2020, 36(6):57-65.
[
|
| [44] |
赵柄鉴, 文传浩, 唐中林. 黄河生态经济带空气质量时空分异研究(2015-2018)[J]. 长江流域资源与环境,2021, 30(4):900-914.
[
|
| [45] |
程昌秀, 史培军, 宋长青, 等. 地理大数据为地理复杂性研究提供新机遇[J]. 地理学报, 2018, 73(8):1397-1406.
[ Geographic big-data: A new opportunity for geography complexity study[J]. Acta Geographica Sinica, 2018, 73(8):1397-1406. ] DOI: 10.11821/dlxb201808001
|
| [46] |
|
| [47] |
|
/
| 〈 |
|
〉 |