
Journal of Geo-information Science >
Research on the Relationship between Floating Population's Sentiments and Distribution of Working and Living in Beijing based on Microblog Data
Received date: 2021-12-30
Revised date: 2022-02-24
Online published: 2022-12-25
Supported by
National Natural Science Foundation of China(42071436)
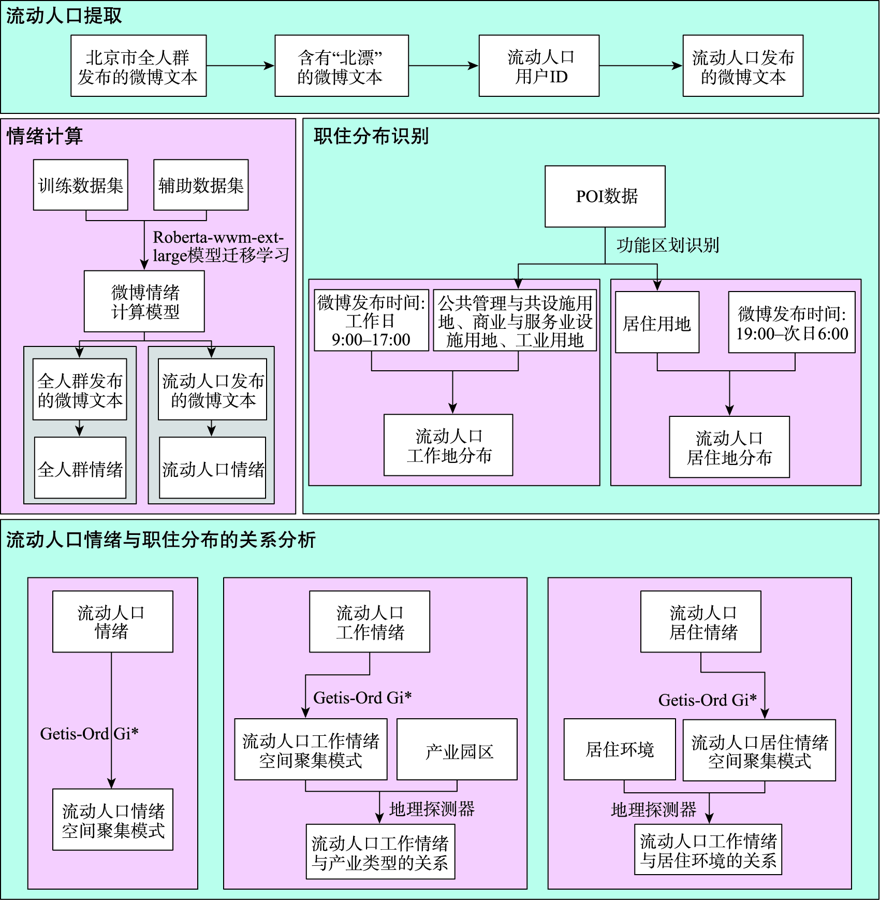
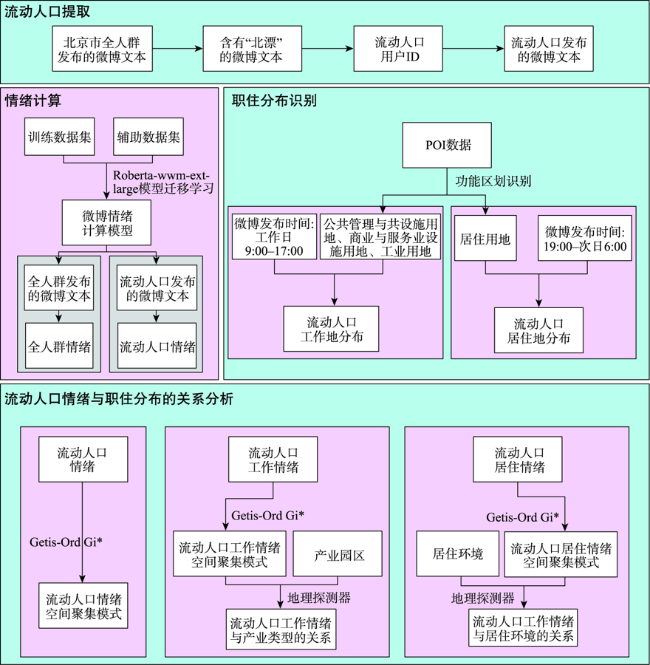
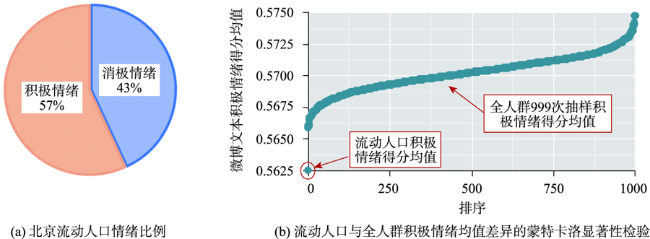
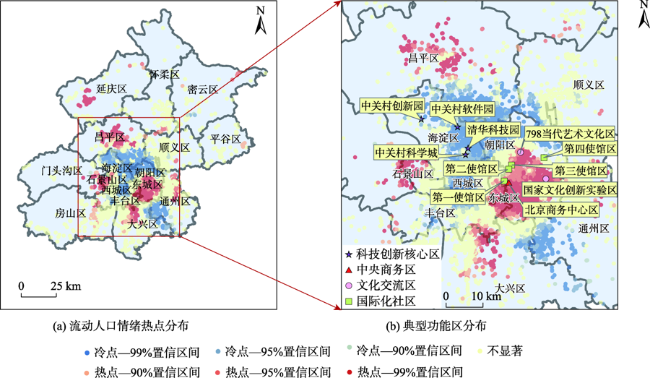
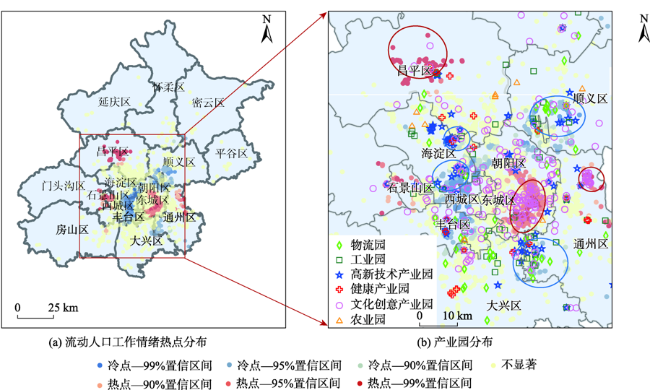
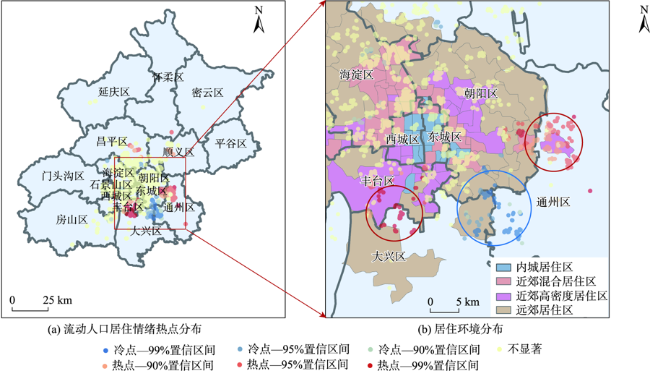
The floating population is an essential part of the urban population, and their working and living status are of great significance to urban stability. The working and living status of the floating population can be directly reflected in their sentiments. On the contrary, their working and living status can also be detected from their sentiments. Firstly, we used jieba word separation technology and manual screening to obtain the microblog texts published by the Beijing floating population based on the microblog big data in 2017. Secondly, we identified the sentimental tendency of microblog texts for the whole population and the floating population in Beijing by transfer learning the natural language processing pre-training model (Roberta-wwm-ext-large). Then, we obtained the working and living distribution of the floating population with POI data and the published time of microblog texts. Finally, we got the floating population's working and living sentiments through their microblog sentiments and working and living distribution, mined the spatial aggregation pattern of their working and living sentiments with spatial analysis methods such as Getis-Ord Gi*, and analyzed the factors that may affect the hot spots' distribution of working and living sentiments of the floating population in Beijing with geodetector. The experiment shows that the average sentiment of the floating population in Beijing (0.56) is lower than that of the whole Beijing population (0.57) at 99.9% confidence level. Overall, the sentiments of the floating population are positive. As for the spatial distribution, the sentiments of the floating population in the core areas such as Dongcheng district and Xicheng district are balanced. The sentiments in the northwest technology and innovation district are more negative relative to the average sentiment of the floating population, while the sentiments in the southeast central business district, cultural exchange district, and the international community are more positive. In terms of the relationship between the floating population's sentiments and distribution of working and living, the working sentiments of the floating population are related to the type of work they are engaged in (q=0.03, P<0.05). In detail, the floating population working in high-tech industrial parks, industrial parks, and logistics industrial parks are more negative relative to the average working sentiment of the floating population, while those working in the health industrial parks, cultural and creative industrial parks, and agricultural parks are more positive. Besides, the living sentiments of the floating population are related to the living environment (q=0.06, P<0.1). The floating population living in the distance suburban residential area are more negative relative to the average living sentiment of the floating population, while those living in the near suburban high-density residential area are more positive. In general, the average living sentiment of the population (0.55) is significantly lower than the average working sentiment (0.58). Therefore, focusing on the floating population engaged in high-tech industry, industry, and logistics industry as well as improving the living satisfaction of the floating population living in the distance suburban residential area is vital for constructing a city with a stable work-life and livable environment.
ZHAO Tong , LI Zefeng , SONG Liuyi , XIONG Meicheng , LIAO Yilan , PEI Tao . Research on the Relationship between Floating Population's Sentiments and Distribution of Working and Living in Beijing based on Microblog Data[J]. Journal of Geo-information Science, 2022 , 24(10) : 1898 -1910 . DOI: 10.12082/dqxxkx.2022.210838
表1 微博文本数据示例Tab. 1 Sample data of microblog content |
| 内容 | 发布时间 | 经度/°E | 纬度/°N | 用户ID | 手机型号 |
|---|---|---|---|---|---|
| 新一年的北漂又开始啦 | 2017-07-24 12:09:00 | 116.43 | 39.85 | 1048664607 | OPPO R9s Plus |
| 北漂十年风雨路,而今迈步从头越 | 2017-07-09 13:05:00 | 116.23 | 39.91 | 1210865835 | iPhone 7 Plus |
表2 训练数据集与辅助数据集说明Tab. 2 Description of training datasets and secondary datasets |
| 数据集 | 样本数量/个 | 说明 |
|---|---|---|
| simplifyweibo_4_moods | 361 744 | 带情绪标注的新浪微博文本,包含4种情感情绪,其中喜悦约20万条,愤怒、厌恶、低落各约5万条。本研究将喜悦作为积极情绪,愤怒、厌恶、低落合并为消极情绪 |
| weibo_senti_100k | 119 988 | 带情绪标注的新浪微博文本,正负样本各占一半 |
| NLPCC2014 | 12 500 | NLPCC2014比赛数据集,内容为新浪微博文本,正负样本各占一半 |
| ChnSentiCorp | 12 000 | 酒店评论数据,其中正、负类样本约各占一半 |
| Online_shopping_10_cats | 627 74 | 10个类别的购物评论文本,正、负向评论各约3万条 |
| Waimai_10K | 11 987 | 某外卖平台收集的用户评价,正向4000条,负向约8000条 |
表3 产业园区分类汇总Tab. 3 Classified summary information of industrial parks |
| 原始产业园区类别 | 二级分类 | 一级分类 |
|---|---|---|
| 电子、智能、IT软件、智能制造、互联网、新材料、生物科技、国家大学、循环经济、新能源、电子信息、大数据、航空航天、节能、物联网、机器人、航空、新兴产业、通信、高端装备、新能源汽车、激光、人工智能 | 高新技术产业园 | 高新技术产业园 |
| 食品、化工、材料、光电、汽车、环保、服装、纺织、能源、建材、建筑、家居、机电、家具、包装印刷、陶瓷、汽车零部件、电器、光伏、模具、轻纺、精细化工、工业设计、电气、玻璃 | 一般工业园 | 一般工业园 |
| 物流园、电子商务、跨境电商、电商物流、冷链物流 | 物流园 | 专业园 |
| 现代农业、农产品、生态农业 | 农业园 | |
| 健康、医药、生物医药、医疗、医疗器械、大健康 | 健康产业园 | |
| 文化、文化创意、教育、艺术、广告、时尚、影视、特色小镇、体育、动漫、酒、珠宝、汽车文化、丝绸 | 文化创意产业园 |
注:分类标准参考自《中国产业园规划布局与运营管理分析报告》[28]。 |
表4 居住环境分类特征Tab. 4 Classification characteristics of living environment |
| 居住环境 | 特征 |
|---|---|
| 内城异质性居住区 | 可达性非常高、服务设施丰富、道路连通性强、人口多样性高 |
| 内城同质性居住区 | 可达性很高、人口多样性单一 |
| 近郊职住混合区 | 可达性一般、人口多样性高、容积率高的就业-居住混合区 |
| 近郊高密度居住区 | 可达性一般、容积率高、高学历多样性、年龄结构单一 |
| 远郊职住混合区 | 可达性低、土地利用强度低、服务配置设施不完善、人口结构单一 |
| 远郊低可达性居住区 | 可达性与土地利用强度极低、服务配置设施很不完善、人口受教育程度低 |
图4 北京流动人口工作情绪热点与产业园对比分布注:图(b)中蓝圈表示高新技术产园区、物流园区与工业园区;红圈表示文化创意产业园区。 Fig. 4 Comparison of the floating population's working sentiment hotspots distribution and industrial park distribution in Beijing |
表5 工作情绪与产业园类型地理探测器结果Tab. 5 Geodetector's result of working sentiments and industrial park type |
| 产业园类型 | 物流园 | 工业园 | 高新技术产业园 | 健康产业园 | 文化创意产业园 | 农业园 |
|---|---|---|---|---|---|---|
| Gi-Bin平均值 | -0.50 | -0.32 | -0.26 | 0.05 | 0.14 | 0.22 |
图5 北京流动人口居住情绪热点与居住环境对比分布注:居住情绪冷点主要位于远郊居住区(图(b)中蓝圈),热点主要位于近郊高密度居住区(图(b)中红圈)。 Fig. 5 Comparison of the floating population's living sentiment hotspots distribution and living environment distribution in Beijing |
表6 居住情绪与居住环境地理探测器结果Tab. 6 Geodetector's result of living sentiments and living environment |
| 居住环境 | 远郊居住区 | 内城居住区 | 近郊职住混合区 | 近郊高密度居住区 |
|---|---|---|---|---|
| Gi-Bin平均值 | -0.12 | 0 | 0.01 | 0.27 |
| [1] |
任远, 邬民乐. 城市流动人口的社会融合:文献述评[J]. 人口研究, 2006(3):87-94.
[
|
| [2] |
段成荣, 杨舸, 张斐, 等. 改革开放以来我国流动人口变动的九大趋势[J]. 人口研究, 2008(6):30-43.
[
|
| [3] |
|
| [4] |
|
| [5] |
|
| [6] |
谢霏雰, 陈宏胜, 刘于琪, 等. 中国大城市流动人口幸福感研究——以上海为例[J]. 现代城市研究, 2015(12):2-8.
[
|
| [7] |
杨东亮, 陈思思. 北京地区流动人口幸福感的影响因素研究[J]. 人口学刊, 2015, 37(5):63-72.
[
|
| [8] |
许世存. 城市适应对流动人口主观幸福感的影响分析——以黑龙江省为例[J]. 人口学刊, 2015, 37(4):36-47.
[
|
| [9] |
黄嘉文. 流动人口主观幸福感及其代际差异[J]. 华南农业大学学报(社会科学版), 2015, 14(2):122-133.
[
|
| [10] |
张华初. 流动人口主观幸福感的影响因素——以广州市为例[J]. 城市问题, 2014(10):90-95.
[
|
| [11] |
|
| [12] |
李然, 林政, 林海伦, 等. 文本情绪分析综述[J]. 计算机研究与发展, 2018, 55(1):30-52.
[
|
| [13] |
|
| [14] |
|
| [15] |
韩珂珂, 邢子瑶, 刘哲, 等. 重大公共卫生事件中的舆情分析方法研究——以新冠肺炎疫情为例[J]. 地球信息科学学报, 2021, 23(2):331-340.
[
|
| [16] |
赵飞, 廖永丰. 突发自然灾害事件网络舆情传播特征及影响因素研究[J]. 地球信息科学学报, 2021, 23(6):992-1001.
[
|
| [17] |
郭星华, 邢朝国. 高学历青年流动人口的社会认同状况及影响因素分析——以北京市为例[J]. 中州学刊, 2009(6):103-108.
[
|
| [18] |
谢永俊, 彭霞, 黄舟, 等. 基于微博数据的北京市热点区域意象感知[J]. 地理科学进展, 2017, 36(9):1099-1110.
[
|
| [19] |
丁兆云, 贾焰, 周斌. 微博数据挖掘研究综述[J]. 计算机研究与发展, 2014, 51(4):691-706.
[
|
| [20] |
SophonPlus. simplifyweibo_4_moods[EB/OL]. https://pan.baidu.com/s/16c93E5x373nsGozyWevITg.
|
| [21] |
SophonPlus. weibo_senti_100k[EB/OL]. https://github.com/SophonPlus/ChineseNlpCorpus/blob/master/datasets/weibo_senti_100k/intro.ipynb
|
| [22] |
自然语言处理与中文计算会议. NLPCC2014[EB/OL]. https://gitee.com/liaojingzhen/NLPCC2014_sentiment.
[T he Conference on Natural Language Processing and Chinese Computing. NLPCC2014[EB/OL]. https://gitee.com/liaojingzhen/NLPCC2014_sentiment.
|
| [23] |
百度飞桨团队. ChnSentiCorp[EB/OL]. https://github.com/PaddlePaddle/PaddleHub/blob/release/v2.2/docs/docs_ch/api/datasets/chnsenticorp.rst
[PaddlePaddle of Baidu. Ch nSentiCorp[EB/OL]. https://github.com/PaddlePaddle/PaddleHub/blob/release/v2.2/docs/docs_ch/api/datasets/chnsenticorp.rst
|
| [24] |
SophonPlus. Online_shopping_10_cats[EB/OL]. https://github.com/SophonPlus/ChineseNlpCorpus/raw/master/datasets/online_shopping_10_cats/online_shopping_10_cats.zip.
|
| [25] |
SophonPlus. Waimai_10K[EB/OL].https://raw.githubusercontent.com/SophonPlus/ChineseNlpCorpus/master/datasets/waimai_10k/waimai_10k.csv.
|
| [26] |
高德地图. 高德地图API[EB/OL]. https://www.amap.com
[AutoNavi. API of AutoNavi[EB/OL]. https://www.amap.com
|
| [27] |
高德地图. POI分类编码[EB/OL]. https://lbs.amap.com/api/webservice/download.
[AutoNavi. POI classification codes[EB/OL]. https://lbs.amap.com/api/webservice/download.
|
| [28] |
中国产业园规划布局与运营管理分析报告[R]. 北京: 前瞻产业研究院, 2019.
[China industrial park planning, layout and operation management analysis report[R]. Beijing: Foresight industry research institute, 2019. ]
|
| [29] |
前瞻产业研究院. 前瞻产业园区库[EB/OL]. https://y.qianzhan.com/yuanqu/chanye
[ Prospective Industrial Research Institute. Prospective industrial park library[EB/OL]. https://y.qianzhan.com/yuanqu/chanye
|
| [30] |
谌丽, 张文忠, 李业锦, 等. 北京城市居住环境类型区的识别与评价[J]. 地理研究, 2015, 34(7):1331-1342.
[
|
| [31] |
黄洁, 王姣娥, 靳海涛, 等. 北京市地铁客流的时空分布格局及特征——基于智能交通卡数据[J]. 地理科学进展, 2018, 37(3):397-406.
[
|
| [32] |
|
| [33] |
池娇, 焦利民, 董婷, 等. 基于POI数据的城市功能区定量识别及其可视化[J]. 测绘地理信息, 2016, 41(2):68-73.
[
|
| [34] |
李琼, 周宇, 田宇, 等. 2002-2015年中国社会保障水平时空分异及驱动机制[J]. 地理研究, 2018, 37(9):1862-1876.
[
|
| [35] |
|
| [36] |
王劲峰, 徐成东. 地理探测器:原理与展望[J]. 地理学报, 2017, 72(1):116-134.
[
|
| [37] |
王劲峰, 廖一兰, 刘鑫. 空间数据分析教程(第二版)[M]. 北京: 科学出版社, 2010.
[
|
| [38] |
|
| [39] |
林克, 陆羽. 快递员的职业幸福感从何而来?[N]. 中国水运报,2021-11-19(007).
[
|
| [40] |
谭畅. 公众眼中最具幸福感的五个职业:公务员、政府官员、教师、艺术家、高管[J]. 小康, 2012, 165(11):73-75.
[
|
| [41] |
马小雅, 寸守栋. 物流从业人员工作幸福感调查及影响因素分析[J]. 创新, 2018, 12(5):34-44.
[
|
| [42] |
刘奕伶. 我国劳动者职业幸福感现状及影响因素分析[D]. 南京: 南京财经大学, 2018.
[
|
| [43] |
朱宏斌. 知识型员工全面需要和工作资源匹配度对工作幸福感的影响[D]. 杭州: 浙江财经大学, 2016.
[
|
| [44] |
张爱莲, 李霞. 高新技术企业研发人员工作幸福感影响因素及提升路径[J]. 山东理工大学学报(社会科学版), 2018, 34(3):87-91.
[
|
| [45] |
邓大胜, 李路路, 史慧, 等. 科技工作者想什么?盼什么?——第三次全国科技工作者状况调查报告之一[J]. 今日科苑, 2015(5):11-15,1.
[
|
| [46] |
胡忠英. 教师幸福感结构的实证研究[J]. 全球教育展望, 2015, 44(4):86-94.
[
|
| [47] |
张志元, 黄慧. 阶层差异、幸福感与艺术资产配置:文献综述[J]. 东北财经大学学报, 2018(4):82-89.
[
|
| [48] |
白书慈. 宋丹丹表演艺术研究—从舞台走向荧幕的演员[D]. 哈尔滨: 哈尔滨师范大学, 2016.
[
|
| [49] |
叶龙, 赵迪, 郭名. 知识型员工职业呼唤对工作幸福感的影响研究——职业承诺的中介作用和薪酬的调节作用[J]. 中国人力资源开发, 2018, 35(9):29-39.
[
|
| [50] |
高卫益, 陈玮, 戚倩, 等. 临床医生工作幸福感现状调查及影响因素分析[J]. 中国医院管理, 2017, 37(3):55-57.
[
|
/
| 〈 |
|
〉 |