
Journal of Geo-information Science >
Delineating Urban Subdistricts with Comprehensive Functions from Taxi Trajectory Data in Multiple Years
Received date: 2021-10-03
Revised date: 2021-12-01
Online published: 2022-12-25
Supported by
National Key Research and Development Program of China(2017YFB0503600)
National Key Research and Development Program of China(2019YFE0106500)
National Natural Science Foundation of China(41601484)
National Natural Science Foundation of China(41830845)
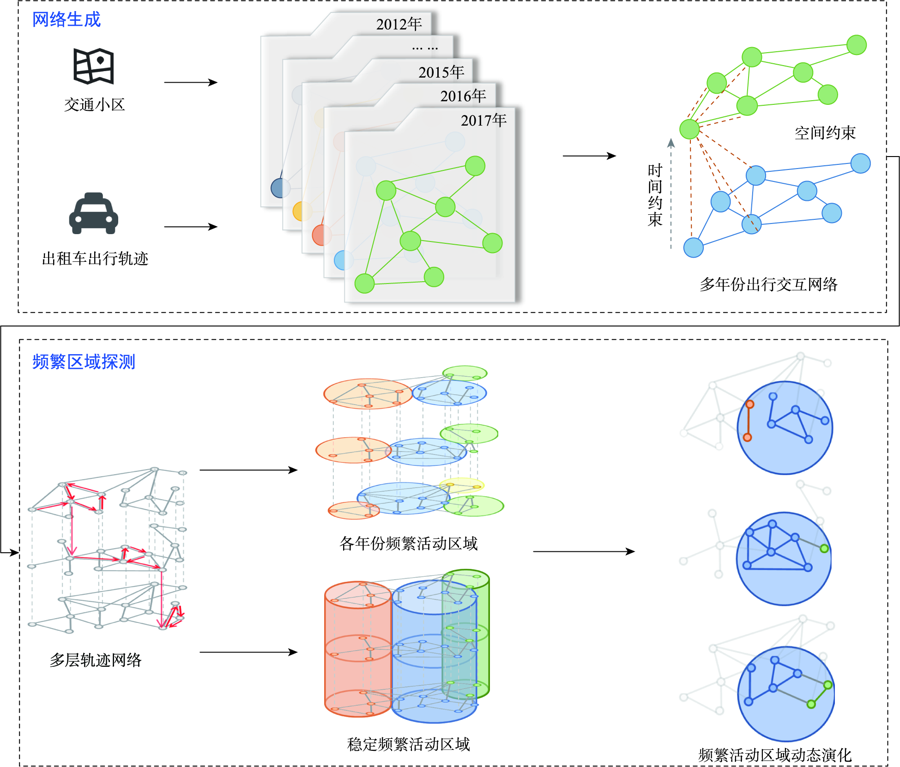
With the penetration of portable devices such as mobile phones and navigators that carry GPS sensors, the trajectory data generated by people's daily life have rapidly increased. Such kind of large-scale trajectory data have been gradually applied to traffic planning, urban management, behavioral analysis, recommendation system, and other fields. In urban studies, urban sub-center detection has always been one of the important topics in the exploration of urbanization. In this paper, we define urban subdistricts with comprehensive functions as a collection of sub-regions within which the internal traffic is significantly higher than their external connected traffic. To detect these subdistricts, a spatiotemporal coupling network model for time series trajectory data is proposed. Based on this model, a multi-layer network community discovery algorithm is proposed to detect dynamic activity sub-area. Taking the taxi trajectory data of Beijing from 2012 to 2017 as an example, this method is used to realize the dynamic detection and analysis of subdistricts with comprehensive urban functions in Beijing.

ZHEN Zhuo , KANG Chaogui . Delineating Urban Subdistricts with Comprehensive Functions from Taxi Trajectory Data in Multiple Years[J]. Journal of Geo-information Science, 2022 , 24(10) : 1982 -1992 . DOI: 10.12082/dqxxkx.2022.210601
表1 2012—2017年出租车出行轨迹数据概况Tab. 1 Descriptive information of the taxi trajectory data from 2012 to 2017 |
| 年份 | 原始轨迹数/条 | 出租车数/辆 | 筛选后轨迹数/条 | 平均出行时间/s | 平均出行距离/m |
|---|---|---|---|---|---|
| 2012 | 2 059 066 | 9 030 | 1 716 325 | 861.5 | 7259.3 |
| 2013 | 1 990 625 | 28 272 | 1 684 826 | 1160.4 | 6197.4 |
| 2014 | 1 506 303 | - | 1 234 329 | 1256.8 | 6756.6 |
| 2015 | 2 811 254 | 33 043 | 2 155 565 | 1081.3 | 6239.4 |
| 2016 | 2 166 601 | 29 966 | 1 945 297 | 1186.1 | 6270.6 |
| 2017 | 1 845 424 | 29 627 | 1 660 466 | 1190.9 | 6665.7 |
| [1] |
|
| [2] |
龙瀛, 刘伦伦. 新数据环境下定量城市研究的四个变革[J]. 国际城市规划, 2017, 32(1):64-73.
[
|
| [3] |
|
| [4] |
| [5] |
|
| [6] |
|
| [7] |
|
| [8] |
|
| [9] |
|
| [10] |
|
| [11] |
|
| [12] |
|
| [13] |
|
| [14] |
|
| [15] |
|
| [16] |
|
| [17] |
|
| [18] |
|
| [19] |
王波, 甄峰, 张浩. 基于签到数据的城市活动时空间动态变化及区划研究[J]. 地理科学, 2015, 35(2):151-160.
[
|
| [20] |
钮心毅, 丁亮, 宋小冬. 基于手机数据识别上海中心城的城市空间结构[J]. 城市规划学刊, 2014(6):61-67.
[
|
| [21] |
|
| [22] |
|
| [23] |
宋辞, 裴韬. 北京市多尺度中心特征识别与群聚模式发现[J]. 地球信息科学学报, 2019, 21(3):384-397.
[
|
| [24] |
|
| [25] |
|
| [26] |
|
| [27] |
|
| [28] |
|
| [29] |
|
| [30] |
|
/
| 〈 |
|
〉 |