
Journal of Geo-information Science >
Spatio-temporal Variations and Factors of the Human Perception of Local Temperature in China Using Weibo Data
Received date: 2021-11-03
Revised date: 2022-01-10
Online published: 2022-12-25
Supported by
National Natural Science Foundation of China(41771418)
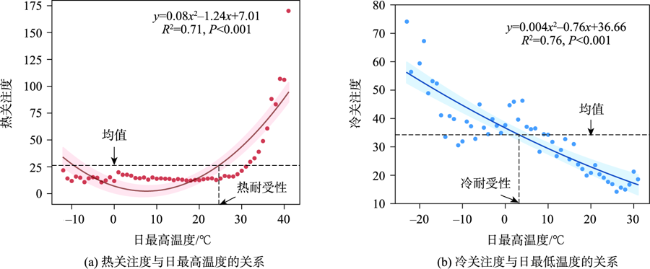
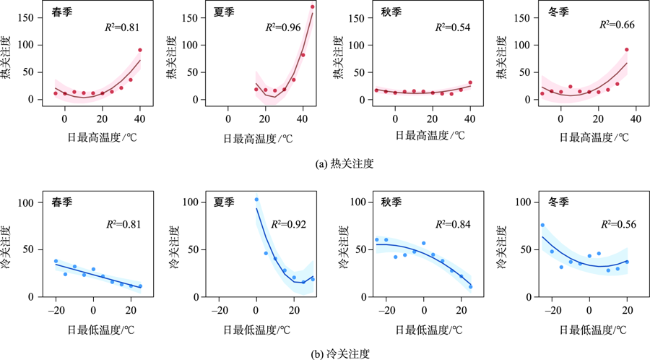
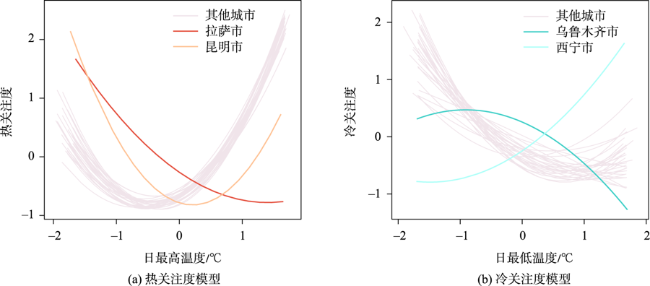
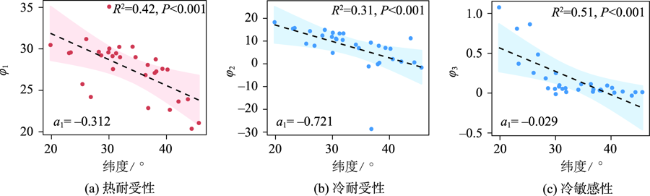
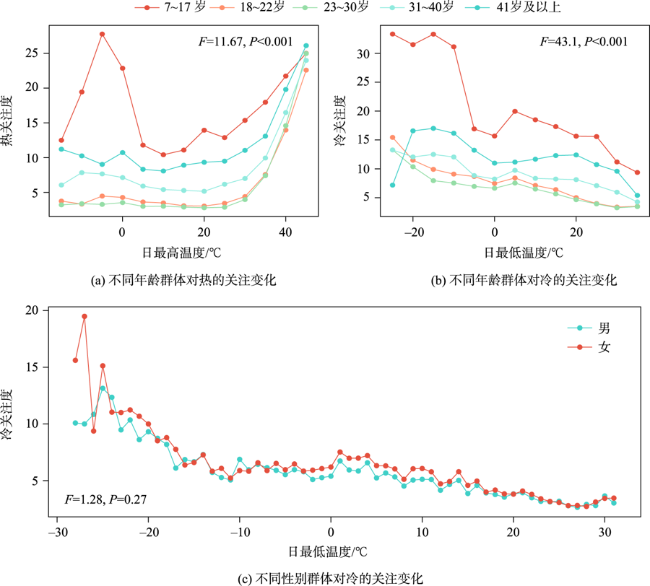
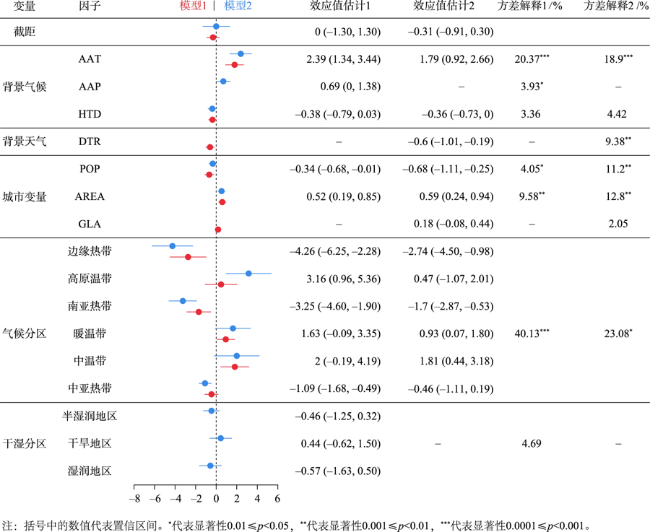
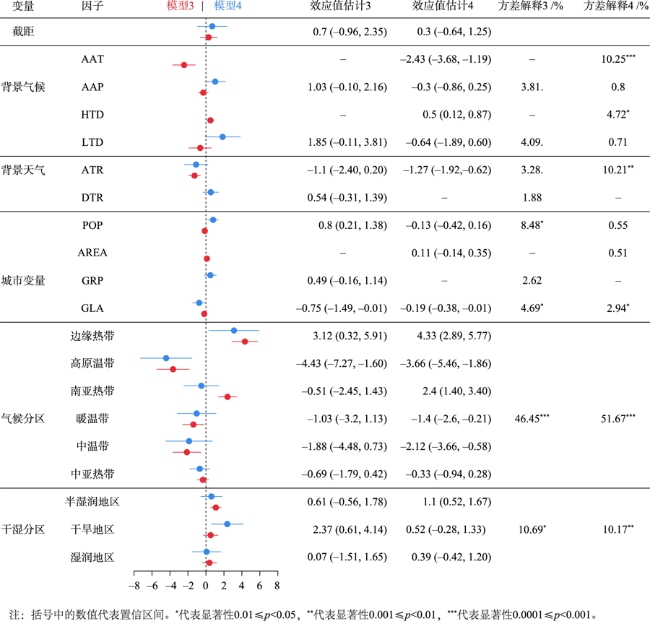
Extreme temperature events occur frequently and pose a serious threat to human health. However, due to the variability of individual and environmental influences, the perception of temperature change and the trend of actual temperature change in different populations do not exactly coincide. A deep understanding of the human perception characteristics of temperature change plays an important role in improving the management, adaptation, and warning capabilities for coping with extreme weather. Traditional survey data are insufficient in sample size and coverage, moreover, lack of diverse individual samples. And medical simulation results are strongly influenced by the parameters of environmental variables and often differ from the real situation. In this study, we used Weibo data to characterize human perception, that is, individual descriptions of temperature based on subjective feelings. We analyzed the quantitative response relationships between human perception of temperature and temperature observation variables and used temperature tolerance and sensitivity to measure temperature perception characteristics. We investigated geographical changes in human perception characteristics of temperature and its local variations in different seasons and among different groups over 31 Chinese cities. We then used the generalized linear regression model to analyze the influencing factors of temperature perception. For example, climatic factors such as climatic zones, annual average temperature, and annual average precipitation, as well as social factors such as urban population and Gross Regional Product. Our results showed that the human perception of temperature exhibited regular, nationally conspicuous shifts along latitudinal gradients, the lower the latitude, the stronger the average heat tolerance and cold sensitivity. They showed a significant trend linearly toward horizontal increase from the northern regions to the southern areas at a rate of 0.42 and 0.51 per degree, respectively. In contrast, the average cold tolerance was weaker at a rate of 0.31. There were also significant differences in human perception of temperature in different seasons and among different groups. The abnormal temperature in the off-season was more likely to attract people's attention to temperature change, and teenagers and females were more sensitive to cold. The regional differences in temperature perception characteristics were strongly associated with climate regions. People in temperate regions showed greater heat tolerance than those in the tropics, while people in the tropics showed greater temperature sensitivity. Our findings could provide insights into the characterization and patterns of the human perception of local temperature and have potential for several issues in terms of planning, management, and decision-making related to Extreme temperature event.

WENG Huixian , MA Ting . Spatio-temporal Variations and Factors of the Human Perception of Local Temperature in China Using Weibo Data[J]. Journal of Geo-information Science, 2022 , 24(10) : 2058 -2070 . DOI: 10.12082/dqxxkx.2022.210702
表1 全国31个城市气温感知定量指标的分布情况Tab. 1 Distributions of quantitative indexes for temperature perception across 31 cities in China |
| 城市 | 中心纬度/(°) | 年均日最高气温/℃ | 年均日最低气温/℃ | 热耐受性/℃ | 冷耐受性/℃ | 冷敏感性 |
|---|---|---|---|---|---|---|
| 哈尔滨市 | 45.64 | 16.29 | 0.11 | 21.06 | -1.65 | 0.01 |
| 长春市 | 44.38 | 17.26 | 1.76 | 20.36 | 0.61 | 0.01 |
| 乌鲁木齐市 | 43.73 | 17.58 | 3.91 | 23.92 | 11.23 | -0.03 |
| 沈阳市 | 42.09 | 20.05 | 3.41 | 23.65 | 0.98 | 0.02 |
| 呼和浩特市 | 40.59 | 18.57 | 1.93 | 22.64 | 2.06 | 0.01 |
| 北京市 | 40.19 | 23.19 | 8.87 | 27.50 | 6.62 | 0.07 |
| 天津市 | 39.30 | 23.72 | 10.89 | 27.59 | 6.99 | 0.09 |
| 银川市 | 38.24 | 21.28 | 5.26 | 27.27 | 0.42 | 0.03 |
| 石家庄市 | 38.13 | 24.17 | 10.44 | 28.74 | 7.93 | 0.04 |
| 太原市 | 37.96 | 22.25 | 5.15 | 27.09 | -0.17 | 0.03 |
| 西宁市 | 36.83 | 17.09 | -0.30 | 22.86 | -28.66 | 0.05 |
| 济南市 | 36.74 | 24.19 | 11.27 | 28.06 | 9.31 | 0.02 |
| 兰州市 | 36.36 | 21.38 | 5.72 | 26.84 | -1.15 | 0.11 |
| 郑州市 | 34.63 | 24.69 | 11.54 | 28.99 | 6.92 | 0.11 |
| 西安市 | 34.11 | 23.94 | 10.43 | 30.26 | 8.41 | 0.04 |
| 南京市 | 31.93 | 24.53 | 13.26 | 28.99 | 13.36 | 0.01 |
| 合肥市 | 31.79 | 24.94 | 13.20 | 30.23 | 10.48 | 0.06 |
| 上海市 | 31.24 | 24.7 | 15.44 | 29.47 | 13.33 | 0.05 |
| 成都市 | 30.70 | 23.96 | 13.52 | 27.56 | 10.77 | 0.10 |
| 武汉市 | 30.62 | 24.79 | 13.41 | 29.12 | 11.06 | 0.08 |
| 重庆市 | 30.06 | 25.87 | 16.82 | 30.03 | 13.66 | 0.25 |
| 拉萨市 | 30.04 | 19.01 | 3.55 | 35.08 | 4.81 | -0.01 |
| 杭州市 | 29.90 | 25.51 | 14.60 | 29.58 | 11.86 | 0.05 |
| 南昌市 | 28.65 | 25.85 | 16.12 | 29.21 | 14.91 | 0.06 |
| 长沙市 | 28.23 | 25.24 | 15.40 | 29.64 | 12.42 | 0.19 |
| 贵阳市 | 26.84 | 21.37 | 12.00 | 24.20 | 7.96 | 0.48 |
| 福州市 | 26.05 | 27.94 | 18.05 | 31.17 | 14.35 | 0.25 |
| 昆明市 | 25.39 | 22.49 | 11.51 | 25.74 | 8.84 | 0.86 |
| 广州市 | 23.35 | 28.75 | 19.76 | 29.56 | 15.73 | 0.37 |
| 南宁市 | 23.06 | 28.92 | 19.17 | 29.49 | 15.45 | 0.81 |
| 海口市 | 19.83 | 29.90 | 22.32 | 30.46 | 18.28 | 1.08 |
| [1] |
IPCC. Climate change 2021: The physical science basis[M/OL]. 2021.
|
| [2] |
周波涛, 钱进. IPCC AR6报告解读:极端天气气候事件变化[J/OL]. 气候变化研究进展, 2021, 17(6):713-718.
[
|
| [3] |
Meehl,
|
| [4] |
|
| [5] |
|
| [6] |
|
| [7] |
|
| [8] |
|
| [9] |
|
| [10] |
|
| [11] |
|
| [12] |
|
| [13] |
|
| [14] |
|
| [15] |
|
| [16] |
|
| [17] |
|
| [18] |
|
| [19] |
|
| [20] |
|
| [21] |
|
| [22] |
|
| [23] |
|
| [24] |
|
| [25] |
|
| [26] |
|
| [27] |
|
| [28] |
Francesca, Cecinati, Tom, et al. Mining social media to identify heat waves[J]. International journal of environmental research and public health, 2019, 16(5):762. DOI: 10.3390/ijerph16050762
|
| [29] |
裴韬, 刘亚溪, 郭思慧, 等. 地理大数据挖掘的本质[J]. 地理学报, 2019, 74(3):586-598.
[
|
| [30] |
新浪微博数据中心. 2018微博用户发展报告[ED/OL]. 2018.
[Sina Weibo data center. 2018 Weibo user development report [ED/OL]. 2018. ]
|
| [31] |
郭彦, 董文杰, 任福民, 等. CMIP5模式对中国年平均气温模拟及其与CMIP3模式的比较[J]. 气候变化研究进展, 2013, 9(3):181-186.
[
|
| [32] |
唐红玉, 翟盘茂, 王振宇. 1951—2002年中国平均最高,最低气温及日较差变化[J]. 气候与环境研究, 2005, 10(4):728-735.
[
|
| [33] |
王春林, 潘蔚娟, 罗晓玲. 广东高温预警指标及高温日数统计[J]. 广东气象, 2008, 30(3):F0002-F0002.
[
|
| [34] |
国家统计局城市社会经济调查司. 中国城市统计年鉴[M]. 北京: 中国统计出版社, 2018.
[
|
| [35] |
|
| [36] |
中国科学院资源环境科学数据中心. 1980年代中国生态地理分区[DB]. 国家科技基础条件平台—国家地球系统科学数据中心, 2020.
Resource and environment science and data center. Ecological geography of China in the 1980s[DB]. National Earth System Science Data Center, National Science & Technology Infrastructure of China, 2020 ] DOI: 10.12041/geodata.118136970584374.ver1.db
|
| [37] |
新浪微博数据中心. 2017微博用户发展报告[ED/OL]. 2017.
[Sina Weibo data center. 2017 Weibo user development report[ED/OL]. 2017. ]
|
| [38] |
李思芸. 夏热冬冷地区典型城市幼儿热舒适分析研究[D]. 重庆: 重庆大学, 2016.
[
|
/
| 〈 |
|
〉 |
