
Journal of Geo-information Science >
A Spatial-temporal Causal Convolution Model for Fine-grained Individual Air Quality Index (IAQI) Prediction
Received date: 2022-05-18
Revised date: 2022-06-15
Online published: 2023-03-25
Supported by
National Key Research and Development Program of China(2020YFB2104400)
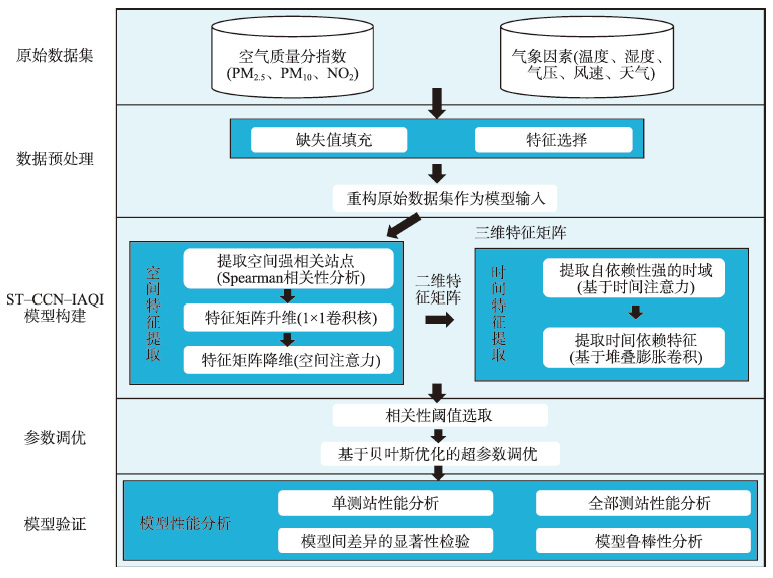
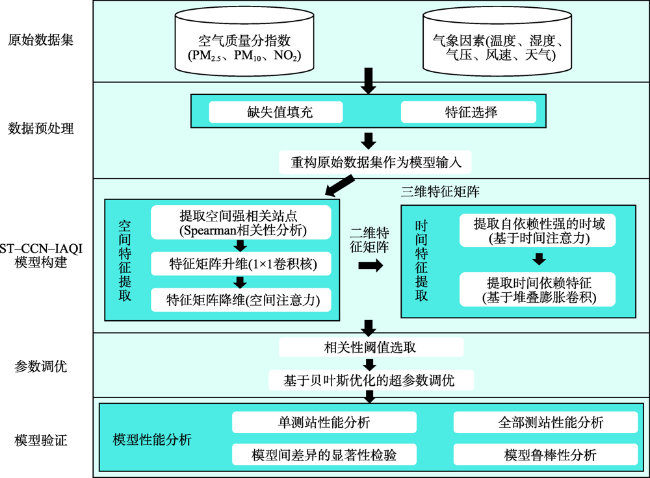
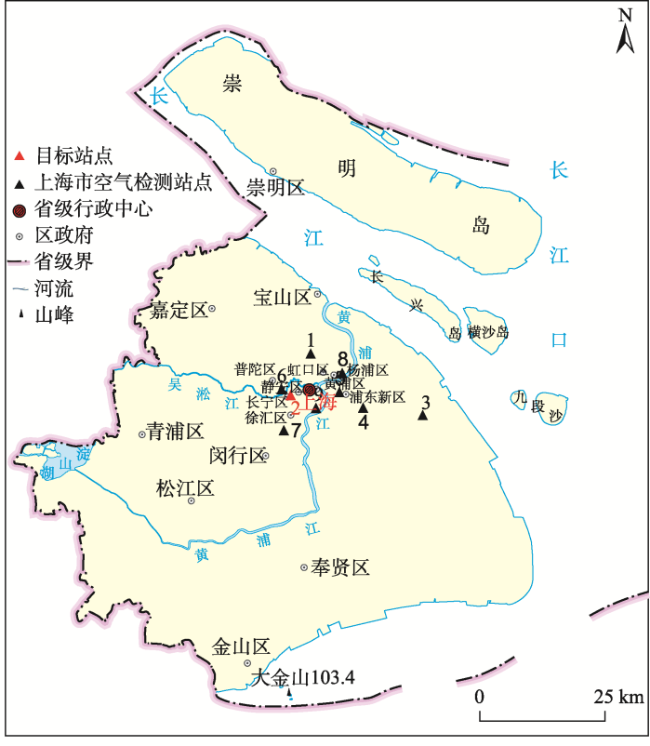
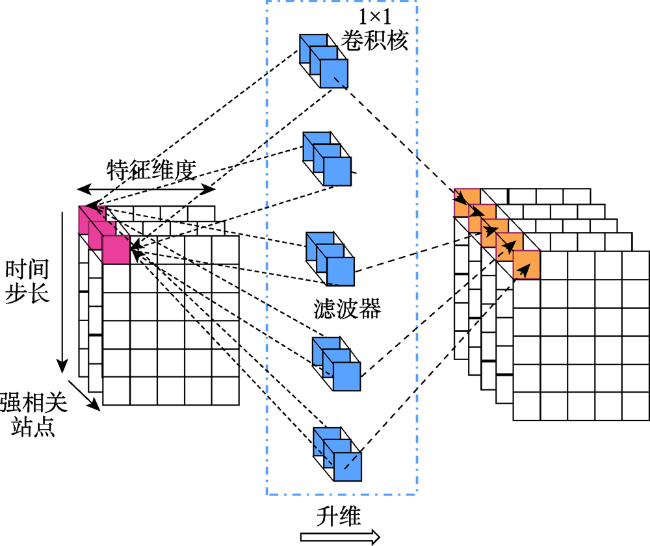
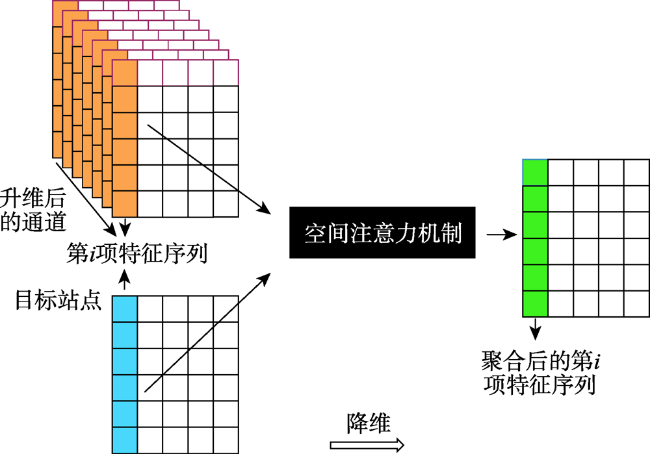
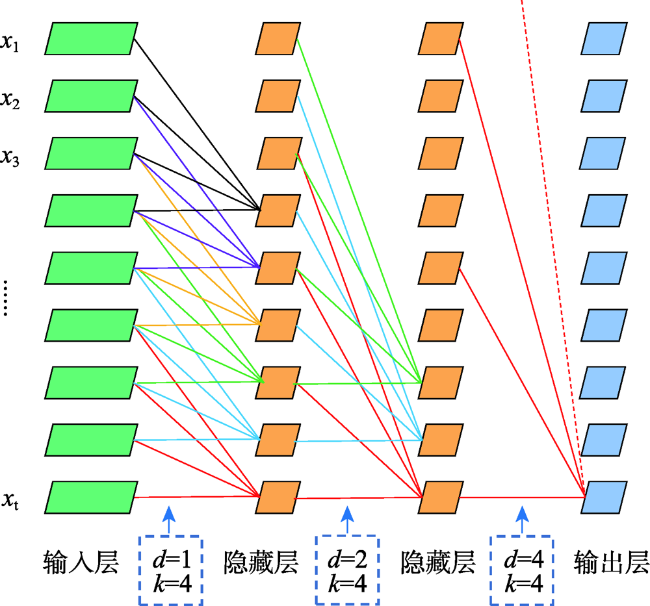
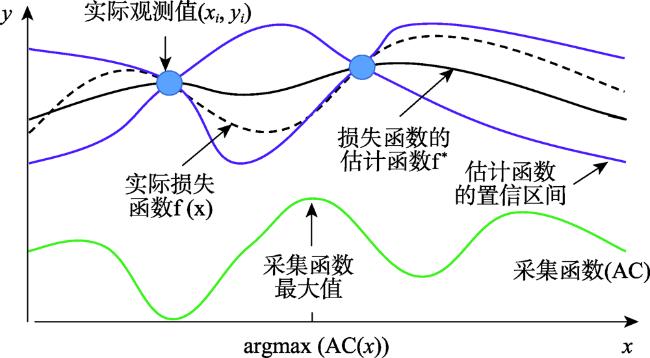
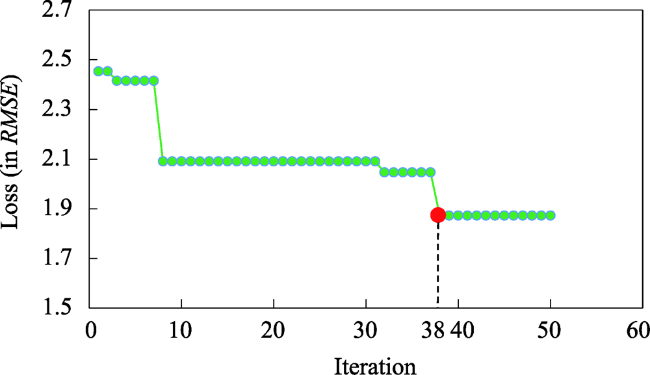
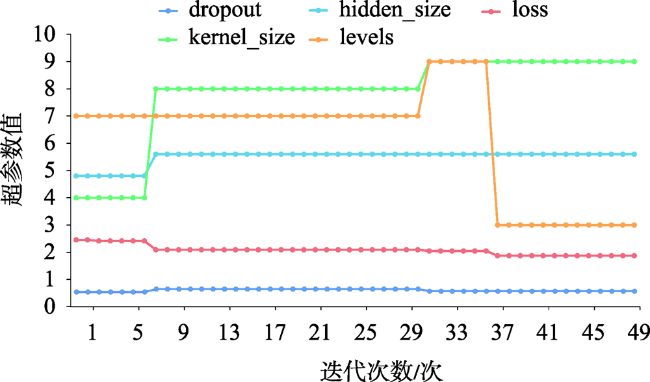
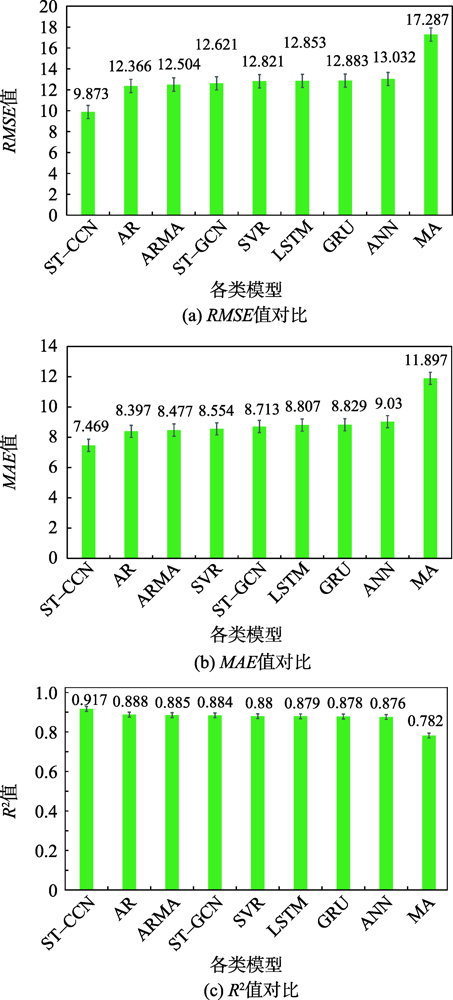
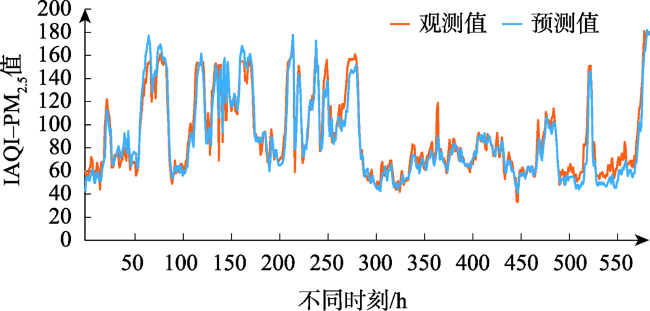
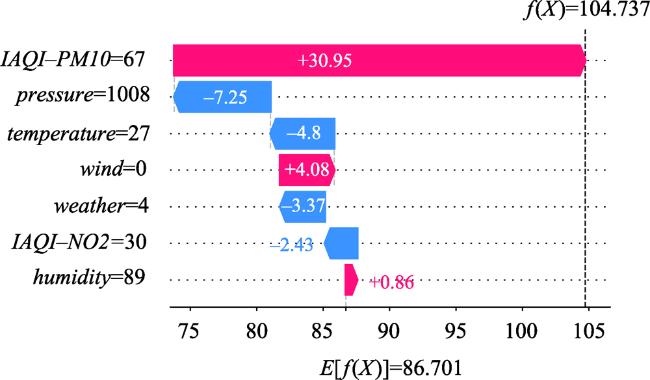
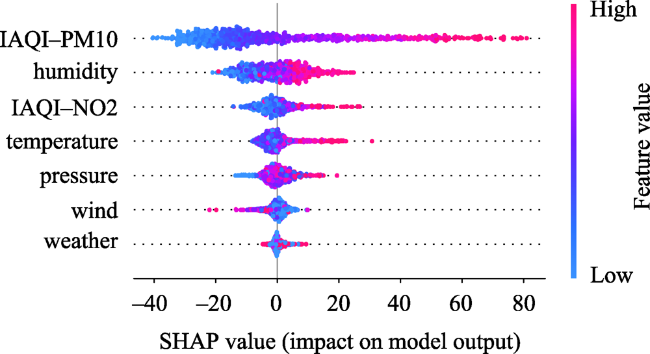
Accurate and fine-grained individual Air Quality Index (IAQI) prediction is the basis of Air Quality Index (AQI), which is of great significance for air quality control and human health. Traditional approaches such as time series modeling, Recurrent Neural Network (RNN) or Graph Convolutional Network (GCN) cannot effectively integrate spatial-temporal and meteorological factors and manage dynamic edge relationship among scattered monitoring stations. In this paper, a ST-CCN-IAQI model is proposed based on spatial-temporal causal convolution networks. Firstly, both the spatial effects of multi-source air pollutants and meteorological factors are considered via spatial attention mechanism. Secondly, time-dependent features in causal convolution network are extracted by stacked dilated convolution and time attention. Finally, multiple parameters in ST-CCN-IAQI are tuned by Bayesian optimization. In this paper, the Individual Air Quality Index (IAQI-PM2.5) data of Shanghai air monitoring station are used to carry out the experiment, and a series of baseline models (AR, MA, ARMA, ANN, SVR, GRU, LSTM, and ST-GCN) are employed to compare with ST-CCN-IAQI. Our results show that: (1) In the single station test, RMSE and MAE values of ST-CCN-IAQI are 9.873 and 7.469, respectively, which decreases by 24.95% and 16.87% on average, respectively; R2 is 0.917, about 5.69% higher than that of the baselines; (2) The prediction of IAQI-PM2.5, IAQI-PM10, and IAQI-NO2 of all stations proves that ST-CCN-IAQI has strong generalization ability and stability; (3) Shapley analysis shows IAQI-PM10, humidity, and IAQI-NO2 have a great impact on the prediction of IAQI-PM2.5. Friedman test under different data sampling conditions proves that ST-CCN-IAQI has significant performance improvement by comparisons with baselines. The ST-CCN-IAQI method provides a robust and feasible solution for accurate prediction of fine-grained IAQI.
ZHANG Yumin , ZHAO Junjie , MEI Qiang , LIU Xiliang , CHEN Zhuodong , LI Jianqiang , WANG Shaohua , SHI Yuliang , CHAI Jinchuan , GAO Yuyao , JING Xiaoqian , YANG Niandi , MA Xiaoyan . A Spatial-temporal Causal Convolution Model for Fine-grained Individual Air Quality Index (IAQI) Prediction[J]. Journal of Geo-information Science, 2023 , 25(1) : 115 -130 . DOI: 10.12082/dqxxkx.2023.220321
表1 数据集说明Tab. 1 Dataset description |
| 数据种类 | 特征名称 | 数据类型 | 单位 |
|---|---|---|---|
| 空气质量分指数 | IAQI-PM2.5 | 数值 | - |
| IAQI-PM10 | 数值 | - | |
| IAQI-NO2 | 数值 | - | |
| 气象数据 | Temperature | 数值 | ℃ |
| Pressure | 数值 | hpa | |
| Humidity | 数值 | % | |
| Wind speed | 数值 | km/h | |
| Weather | 数值 | - |
表2 各模型的性能比较(单一站点stn.2)Tab. 2 Performance comparison of each model (single station stn.2) |
| 模型 | RMSE | MAE | R2 |
|---|---|---|---|
| AR | 12.366 | 8.397 | 0.888 |
| MA | 17.287 | 11.897 | 0.782 |
| ARMA | 12.504 | 8.477 | 0.885 |
| ANN | 13.032 | 9.030 | 0.876 |
| SVR | 12.821 | 8.554 | 0.880 |
| GRU | 12.883 | 8.829 | 0.878 |
| LSTM | 12.853 | 8.807 | 0.879 |
| ST-GCN | 12.621 | 8.713 | 0.884 |
| ST-CCN | 9.873 | 7.469 | 0.917 |
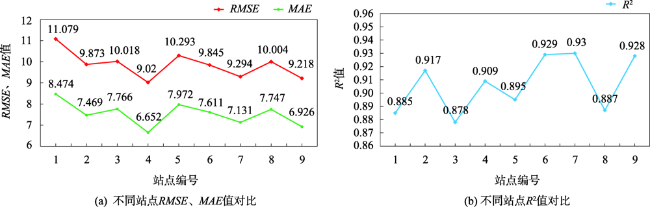
表3 全部站点3种IAQI预测精度比较Tab. 3 Comparison of three IAQI prediction accuracy of all stations |
| 站点号 | IAQI-PM2.5 | IAQI-PM10 | IAQI-NO2 | ||||||
|---|---|---|---|---|---|---|---|---|---|
| RMSE | MAE | R2 | RMSE | MAE | R2 | RMSE | MAE | R2 | |
| 1 | 11.079 | 8.474 | 0.885 | 5.822 | 4.619 | 0.812 | 3.508 | 2.735 | 0.872 |
| 2 | 9.873 | 7.469 | 0.917 | 6.447 | 5.085 | 0.827 | 3.378 | 2.470 | 0.867 |
| 3 | 10.018 | 7.766 | 0.878 | 5.713 | 4.524 | 0.782 | 2.056 | 1.567 | 0.870 |
| 4 | 9.020 | 6.652 | 0.909 | 4.917 | 3.865 | 0.869 | 3.047 | 2.267 | 0.859 |
| 5 | 10.293 | 7.972 | 0.895 | 5.904 | 4.666 | 0.825 | 3.070 | 2.236 | 0.878 |
| 6 | 9.845 | 7.611 | 0.929 | 5.124 | 3.961 | 0.929 | 3.347 | 2.593 | 0.880 |
| 7 | 9.294 | 7.131 | 0.930 | 6.387 | 4.937 | 0.778 | 3.156 | 2.405 | 0.870 |
| 8 | 10.004 | 7.747 | 0.887 | 5.011 | 3.816 | 0.884 | 4.181 | 3.269 | 0.771 |
| 9 | 9.218 | 6.926 | 0.928 | 7.330 | 5.826 | 0.800 | 2.710 | 2.029 | 0.875 |
| 平均值 | 9.849 | 7.527 | 0.906 | 5.850 | 4.588 | 0.834 | 3.161 | 2.396 | 0.860 |
表4 9种模型在3种数据集上RMSE指标排名Tab. 4 RMSE index ranking of 9 models in 3 data sets |
| 数据集 | AR | MA | ARMA | ANN | SVR | GRU | LSTM | ST-GCN | ST-CNN |
|---|---|---|---|---|---|---|---|---|---|
| data_25% | 12.35(2) | 17.12(9) | 12.57(3) | 13.03(8) | 12.81(5) | 12.87(7) | 12.84(6) | 12.61(4) | 9.85(1) |
| data_50% | 12.47(2) | 17.67(9) | 12.63(3) | 13.12(7) | 12.92(5) | 13.12(7) | 13.04(6) | 12.76(4) | 9.96(1) |
| data_75% | 12.15(2) | 17.43(9) | 12.45(3) | 12.93(7) | 12.85(6) | 12.97(8) | 12.77(5) | 12.68(4) | 9.62(1) |
| 平均值 | 2 | 9 | 3 | 7.3 | 5.3 | 7.3 | 5.7 | 4 | 1 |
注:括号内的数值代表模型在该数据集上RMSE值的排名(RMSE按升序排序)。 |
:衷心感谢审稿专家、编辑部以及中国科学院大气物理研究所邓兆泽老师对本文提出的宝贵修改意见。
| [1] |
|
| [2] |
林金煌, 陈文惠, 张岸. 2019年北京市 PM2.5人群暴露剂量特征分析[J]. 地球信息科学学报, 2020, 22(12):2348-2357.
[
|
| [3] |
|
| [4] |
|
| [5] |
师泽源, 赵俭辉, 张文昱, 等. 基于扩展场强模型的稀疏AQI空间插值新算法[J]. 武汉大学学报·信息科学版, 2017, 42(7):968-974.
[
|
| [6] |
|
| [7] |
程诗奋, 彭澎, 张恒才, 等. 异质稀疏分布时空数据插值、重构与预测方法探讨[J]. 武汉大学学报·信息科学版, 2020, 45(12):1919-1929.
[
|
| [8] |
冯子钰, 施润和. 中国近地面PM2.5浓度与排放的时空分布及其关联分析[J]. 地球信息科学学报, 2021, 23(7):1221-1230.
[
|
| [9] |
|
| [10] |
钟雨桐, 韦晶, 郑月明, 等. 基于静风期污染物的PM2.5排放清单空间精细化方法[J]. 地球信息科学学报, 2021, 23(11):1971-1983.
[
|
| [11] |
|
| [12] |
|
| [13] |
|
| [14] |
|
| [15] |
杜震洪, 吴森森, 王中一, 等. 基于地理神经网络加权回归的中国PM2.5浓度空间分布估算方法[J]. 地球信息科学学报, 2020, 22(1):122-135.
[
|
| [16] |
李清泉, 高德荃, 杨必胜. 基于模糊支持向量机的城市道路交通状态分类[J]. 吉林大学学报(工学版), 2009, 39(S2):131-134.
[
|
| [17] |
|
| [18] |
|
| [19] |
|
| [20] |
|
| [21] |
|
| [22] |
|
| [23] |
|
| [24] |
|
| [25] |
|
| [26] |
|
| [27] |
|
| [28] |
|
| [29] |
|
| [30] |
|
| [31] |
|
| [32] |
|
| [33] |
|
| [34] |
|
| [35] |
|
| [36] |
|
| [37] |
|
| [38] |
|
| [39] |
高旺旺, 冯建中, 白林燕, 等. 海南岛气溶胶时空变化及来源追溯[J]. 地球信息科学学报, 2020, 22(7):1532-1543.
[
|
| [40] |
|
| [41] |
徐艺武. 北京市PM2.55污染的时空分布与主要空气污染物的关系[J]. 科技创新与应用, 2016(33):143.
[
|
| [42] |
|
| [43] |
|
| [44] |
|
| [45] |
|
| [46] |
|
| [47] |
|
| [48] |
|
| [49] |
宋明, 韩素芹, 张敏, 等. 天津大气能见度与相对湿度和PM10及 PM2.5的关系[J]. 气象与环境学报, 2013, 29(2):34-41.
[
|
/
| 〈 |
|
〉 |