
Journal of Geo-information Science >
Analyzing Spatial-Temporal Pattern and Climate Factors of Blue-Green Space in Urban Built-Up Areas in Prefecture-level Cities in China
Received date: 2022-05-05
Revised date: 2022-07-26
Online published: 2023-03-25
Supported by
National Natural Science Foundation of China(41871171)
National Natural Science Foundation of China(41471338)
Strategic Priority Research Program(A) of Chinese Academy of Sciences(XDA23100302)
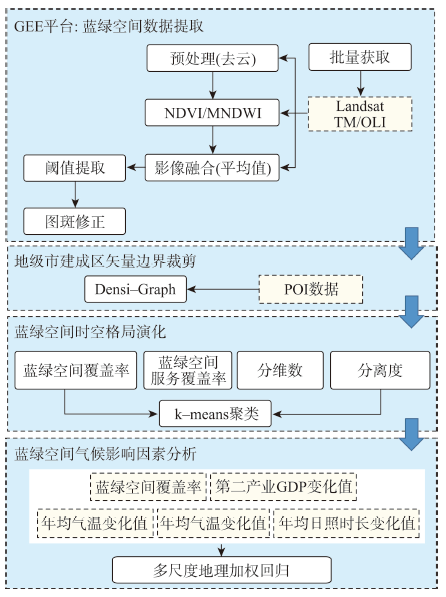
Blue-green space plays a prominent role in urban ecological security. This study built a blue-green database of 272 prefecture-level urban built-up areas in China using NDVI and MNDWI in 2005, 2010, 2015, and 2020 based on Google Earth Engine (GEE). Combining with the coverage rate, 300-meter service coverage rate, the fractal index distribution, and the landscape division index, the spatiotemporal pattern of the blue-green space and its climate factors were examined. The results show that: (1) The blue-green space in urban built-up areas in prefecture-level cities presented an overall pattern of “higher coverage in south than that in north”. While the south showed a pattern of “higher in west than east”, and the north had a pattern of “higher in east than west”. Particularly, the Bohai Rim area was marked as a basin of low coverage. The temporal trend of overall blue-green space was increasing except for a few cities in Central China; (2) In terms of different zones, the highest coverage rate (> 65%) of blue-green space in urban built-up areas occurred in Southwest China where the landscape division index was the lowest (< 0.60), and the coverage rate of Northwest China varied greatly. The North China indicated the lowest coverage (10%~30%) of blue-green space and a highest landscape division index (~0.98); (3) Based on the Multi-scale Geographically Weighted Regression (MGWR), the R-square value and the adjusted R-square value were 0.85 and 0.83, respectively. The impact of precipitation on the blue-green space coverage in urban built-up areas was significant and positive, while the temperature had negative impact on blue-green space. The impacts of climate factors were mostly equivalent to human activities but were stronger in certain periods.

ZHANG Xinyue , GAO Xiaolu , CHAI Qi , SONG Dunjiang . Analyzing Spatial-Temporal Pattern and Climate Factors of Blue-Green Space in Urban Built-Up Areas in Prefecture-level Cities in China[J]. Journal of Geo-information Science, 2023 , 25(1) : 190 -207 . DOI: 10.12082/dqxxkx.2023.220261
表1 不同省份蓝绿空间提取所用影像时间Tab. 1 Time slice chosen for different provinces |
| 影像年份 | 影像日期 | 覆盖省份 |
|---|---|---|
| 2020 | 2020.3.1—2020.10.31 | 辽宁、吉林、黑龙江、内蒙古、青海、宁夏、新疆、西藏 |
| 2020.1.1—2020.12.31 | 其它省份 | |
| 2015 | 2015.3.1—2015.10.31 | 辽宁、吉林、黑龙江、内蒙古、青海、宁夏、新疆、西藏 |
| 2015.1.1—2015.12.31 | 其它省份 | |
| 2010 | 2009.3.1—2009.09.30 | 吉林、黑龙江、辽宁、内蒙古、新疆、西藏、青海、宁夏、甘肃、陕西、山西、河北、北京、天津、山东、江苏、上海、河南、安徽、湖北、四川 |
| 2009.3.1—2010.12.31 | 云南、贵州、重庆、湖南、广西、广东、江西、浙江、福建、海南 | |
| 2005 | 2004.3.1—2004.09.30 | 吉林、黑龙江、辽宁、内蒙古、新疆、西藏、青海、宁夏、甘肃、陕西、山西、河北、北京、天津、山东、上海、河南、安徽 |
| 2004.3.1—2005.12.31 | 云南、贵州、重庆、湖南、广西、广东、江西、浙江、福建、海南、四川、湖北、江苏 |
注:由于数据获取困难,本次研究不包括香港、台湾和澳门。 |
图12 2005—2020年中国272个地级城市建成区蓝绿空间分离度空间分布注:该图基于自然资源部标准地图网站审图号为GS(2020)4619号的标准地图制作,底图无修改。由于数据获取困难,本研究不包括香港、台湾和澳门。 Fig. 12 Spatial distribution of landscape division index in 272 Chinese urban built-up area from 2005 to 2020 |
表2 2005—2015年地级市建成区蓝绿空间气候影响因素的多尺度地理加权回归模型参数取值Tab. 2 Parameters of Multiscale Geographically Weighted Regression for analyzing climate impacts on blue-green space in urban built-up area from 2005 to 2015 |
| 变量 | 系数(最小值~最大值) |
|---|---|
| 截距项 | 12.93 ~ 33.66*** |
| 2005年CR | 0.24 ~ 0.34*** |
| 2010年CR | 0.15 ~ 0.53*** |
| 2005—2010年∆T | -0.35 ~ -0.34*** |
| 2010—2015年∆T | -0.09 ~ -0.08 |
| 2005—2010年∆P | -0.23 ~ 0.36*** |
| 2010—2015年∆P | 0.07 ~ 0.14*** |
| 2005—2010年∆S | 0.15 ~ 0.16** |
| 2010—2015年∆S | -0.28 ~ 0.27 |
| 2005—2010年∆GDP″ | 0.15~0.16* |
| 2010—2015年∆GDP″ | -0.18 ~ -0.17 |
| 模型参数 | 取值 |
| 全局R2 | 0.85 |
| 校正R2 | 0.83 |
| AIC | 1925.29 |
注:显著性:***(p<0.001),**(p<0.01),*(p<0.05)。 |
| [1] |
龚珍, 胡友健, 黎华. 城市水体空间分布与地表温度之间的关系研究[J]. 测绘通报, 2015(12):34-36.
[
|
| [2] |
苏泳娴, 黄光庆, 陈修治, 等. 城市绿地的生态环境效应研究进展[J]. 生态学报, 2011, 31(23):7287-7300.
[
|
| [3] |
|
| [4] |
李书严, 轩春怡, 李伟, 等. 城市中水体的微气候效应研究[J]. 大气科学, 2008, 32(3):552-560.
[
|
| [5] |
|
| [6] |
|
| [7] |
刘佳坤, 吝涛, 赵宇, 等. 面向城市可持续发展的自然解决途径(NBSs)研究进展[J]. 生态学报, 2019, 39(16):6040-6050.
[
|
| [8] |
陈定贵, 周德民, 吕宪国. 长春城市发展过程中地表水体空间格局演变特征[J]. 吉林大学学报(地球科学版), 2008, 38(3):437-443.
[
|
| [9] |
唐静, 董继兴, 董李勤, 等. 地级尺度下的云南省绿地空间格局演化分析[J]. 林业调查规划, 2021, 46(4):33-38.
[
|
| [10] |
|
| [11] |
戴菲, 毕世波, 郭晓华, 等. 基于形态学空间格局分析的伦敦绿地系统空间格局演化及其与政策的关联性研究[J]. 国际城市规划, 2021, 36(2):50-58.
[
|
| [12] |
宋爽, 石梦溪, 胡珊珊, 等. 东北地区中心城市城区蓝绿空间演化及驱动机制研究[J]. 南京林业大学学报(自然科学版), 2022, 46(4):221-229.
[
|
| [13] |
王琼, 吴宾, 姚申君, 等. 城市绿地演化轨迹与变化研究——以上海市外环以内区域为例[J]. 华东师范大学学报(自然科学版), 2021(2):100-109.
[
|
| [14] |
周筱雅, 刘志强, 王俊帝. 中国市域人均公园绿地面积时空演变特征[J]. 规划师, 2018, 34(6):105-111.
[
|
| [15] |
刘志强, 陈列, 王俊帝, 等. 人口规模视角下城市公园绿地增长的差异与潜力——以我国地级及以上城市为例[J]. 地域研究与开发, 2021, 40(2):40-44,55.
[
|
| [16] |
邵大伟, 吴殿鸣. 1979—2017年城市公园绿地空间布局的分形演化特征——以南京为例[J]. 风景园林, 2021, 28(3):113-120.
[
|
| [17] |
|
| [18] |
|
| [19] |
陈仁喜, 王成芳. 城市高分辨率影像绿地植被识别研究进展[J]. 遥感信息, 2013, 28(3):119-125.
[
|
| [20] |
王航, 秦奋. 遥感影像水体提取研究综述[J]. 测绘科学, 2018, 43(5):23-32.
[
|
| [21] |
徐涵秋. 利用改进的归一化差异水体指数(MNDWI)提取水体信息的研究[J]. 遥感学报, 2005, 9(5):589-595.
[
|
| [22] |
刘桂林, 张落成, 刘剑, 等. 基于Landsat TM影像的水体信息提取[J]. 中国科学院大学学报, 2013, 30(5):644-650.
[
|
| [23] |
许靖, 沈涛, 杨仕仙. 高分遥感影像城市绿地自动提取方法[J]. 北京测绘, 2021, 35(4):480-484.
[
|
| [24] |
张甜, 王仰麟, 刘焱序, 等. 1987—2015年深圳市主城区景观演变过程多时相识别[J]. 地理学报, 2016, 71(12):2170-2184.
[
|
| [25] |
乔丹玉, 郑进辉, 鲁晗, 等. 面向不同环境背景的Landsat影像水体提取方法适用性研究[J]. 地球信息科学学报, 2021, 23(4):710-722.
[
|
| [26] |
邸苏闯, 吴文勇, 刘洪禄, 等. 城市绿量的遥感估算与热岛效应的相关分析——以北京市五环区域为例[J]. 地球信息科学学报, 2012, 14(4):481-489.
[
|
| [27] |
徐涵秋. 水体遥感指数研究进展[J]. 福州大学学报(自然科学版), 2021, 49(5):613-625.
[
|
| [28] |
许泽宁, 高晓路. 基于电子地图兴趣点的城市建成区边界识别方法[J]. 地理学报, 2016, 71(6):928-939.
[
|
| [30] |
申世广, 刘祥, 孙新旺, 等. 我国设区市绿化覆盖率与绿地率区域耦合差异分析——基于干湿气候区划的视角[J]. 西北林学院学报, 2020, 35(4):236-241.
[
|
| [31] |
崔佳奇, 刘宏涛, 陈媛媛. 中国城市建成区绿化覆盖率变化特征及影响因素分析[J]. 生态环境学报, 2021, 30(2):331-339.
[
|
| [32] |
|
| [33] |
|
/
| 〈 |
|
〉 |