
Journal of Geo-information Science >
Spatial Identification and Temporal-spatial Evolution of Wilderness Areas in China
Received date: 2022-05-08
Revised date: 2022-06-13
Online published: 2023-04-19
Supported by
National Natural Science Foundation of China(42071216)
Natural Science Foundation of Gansu Province(21JR7RA145)
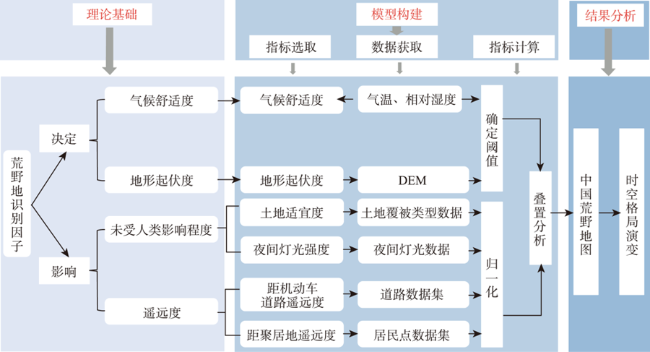
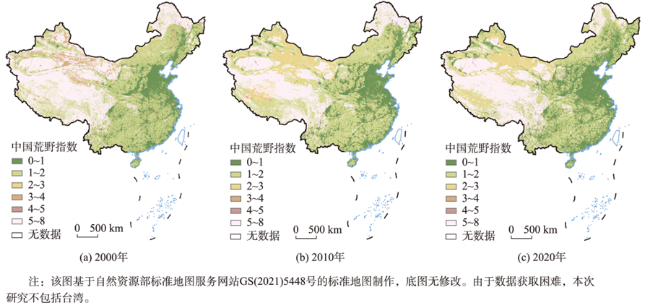
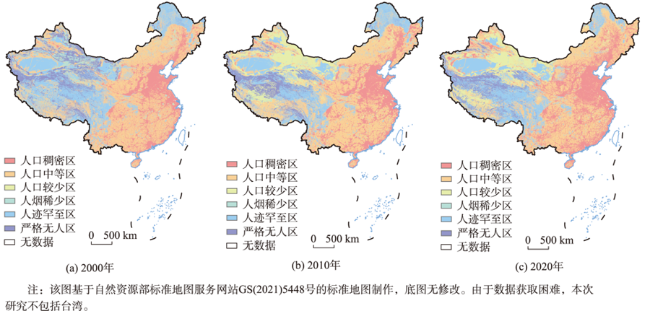
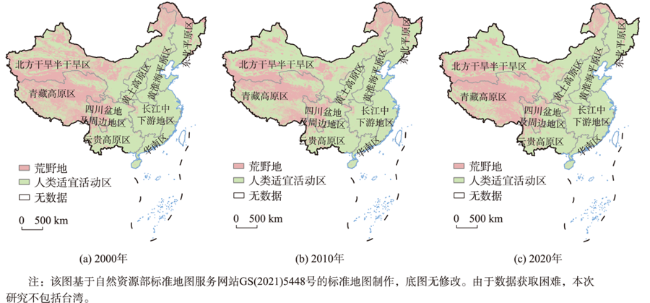
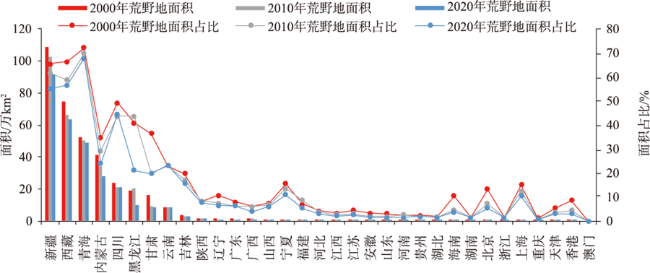
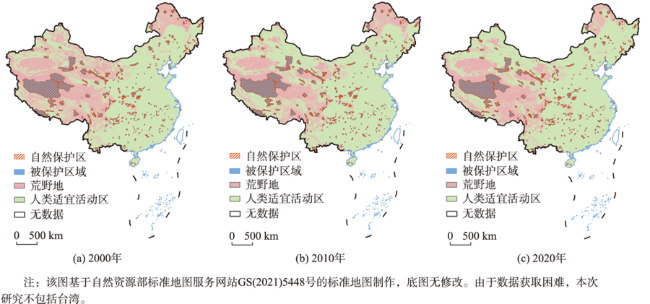
There are not only significant regional differences in China, but also great differences in natural conditions and human environment. In the context of the increasingly serious ecological crisis and the accelerated construction of ecological civilization, China's special regional differences and natural and humanistic environment limit the even distribution and orderly development of population and the overall spatial layout of social economy, which leads to large, widely distributed Wilderness Areas (WAs). Wilderness plays an important role in carrying out the evaluation of resources and environmental carrying capacity, ensuring the long-term existence of biodiversity, dealing with human-land relationship, and building national parks and ecological security barriers. Therefore, it is particularly important to objectively and accurately define the spatial distribution range of WAs and analyze its temporal and spatial evolution pattern. At present, there are few studies on the area, distribution, characteristics, and spatiotemporal evolution pattern of WAs. Based on the multi-source spatial data in 2000, 2010, and 2020, from the perspective of decision-making and influence, this paper took climate comfort and topographic relief as the decision-making indexes, and the human influence degree as well as remoteness as impact indexes to construct a multi-factor identification model of wilderness, defined the spatial scope of WAs in China, and analyzed its geographical distribution characteristics and spatiotemporal evolution pattern. The results show that: (1) Based on multi-source spatial data, selecting the suitability index system and establishing the coupled WAs determination-influence relationship approach can accurately and effectively identify and analyze the spatial and temporal distribution patterns of WAs in China; (2) In China, the WAs were distributed centrally in a large scale and dispersed in small areas in space. The total area of WAs in these three periods was 3.4418 million km2, 2.9767 million km2, and 2.7986 million km2, respectively, mainly distributed in Tibet, Xinjiang, Qinghai, Inner Mongolia, Heilongjiang, and other provinces; (3) From 2000 to 2020, most of China's WAs came from grasslands and unused land, and its area showed a downward trend with a larger reduction rate in 2000—2010 than that in 2010—2020; (4) Most of the nature reserves and the first batch of national parks were distributed in the WAs. Tibet was the area that was protected most, followed by Xinjiang, Qinghai, Inner Mongolia, Gansu, and so on. In 2020, the protected area of WAs reached 632 100 km2, accounting for 69.32 % of the total area of nature reserves.

MA Li , PAN Jinghu . Spatial Identification and Temporal-spatial Evolution of Wilderness Areas in China[J]. Journal of Geo-information Science, 2023 , 25(2) : 324 -339 . DOI: 10.12082/dqxxkx.2023.220273
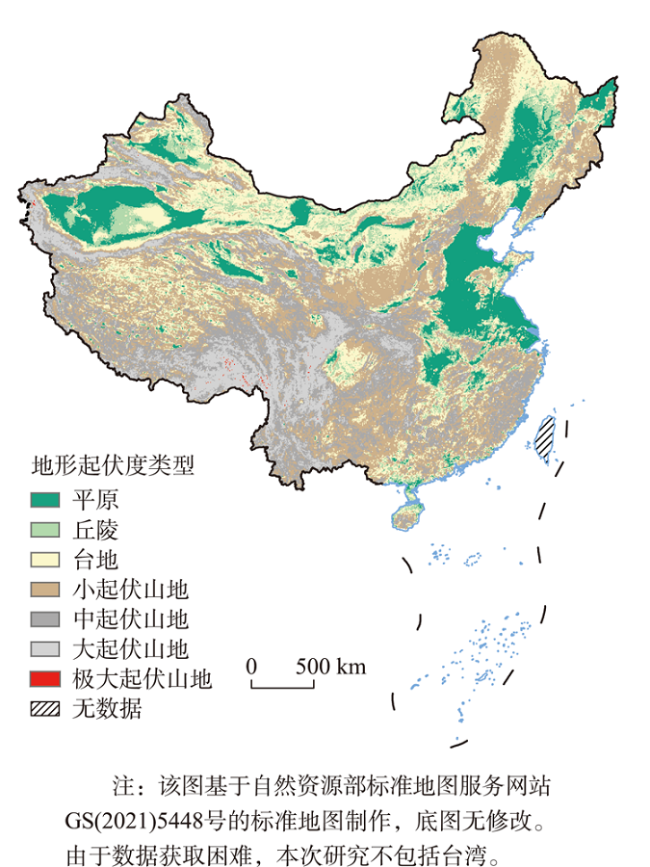
表1 地形起伏度划分标准与居民点占比Tab. 1 Topographic relief classification criteria and percentage of settlements |
| 地形起伏度类型 | 海拔高差/m | 居民点占比/% | ||
|---|---|---|---|---|
| 2000年 | 2010年 | 2020年 | ||
| 平原 | <30 | 38.70 | 34.14 | 37.97 |
| 台地 | 30~70 | 15.19 | 13.71 | 14.57 |
| 丘陵 | 70~200 | 18.65 | 20.43 | 19.03 |
| 小起伏山地 | 200~500 | 19.43 | 22.09 | 19.91 |
| 中起伏山地 | 500~1000 | 7.05 | 8.66 | 7.52 |
| 大起伏山地 | 1000~2500 | 0.96 | 0.96 | 0.99 |
| 极大起伏山地 | >2500 | 0.01 | 0.02 | 0.01 |
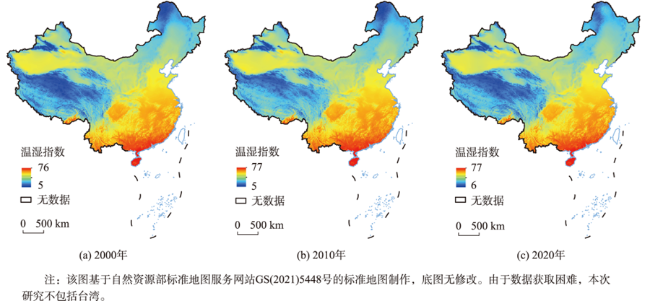
表2 温湿指数生理气候分级标准[23]Tab. 2 The biometeorology grade standard of THI |
| 温湿指数(THI) | 感觉程度 |
|---|---|
| <40 | 极冷、极不舒适 |
| 40~45 | 寒冷、不舒适 |
| 45~55 | 偏冷、较舒适 |
| 55~60 | 清、舒适 |
| 60~65 | 凉、非常舒适 |
| 65~70 | 暖、舒适 |
| 70~75 | 偏热、较舒适 |
| 75~80 | 闷热、不舒适 |
| >80 | 极其闷热、极不舒适 |
表3 数据来源Tab. 3 Sources of data required |
| 数据类型 | 数据来源 | 数据年份 |
|---|---|---|
| 气象数据 | 中国气象数据共享网(http://data.cma.cn/) | 2000、2010、2020年 |
| 全国DEM数据 | 中国科学院资源环境科学与数据中心(http://www.resdc.cn) | — |
| 土地利用数据 | 中国科学院资源环境科学与数据中心(http://www.resdc.cn) | 2000、2010、2020年 |
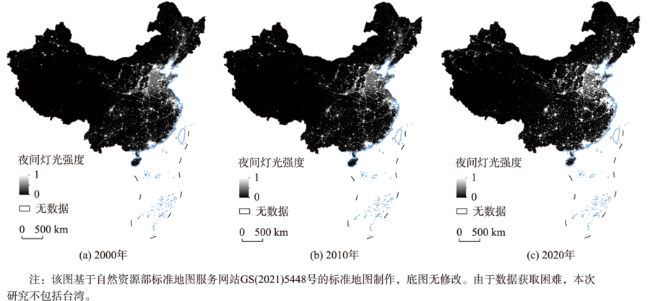
| 夜间灯光数据 | 美国国家环境信息中心网站(https://ngdc.noaa.gov) | 2000、2010、2020年 |
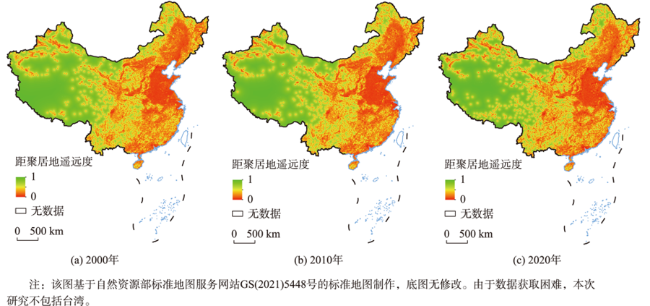
| 居民点数据 | 中国科学院资源环境科学与数据中心(http://www.resdc.cn) | 2000、2010、2020年 |
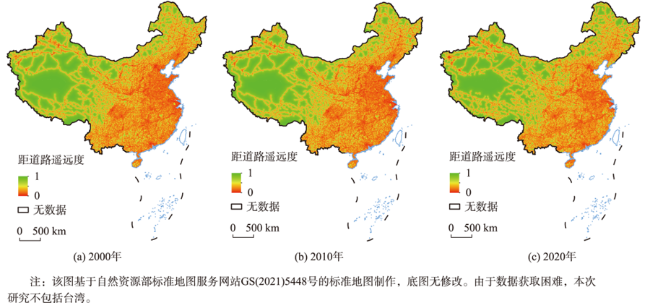
| 道路数据 | 地理遥感生态网(http://www.gisrs.cn) | 2000、2010、2020年 |
| 自然保护区数据 | 中国自然保护区标本资源共享平台(http://www.papc.cn) | 2020年 |
表4 2000—2020年中国不同省(自治区、直辖市)荒野地面积占比Tab. 4 Proportion of WAs in different provinces ( autonomous regions and municipalities directly under the Central Government ) of China from 2000 to 2020 |
| 地区 | 总面积/万km2 | 2000年 | 2010年 | 2020年 | |||||
|---|---|---|---|---|---|---|---|---|---|
| 荒野地面积 /万km2 | 荒野地面积 占比/% | 荒野地面积 /万km2 | 荒野地面积 占比/% | 荒野地面积 /万km2 | 荒野地面积占比/% | ||||
| 新疆维吾尔自治区 | 166.000 | 108.610 | 65.43 | 102.342 | 61.65 | 91.480 | 55.11 | ||
| 西藏自治区 | 112.840 | 74.883 | 66.36 | 66.305 | 58.76 | 63.913 | 56.64 | ||
| 青海省 | 72.230 | 52.137 | 72.18 | 50.486 | 69.90 | 48.940 | 67.76 | ||
| 内蒙古自治区 | 118.300 | 41.011 | 34.67 | 34.659 | 29.30 | 28.466 | 24.06 | ||
| 四川省 | 48.600 | 23.728 | 48.82 | 21.062 | 43.33 | 21.465 | 44.17 | ||
| 黑龙江省 | 47.300 | 19.359 | 40.93 | 20.652 | 43.66 | 9.982 | 21.10 | ||
| 甘肃省 | 45.590 | 16.600 | 36.41 | 9.087 | 19.93 | 8.948 | 19.63 | ||
| 云南省 | 39.410 | 8.802 | 22.33 | 8.814 | 22.36 | 8.919 | 22.63 | ||
| 吉林省 | 18.740 | 3.725 | 19.88 | 3.249 | 17.33 | 2.928 | 15.62 | ||
| 陕西省 | 20.560 | 1.699 | 8.26 | 1.713 | 8.33 | 1.600 | 7.78 | ||
| 辽宁省 | 14.800 | 1.560 | 10.54 | 1.091 | 7.37 | 0.954 | 6.45 | ||
| 广东省 | 18.000 | 1.436 | 7.98 | 1.141 | 6.34 | 1.133 | 6.29 | ||
| 广西壮族自治区 | 23.760 | 1.433 | 6.07 | 1.434 | 6.08 | 0.930 | 3.94 | ||
| 山西省 | 15.670 | 1.160 | 7.42 | 1.057 | 6.76 | 0.951 | 6.09 | ||
| 宁夏回族自治区 | 6.640 | 1.044 | 15.73 | 0.904 | 13.62 | 0.726 | 10.94 | ||
| 福建省 | 12.400 | 0.855 | 6.90 | 1.059 | 8.54 | 0.651 | 5.25 | ||
| 河北省 | 18.880 | 0.796 | 4.24 | 0.697 | 3.71 | 0.564 | 3.01 | ||
| 江西省 | 16.700 | 0.548 | 3.28 | 0.453 | 2.71 | 0.350 | 2.09 | ||
| 江苏省 | 10.720 | 0.468 | 4.56 | 0.310 | 3.02 | 0.265 | 2.58 | ||
| 安徽省 | 13.970 | 0.467 | 3.34 | 0.268 | 1.92 | 0.236 | 1.69 | ||
| 山东省 | 15.800 | 0.459 | 2.99 | 0.310 | 2.02 | 0.236 | 1.54 | ||
| 河南省 | 16.700 | 0.443 | 2.65 | 0.441 | 2.64 | 0.234 | 1.40 | ||
| 贵州省 | 17.610 | 0.440 | 2.50 | 0.346 | 1.96 | 0.350 | 1.99 | ||
| 湖北省 | 18.590 | 0.379 | 2.04 | 0.320 | 1.72 | 0.295 | 1.59 | ||
| 海南省 | 3.400 | 0.361 | 10.61 | 0.161 | 4.75 | 0.131 | 3.85 | ||
| 湖南省 | 21.180 | 0.332 | 1.57 | 0.334 | 1.57 | 0.335 | 1.58 | ||
| 北京市 | 1.641 | 0.221 | 13.18 | 0.122 | 7.24 | 0.091 | 5.43 | ||
| 浙江省 | 10.550 | 0.152 | 1.49 | 0.157 | 1.54 | 0.159 | 1.56 | ||
| 上海市 | 0.634 | 0.096 | 15.19 | 0.080 | 12.70 | 0.066 | 10.54 | ||
| 重庆市 | 8.240 | 0.093 | 1.14 | 0.057 | 0.69 | 0.055 | 0.67 | ||
| 天津市 | 1.197 | 0.062 | 5.18 | 0.040 | 3.34 | 0.035 | 2.92 | ||
| 香港特别行政区 | 0.110 | 0.010 | 8.63 | 0.005 | 4.54 | 0.003 | 3.09 | ||
| 澳门特别行政区 | 0.003 | 0.000 | 0.00 | 0.000 | 0.00 | 0.000 | 0.00 | ||
注:由于数据获取困难,本次研究不包括台湾。 |
表5 不同土地类型占荒野地面积Tab. 5 Area of WAs accounted for by different land types(万km2) |
| 土地利用类型 | 2000年荒野地面积 | 2010年荒野地面积 | 2020年荒野地面积 |
|---|---|---|---|
| 耕地 | 7.50 | 9.57 | 4.62 |
| 林地 | 64.31 | 62.21 | 55.85 |
| 草地 | 110.72 | 92.21 | 91.24 |
| 水域 | 11.01 | 9.98 | 9.53 |
| 建设用地 | 0.11 | 0.13 | 0.11 |
| 未利用地 | 151.27 | 123.29 | 115.85 |
| [1] |
|
| [2] |
|
| [3] |
|
| [4] |
|
| [5] |
曹越, 杨锐. 从全球到中国的荒野地识别:荒野制图研究综述与展望[J]. 环境保护, 2017, 45(14):39-44.
[
|
| [6] |
曹越, 张振威, 杨锐. 生态文明建设背景下的中国荒野保护策略[J]. 南京林业大学学报(人文社会科学版), 2017, 17(4):93-99.
[
|
| [7] |
|
| [8] |
|
| [9] |
李文君, 李鹏, 封志明, 等. 基于人居环境特征的青藏高原“无人区”空间界定[J]. 地理学报, 2021, 76(9):2118-2129.
[
|
| [10] |
|
| [11] |
|
| [12] |
|
| [13] |
|
| [14] |
|
| [15] |
|
| [16] |
李晓雪, 廖凌云, 兰思仁. 福建省荒野地空间分布研究[J]. 陕西林业科技, 2021, 49(5):20-27.
[
|
| [17] |
白芝珍. 东北三省人居环境气候舒适度时空分异及影响因素研究[D]. 大连: 辽宁师范大学, 2020.
[
|
| [18] |
谢龙云, 陈庭甫, 刘影, 等. 基于地形起伏度的江西省农村居民点空间分布特征研究[J]. 南昌航空大学学报(自然科学版), 2021, 35(2):34-42.
[
|
| [19] |
邱春琦, 朱怡萱, 李玉凤, 等. 基于夜间灯光和社会经济数据的城市扩张协调性研究[J]. 生态与农村环境学报, 2022, 38(3):289-299.
[
|
| [20] |
姜瑾斐, 公培臻, 王栋, 等. 基于SRTM的山东省地形起伏度研究[J]. 河北地质大学学报, 2021, 44(3):71-75.
[
|
| [21] |
张磊. 基于地形起伏度的地貌形态划分研究——以京津冀地区为例[D]. 石家庄: 河北师范大学, 2009.
[
|
| [22] |
陆福志, 鹿化煜. 秦岭—大巴山高分辨率气温和降水格点数据集的建立及其对区域气候的指示[J]. 地理学报, 2019, 74(5):875-888.
[
|
| [23] |
唐焰, 封志明, 杨艳昭. 基于栅格尺度的中国人居环境气候适宜性评价[J]. 资源科学, 2008, 30(5):648-653.
[
|
| [24] |
曹越, 龙瀛, 杨锐. 中国大陆国土尺度荒野地识别与空间分布研究[J]. 中国园林, 2017, 33(6):26-33.
[
|
| [25] |
|
| [26] |
|
| [27] |
许丽丽, 李宝林, 袁烨城, 等. 2000—2010年中国耕地变化与耕地占补平衡政策效果分析[J]. 资源科学, 2015, 37(8):1543-1551.
[
|
| [28] |
|
| [29] |
|
| [30] |
段雯娟. 守住“地球最后的荒野”[J]. 地球, 2018(12):10-18.
[
|
| [31] |
|
| [32] |
林聪田, 肖翠, 李善元, 等. 中国物种多样性的大国[J]. 森林与人类, 2021(9):22-45.
[
|
/
| 〈 |
|
〉 |
