
Journal of Geo-information Science >
The Spatial-Temporal Patterns and Influencing Factors of China's Tech Start-ups: A Study based on the Entrepreneurial Ecosystem
Received date: 2022-01-16
Revised date: 2022-03-18
Online published: 2023-04-19
Supported by
National Natural Science Foundation of China(41771173)
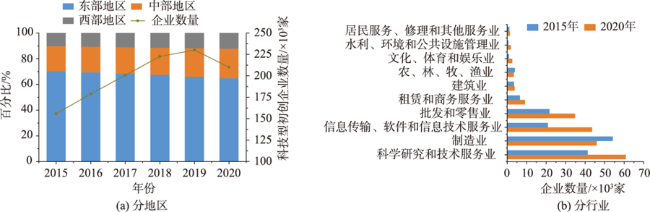
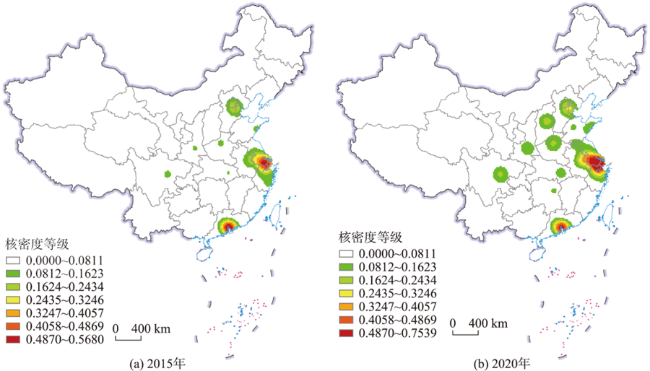
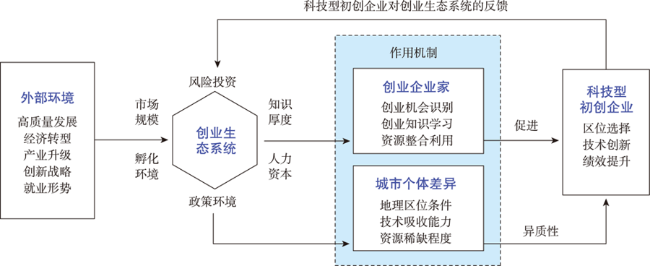
The deepening of the innovation-driven strategy has promoted the prosperity of the entrepreneurial economy, and the high-tech start-ups have increasingly become the decisive force to promote China's tech progress and high-quality economic development. With the assistance of the data of China's tech start-ups from 2015 to 2020, this paper combines the methods of Thiel index and kernel density estimation to explore the spatial-temporal evolution characteristics. At the same time, an analytical framework is constructed for the development of tech start-ups based on the entrepreneurial ecosystem theory. The OLS model and SARAR model are established to quantitatively identify the influential factors of the distribution of tech start-ups. Three conclusions are drawn: (1) From the perspective of time series, the number of tech start-ups in China is growing rapidly from 2015 to 2020. The tertiary industry enterprises occupy a dominant position in its industry composition, and the proportion of the number is gradually increasing. However, the distribution in the urban system presents a continuous hierarchical structure. Most cities have little change in the hierarchical system, and some cities have jumped up the hierarchy in the wave of mass entrepreneurship and innovation; (2) From the perspective of spatial pattern, China's tech start-ups present a multi-core distribution pattern, with the Yangtze River Delta and Pearl River Delta as the main core, and The Beijing-Tianjin-Hebei region as the secondary core. Entrepreneurship hot spots have expanded from the three core regions to more regions, with Chengdu, Wuhan, Zhengzhou, Xi'an, and other cities becoming secondary cluster centers. But the imbalance between the three regions of East, Central, and West is increasing, the intra-regional differences are greater than the inter-regional differences; (3) Venture capital, knowledge thickness, human capital, market size, incubation environment, and policy environment have positive effects on the development of tech start-ups. Entrepreneurial ecosystem also shows the influence of spatial dependence and spatial heterogeneity. Moreover, the effect intensity and relative importance of different influencing factors are different in different development stages. The research results are helpful to promote the discussion on location choice of regional emerging industries and the development of entrepreneurial ecosystem theory. In the future, the government should attach importance to the construction of high-quality tech entrepreneurship ecosystem, and the driving path suitable for the development of local tech start-ups should be selected according to local conditions. At the same time, it is necessary to strengthen resource interconnection and strategic cooperation with geographical proximity areas.

LIU Le , SHENG Kerong , WANG Chuanyang . The Spatial-Temporal Patterns and Influencing Factors of China's Tech Start-ups: A Study based on the Entrepreneurial Ecosystem[J]. Journal of Geo-information Science, 2023 , 25(2) : 340 -353 . DOI: 10.12082/dqxxkx.2023.220028
表1 科技型初创企业视角下的城市等级分布Tab. 1 Hierachical distribution of cities from the perspective of tech start-ups |
| 等级 | 2015年 | 2020年 | |||
|---|---|---|---|---|---|
| 城市(科技型初创企业数量占比/%) | 数量/个 | 城市(科技型初创企业数量占比/%) | 数量/个 | ||
| Ⅰ | 深圳(7.09)、苏州(5.67)、上海(4.50)、广州(4.45)、北京(3.72)、南京(3.61) | 6 | 苏州(5.89)、南京(5.48)、深圳(4.75)、上海(4.31)、杭州(3.87)、太原(3.54)、天津(3.44) | 7 | |
| Ⅱ | 天津(3.03)、杭州(2.59)、西安(2.12)、青岛(2.09)、成都(1.97)、无锡(1.88)、东莞(1.86)、佛山(1.78)、温州(1.68)、太原(1.65)、武汉(1.65)、郑州(1.57)、宁波(1.45) | 13 | 广州(3.23)、成都(2.79)、西安(2.68)、郑州(2.51)、宁波(2.36)、北京(2.24)、青岛(1.90)、武汉(1.72)、无锡(1.69)、合肥(1.52) | 10 | |
| Ⅲ | 合肥(1.25)、长沙(1.21)、济南(1.20)、盐城(0.92)、嘉兴(0.91)、中山(0.89)、重庆(0.88)、南通(0.86)、绍兴(0.85)、徐州(0.78)、赣州(0.76)、常州(0.75)、金华(0.72)、台州(0.69)、惠州(0.65)、泰州(0.65)、大连(0.62)、南昌(0.61)、沈阳(0.60)、江门(0.59)、福州(0.59)、湖州(0.59)、石家庄(0.58)、扬州(0.57)、厦门(0.56)、珠海(0.56)、宿迁(0.53)、烟台(0.53)、洛阳(0.50)、泉州(0.46)、潍坊(0.46) | 34 | 佛山(1.37)、徐州(1.34)、长沙(1.16)、哈尔滨(1.15)、盐城(1.13)、济南(1.11)、东莞(1.06)、温州(0.93)、赣州(0.85)、嘉兴(0.84)、南通(0.82)、烟台(0.80)、沈阳(0.78)、重庆(0.71)、大连(0.68)、南昌(0.66)、常州(0.66)、洛阳(0.65)、绵阳(0.64)、宿迁(0.61)、福州(0.61)、绍兴(0.59)、石家庄(0.58)、中山(0.58)、惠州(0.53)、湖州(0.50)、泰州(0.45)、金华(0.45)、珠海(0.45)、威海(0.44)、芜湖(0.44)、台州(0.44)、江门(0.43)、泉州(0.42)、南宁(0.42)、潍坊(0.41)、宜宾(0.41) | 37 | |
| Ⅳ | 其他城市 | 244 | 其他城市 | 243 | |
表2 2015—2020年中国科技型初创企业分布的泰尔指数Tab. 2 Thiel index of the distribution of China's tech start-ups from 2015 to 2020 |
| 年份 | 指标 | 东部 | 中部 | 西部 | 区域间差异 | 区域内差异 | |
|---|---|---|---|---|---|---|---|
| 2015 | 泰尔指数 | 1.2044 | 0.9301 | 0.7769 | 1.2417 | 0.2723 | 0.9321 |
| 贡献率 | 0.5421 | 0.1261 | 0.1056 | 0.2261 | 0.7739 | ||
| 2016 | 泰尔指数 | 1.2252 | 0.9520 | 0.8463 | 1.2723 | 0.2600 | 0.9652 |
| 贡献率 | 0.5393 | 0.1376 | 0.1110 | 0.2122 | 0.7878 | ||
| 2017 | 泰尔指数 | 1.2328 | 0.9560 | 0.9032 | 1.3256 | 0.2466 | 0.9862 |
| 贡献率 | 0.5311 | 0.1496 | 0.1192 | 0.2001 | 0.7999 | ||
| 2018 | 泰尔指数 | 1.2413 | 0.9579 | 0.9655 | 1.3849 | 0.2328 | 1.0086 |
| 贡献率 | 0.5209 | 0.1634 | 0.1281 | 0.1875 | 0.8125 | ||
| 2019 | 泰尔指数 | 1.2544 | 0.9723 | 1.0477 | 1.4095 | 0.2138 | 1.0406 |
| 贡献率 | 0.5117 | 0.1852 | 0.1327 | 0.1704 | 0.8296 | ||
| 2020 | 泰尔指数 | 1.2620 | 0.9874 | 1.0838 | 1.4186 | 0.2001 | 1.0619 |
| 贡献率 | 0.5080 | 0.1966 | 0.1368 | 0.1585 | 0.8415 | ||
表3 中国科技型初创企业分布的影响因素说明Tab. 3 Source and description of the influencing factors of the distribution of China's tech start-ups |
| 量 | 名称 | 含义 | 数据来源 |
|---|---|---|---|
| Startups | 企业数量 | 科技型初创企业数量/家 | 企查查网站(https://www.qcc.com/) |
| Vcpe | 风险投资 | 城市风险投资金额/万元 | Wind数据库(https://www.wind.com.cn/ ) |
| Knowle | 知识厚度 | 每万人发明专利申请数量/件 | 佰腾网(https://www.baiten.cn/) |
| Human | 人力资本 | 全市普通本专科在校学生数/人 | 《中国城市统计年鉴》[37] |
| Market | 市场规模 | 市场潜力指数 | 《中国城市统计年鉴》[37] |
| Incuba | 孵化环境 | 城市创业孵化器数量/家 | 《中国火炬统计年鉴》[38]、《中国城市统计年鉴》[37]、《中国统计年鉴》[39] |
| Capital | 政策环境 | 城市行政级别虚拟变量 | 根据城市行政级别赋值1~4 |
表4 中国科技型初创企业分布影响因素的基准模型回归结果Tab. 4 Regression results of the distribution of China's tech start-ups |
| 变量 | 2015年 | 2020年 | |||
|---|---|---|---|---|---|
| 模型1(OLS) | 模型2(SARAR) | 模型3(OLS) | 模型4(SARAR) | ||
| Vcpe | 0.022** | 0.019** | 0.019* | 0.022** | |
| (2.13) | (2.15) | (1.86) | (2.38) | ||
| Knowle | 0.424*** | 0.418*** | 0.442*** | 0.613*** | |
| (7.92) | (7.07) | (6.58) | (7.67) | ||
| Human | 0.202*** | 0.192*** | 0.149*** | 0.102*** | |
| (5.71) | (5.93) | (4.06) | (2.98) | ||
| Market | 1.091*** | 0.734*** | 0.944*** | 0.506** | |
| (7.10) | (3.71) | (5.98) | (2.29) | ||
| Incuba | 0.275*** | 0.462*** | 0.426*** | 0.515*** | |
| (3.89) | (5.21) | (5.93) | (5.85) | ||
| Capital | 0.351*** | 0.292** | 0.469*** | 0.380*** | |
| (2.61) | (2.27) | (3.27) | (2.74) | ||
| 常数 | -6.022*** | -3.848** | -5.779*** | -2.928*** | |
| (-5.88) | (-2.93) | (-5.39) | (-1.95) | ||
| λ | - | 0.008 | - | 0.006 | |
| - | (1.62) | - | (1.08) | ||
| ρ | - | 0.093*** | - | 0.100*** | |
| - | (6.54) | - | (6.40) | ||
| Max vif | 2.47 | 2.47 | 2.58 | 2.58 | |
| Mean vif | 2.07 | 2.07 | 2.02 | 2.02 | |
| 样本数 | 269 | 269 | 269 | 269 | |
| AIC | 522.390 | 485.826 | 591.956 | 557.624 | |
| BIC | 547.553 | 521.773 | 617.119 | 593.571 | |
| R2/Loglikelihood | 0.808 | -232.913 | 0.789 | -268.812 | |
注:括号中数值是估计参数相对应稳健标准误的t检验值和z检验值;***、**和*分别代表在1%、5%和10%的水平上显著。Max vif和 Mean vif分别报告了方差膨胀因子的最大值和平均值。 |
表5 空间异质性检验结果Tab. 5 Test results of spatial heterogeneity |
| 变量 | 2015年 | 2020年 | |||||
|---|---|---|---|---|---|---|---|
| 模型1(东部) | 模型2(中部) | 模型3(西部) | 模型4(东部) | 模型5(中部) | 模型6(西部) | ||
| Vcpe | 0.007 | 0.160 | 0.033 | 0.032*** | 0.004 | 0.022 | |
| (0.66) | (1.36) | (1.33) | (2.69) | (0.35) | (1.14) | ||
| Knowle | 0.381*** | 0.301*** | 0.498*** | 0.448*** | 0.564*** | 1.064*** | |
| (4.97) | (2.75) | (3.42) | (4.69) | (3.75) | (8.25) | ||
| Human | 0.378*** | 0.179*** | 0.037 | 0.320*** | 0.162** | -0.009 | |
| (6.70) | (3.10) | (0.64) | (4.39) | (2.13) | (-0.24) | ||
| Market | 1.154*** | 0.876*** | 0.918* | 0.377 | 1.193*** | 1.779*** | |
| (2.87) | (2.73) | (1.99) | (0.83) | (3.92) | (3.43) | ||
| Incuba | 0.451*** | 0.907*** | 0.791*** | 0.579*** | 0.953*** | 0.972*** | |
| (4.01) | (5.09) | (3.17) | (4.38) | (5.99) | (5.01) | ||
| Capital | -0.023 | 0.485* | 0.259 | 0.148 | 0.302 | -0.788** | |
| (-0.16) | (1.95) | (0.76) | (1.03) | (1.02) | (-2.33) | ||
| 常数 | -8.225*** | -4.891** | -3.554 | -4.002 | -8.670*** | -10.397*** | |
| (-2.97) | (-2.22) | (-1.17) | (-1.24) | (-4.15) | (-3.00) | ||
| λ | 0.003 | -0.009 | - | 0.002 | -0.004 | -0.007 | |
| (0.48) | (-0.86) | - | (0.36) | (-0.45) | (-0.52) | ||
| ρ | 0.121*** | 0.151*** | - | 0.071** | 0.131*** | 0.097*** | |
| (5.12) | (11.09) | - | (2.34) | (6.94) | (2.90) | ||
| Max vif | 2.89 | 2.48 | 2.62 | 4.45 | 2.80 | 3.01 | |
| Mean vif | 2.52 | 1.85 | 1.53 | 3.00 | 2.18 | 2.13 | |
| 样本数 | 96 | 103 | 70 | 96 | 103 | 70 | |
| AIC | 133.143 | 177.167 | 150.855 | 163.341 | 201.802 | 145.440 | |
| BIC | 158.786 | 203.514 | 166.595 | 188.984 | 228.149 | 167.925 | |
| R2/Loglikelihood | -56.571 | -78.583 | 0.691 | -71.670 | -90.901 | -62.720 | |
注:括号中数值是估计参数相对应稳健标准误的t检验值和z检验值;***、**和*分别代表在1%、5%和10%的水平上显著;Max vif和 Mean vif分别报告了方差膨胀因子的最大值和平均值。2015年西部地区科技型初创企业的Moran's I指数未通过显著性检验,故模型3报告了OLS模型回归结果,其余方程报告了SARAR模型回归结果。 |
| [1] |
|
| [2] |
|
| [3] |
新华社. 中华人民共和国国民经济和社会发展第十四个五年规划和2035年远景目标纲要[EB/OL].(2021-03-13)[2022-01-16]. http://www.gov.cn/xinwen/2021-03/13/content_5592681.htm.
[ Xinhua News Agency. Outline of the 14th five-year plan for national economic and social development of the People's Republic of China and the vision for 2035[EB/OL].(2021-03-13)[2022-01-16]. http://www.gov.cn/xinwen/2021-03/13/content_5592681.htm.
|
| [4] |
|
| [5] |
|
| [6] |
宋金彦, 李仙德, 徐宁. 中国新创通信设备制造企业空间格局及其影响因素研究[J]. 地理科学进展, 2021, 40(6):911-924.
[
|
| [7] |
陈肖飞, 韩腾腾, 栾俊婉, 等. 新创企业的时空分异与区位选择——基于中国汽车制造业的实证研究[J]. 地理研究, 2021, 40(6):1749-1767.
[
|
| [8] |
史进, 贺灿飞. 中国新企业成立空间差异的影响因素——以金属制品业为例[J]. 地理研究, 2018, 37(7):1282-1296.
[
|
| [9] |
段吕晗, 杜德斌, 黄筱彧. 上海互联网新创企业的时空演化及影响因素[J]. 地理科学进展, 2019, 38(3):383-394.
[
|
| [10] |
刘程军, 王周元晔, 李续双, 等. 互联网新创企业空间格局演化及区位选择——以杭州为例[J]. 经济地理, 2021, 41(6):107-115.
[
|
| [11] |
符文颖, 董诗涵. 技术型新创企业的地理学研究进展[J]. 地理科学, 2019, 39(9):1398-1406.
[
|
| [12] |
高建, 石书德. 中国转型经济背景下创业地区差异的决定因素研究[J]. 科学学研究, 2009, 27(7):1011-1019.
[
|
| [13] |
|
| [14] |
|
| [15] |
|
| [16] |
|
| [17] |
|
| [18] |
宓泽锋, 周灿, 尚勇敏, 等. 本地知识基础对新兴产业创新集群形成的影响——以中国燃料电池产业为例[J]. 地理研究, 2020, 39(7):1478-1489.
[
|
| [19] |
|
| [20] |
肖凡, 任建造, 伍敏冬, 等. 21世纪以来中国高新技术企业的时空分布和影响机制[J]. 经济地理, 2018, 38(2):27-35.
[
|
| [21] |
刘青, 李贵才, 仝德, 等. 基于ESDA的深圳市高新技术企业空间格局及影响因素[J]. 经济地理, 2011, 31(6):926-933.
[
|
| [22] |
周灿, 曹贤忠, 曾刚. 中国电子信息产业创新的集群网络模式与演化路径[J]. 地理研究, 2019, 38(9):2212-2225.
[
|
| [23] |
丁玥, 朱华晟, 贺清灿. 广东省创业活动的地区差异及其影响因素[J]. 经济地理, 2017, 37(11):92-98.
[
|
| [24] |
伊查克·爱迪思. 企业生命周期[M]. 北京: 中国社会科学出版社,1997.
Adizes I. Corporate lifecycles[M]. Beijing: China Social Science Press, 1997. ]
|
| [25] |
朱吉庆. 中国国际新创企业成长研究[M]. 上海: 复旦大学出版社, 2010.
[
|
| [26] |
蒋春燕, 赵曙明. 社会资本和公司企业家精神与绩效的关系:组织学习的中介作用——江苏与广东新兴企业的实证研究[J]. 管理世界, 2006(10):90-99.
[
|
| [27] |
|
| [28] |
|
| [29] |
国家统计局. 关于修订《三次产业划分规定(2012)》的通知[EB/OL].(2018-03-23)[2022-01-16]. http://www.stats.gov.cn/xxgk/tjbz/gjtjbz/201804/t20180402_1758923.html
[ National Bureau of Statistics of China. Notice on revising provisions on the division of tertiary industries (2012)[EB/OL]]. (2018-03-23)[2022-01-16]. http://www.stats.gov.cn/xxgk/tjbz/gjtjbz/201804/t20180402_1758923.html
|
| [30] |
|
| [31] |
|
| [32] |
赵涛, 刘文光, 边伟军. 区域科技创业生态系统的结构模式与功能机制研究[J]. 科技管理研究, 2011, 31(24):78-82.
[
|
| [33] |
|
| [34] |
李正卫, 刘济浔, 潘家栋. 创业生态系统中的政府治理:新创企业成长视角[J]. 科研管理, 2019, 40(12):42-50.
[
|
| [35] |
|
| [36] |
曾婧婧, 温永林. 政府创业政策对城市创业的影响及其作用机制——基于国家创业型城市的准自然实验[J]. 经济管理, 2021, 43(4):55-70.
[
|
| [37] |
国家统计局城市社会经济调查司. 中国城市统计年鉴[M]. 北京: 中国统计出版社,2015-2020.
[ Department of Urban Surveys National Bureau of Statistics of China. China city statics yearbook[M]. Beijing: China Statistics Press, 2015-2020. ]
|
| [38] |
科技部火炬高技术产业开发中心. 中国火炬统计年鉴[M]. 北京: 中国统计出版社,2015-2020.
[ Torch High Technology Industry Development Center Ministry of Science & Technology. China torch statistical yearbook[M]. Beijing: China Statistics Press, 2015-2020. ]
|
| [39] |
国家统计局. 中国统计年鉴[M]. 北京: 中国统计出版社,2015-2020.
National Bureau of Statistics of China. China statistical yearbook[M]. Beijing: China Statistics Press, 2015-2020. ]
|
| [40] |
|
| [41] |
赵建吉, 王艳华, 吕可文, 等. 内陆区域中心城市金融产业集聚的演化机理——以郑东新区为例[J]. 地理学报, 2017, 72(8):1392-1407.
[
|
/
| 〈 |
|
〉 |