
Journal of Geo-information Science >
A Land Use Change Simulation Model: Coupling of Evolutionary Algorithm and FLUS Model
Received date: 2022-08-28
Revised date: 2022-12-23
Online published: 2023-04-19
Supported by
National Natural Science Foundation of China(71163008)
Philosophy and Social Science Layout Research Project of Guangxi Province(22FGL020)
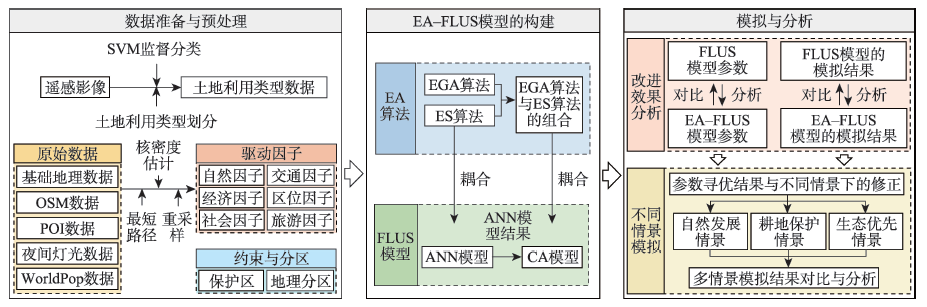
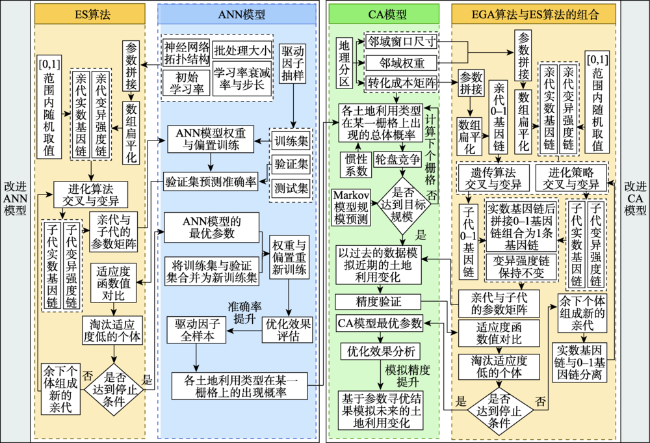
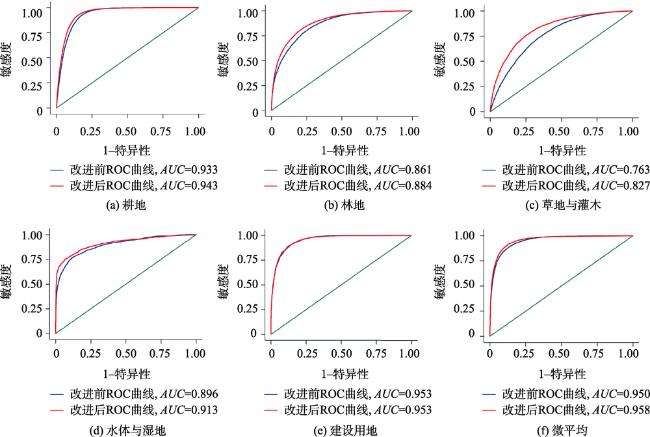
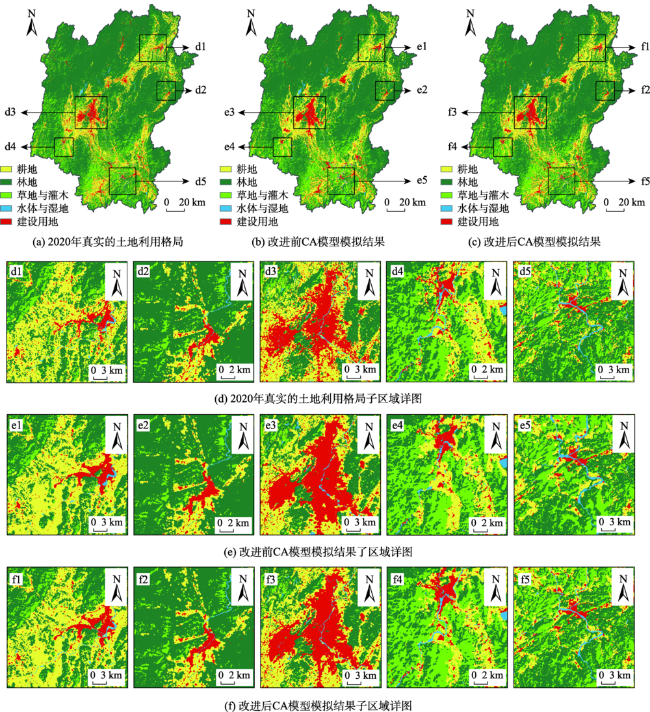
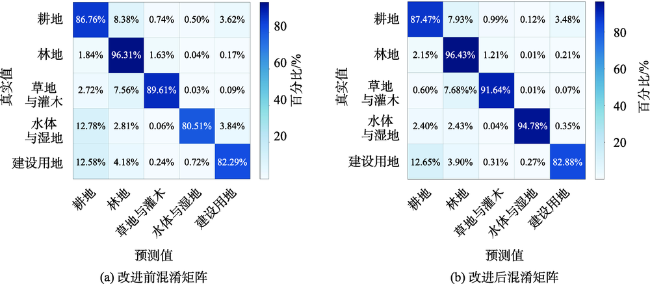
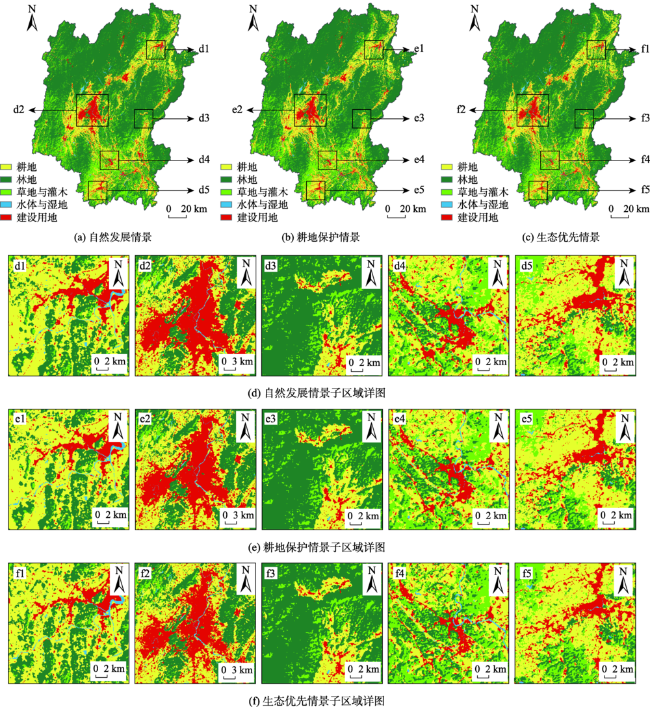
It is of great significance to study how to set parameters of land use change simulation models more scientifically and objectively, in order to avoid the problem of poor simulation caused by improper parameters setting in a complex model. In this paper, the EA-FLUS model with parameter optimization function was constructed by coupling Evolutionary Algorithm (EA) and FLUS model. This model first optimized the parameters of the artificial neural network model in the FLUS model through evolutionary strategy to improve the prediction accuracy of the probability distribution of each land use type. On this basis, combined with geospatial partition, the parameters of the cellular automaton model in the FLUS model were adjusted by using the combination of elitist genetic algorithm and evolutionary strategy to improve the simulation accuracy. In the empirical study phase, taking Guilin as the study area, this paper analyzed the improvement of EA-FLUS model by partition simulation of land use change. In addition, the natural development scenario, cultivated land protection scenario, and ecological priority scenario were set up to simulate the land use change in Guilin from 2020 to 2030. The results show that: (1) Compared with the parameters setting based on experience and historical characteristics of land use change, the parameters optimization result using evolutionary algorithms was closer to the policy orientation in the study area, and better reflected the diversified development trends of various land use types in different geospatial partition; (2) Compared with the FLUS model, the EA-FLUS model had more advantages in land use change simulation with geospatial partition. The overall accuracy, Kappa coefficient, and FoM coefficient of the simulation result were increased by 0.56%, 0.011, and 0.009, respectively; (3) The construction land and cultivated land in Guilin showed a strong expansion trend, but the forested land showed a shrinking trend. Further strengthening the protection of ecological space would help to slow down the expansion of construction land and cultivated land. The research results not only enrich the existing land use change simulation techniques and methods, but also provide a certain theoretical basis and scientific basis for urban planning and sustainability research.
YU Qinping , WU Zhenhua , WANG Yabei . A Land Use Change Simulation Model: Coupling of Evolutionary Algorithm and FLUS Model[J]. Journal of Geo-information Science, 2023 , 25(3) : 510 -528 . DOI: 10.12082/dqxxkx.2023.220637
表1 土地利用变化驱动因子相关信息Tab. 1 Information of driving factors for land use change |
| 数据类别 | 数据名称 | 分辨率/m | 年份 | 来源 |
|---|---|---|---|---|
| 自然因子 | 高程 | 90 | 2019 | 地理空间数据云(http://www.gscloud.cn) |
| 坡度 | 90 | 2019 | 根据高程计算 | |
| 距河流湖泊距离 | 90 | 2020 | OpenStreetMap(https://www.openstreetmap.org) | |
| NDVI | 90 | 2019 | 地理国情监测云平台(www.dsac.cn) | |
| 经济因子 | 夜间灯光强度 | 130 | 2018 | 珞珈一号(http://59.175.109.173:8888/app/login.html) |
| 社会因子 | 人口密度 | 100 | 2020 | WorldPop(https://www.worldpop.org) |
| 交通因子 | 距铁路距离 | 90 | 2021 | OpenStreetMap(https://www.openstreetmap.org) |
| 距高速公路距离 | 90 | 2021 | ||
| 距国道省道距离 | 90 | 2021 | ||
| 区位因子 | 距市中心距离 | 90 | 2021 | OpenStreetMap(https://www.openstreetmap.org) |
| 距区中心距离 | 90 | 2021 | ||
| 旅游因子 | 距风景名胜距离 | 90 | 2020 | 高德地图Web服务(https://lbs.amap.com/api/webservice) |
表2 基于历史特征设置的各分区邻域窗口尺寸与邻域权重Tab. 2 Window size and neighborhood weights of each partition based on the historical characteristics |
| 分区 | 窗口尺寸 | 地类1 | 地类2 | 地类3 | 地类4 | 地类5 | 分区 | 窗口尺寸 | 地类1 | 地类2 | 地类3 | 地类4 | 地类5 |
|---|---|---|---|---|---|---|---|---|---|---|---|---|---|
| 1 | 5 | 0.59 | 0.00 | 1.00 | 0.58 | 0.66 | 2 | 5 | 0.39 | 0.00 | 0.68 | 0.52 | 1.00 |
| 3 | 5 | 1.00 | 0.00 | 0.86 | 0.66 | 0.81 | 4 | 5 | 1.00 | 0.00 | 0.01 | 0.38 | 0.57 |
| 5 | 5 | 0.86 | 0.00 | 0.74 | 0.64 | 1.00 | 6 | 5 | 1.00 | 0.00 | 0.93 | 0.75 | 0.98 |
| 7 | 5 | 0.49 | 0.00 | 0.82 | 0.62 | 1.00 | 8 | 5 | 0.50 | 0.00 | 1.00 | 0.57 | 0.81 |
| 9 | 5 | 1.00 | 0.00 | 0.55 | 0.59 | 0.82 | 10 | 5 | 1.00 | 0.00 | 0.65 | 0.59 | 0.72 |
| 11 | 5 | 1.00 | 0.00 | 0.41 | 0.50 | 0.61 | 12 | 5 | 1.00 | 0.00 | 0.85 | 0.69 | 0.96 |
注:地类1-耕地;地类2-林地;地类3-草地与灌木;地类4-水体与湿地;地类5-建设用地。 |
表3 基于历史特征设置的各分区转换成本矩阵Tab. 3 Conversion cost matrix of each partition based on the historical characteristics |
| 地类编号 | 分区 | 1 | 2 | 3 | 4 | 5 | 分区 | 1 | 2 | 3 | 4 | 5 | 分区 | 1 | 2 | 3 | 4 | 5 | 分区 | 1 | 2 | 3 | 4 | 5 | |||
|---|---|---|---|---|---|---|---|---|---|---|---|---|---|---|---|---|---|---|---|---|---|---|---|---|---|---|---|
| 1 | 1 | 1 | 1 | 1 | 1 | 1 | 2 | 1 | 1 | 0 | 0 | 1 | 3 | 1 | 1 | 0 | 1 | 1 | 4 | 1 | 1 | 1 | 1 | 1 | |||
| 2 | 1 | 1 | 1 | 1 | 1 | 1 | 1 | 1 | 0 | 1 | 1 | 1 | 1 | 0 | 1 | 1 | 1 | 1 | 0 | 1 | |||||||
| 3 | 0 | 0 | 1 | 0 | 1 | 0 | 0 | 1 | 0 | 1 | 0 | 0 | 1 | 0 | 0 | 1 | 1 | 1 | 0 | 1 | |||||||
| 4 | 1 | 1 | 1 | 1 | 1 | 1 | 1 | 0 | 1 | 1 | 1 | 1 | 0 | 1 | 1 | 1 | 1 | 1 | 1 | 1 | |||||||
| 5 | 0 | 0 | 0 | 1 | 1 | 0 | 0 | 0 | 1 | 1 | 0 | 0 | 0 | 0 | 1 | 0 | 0 | 0 | 1 | 1 | |||||||
| 1 | 5 | 1 | 1 | 1 | 1 | 1 | 6 | 1 | 1 | 1 | 1 | 1 | 7 | 1 | 1 | 0 | 1 | 1 | 8 | 1 | 1 | 0 | 0 | 1 | |||
| 2 | 1 | 1 | 1 | 0 | 1 | 1 | 1 | 1 | 1 | 1 | 1 | 1 | 1 | 1 | 1 | 1 | 1 | 1 | 0 | 1 | |||||||
| 3 | 1 | 1 | 1 | 0 | 1 | 0 | 0 | 1 | 0 | 0 | 0 | 0 | 1 | 0 | 0 | 0 | 0 | 1 | 0 | 0 | |||||||
| 4 | 1 | 1 | 1 | 1 | 1 | 1 | 1 | 0 | 1 | 1 | 1 | 1 | 0 | 1 | 1 | 1 | 1 | 0 | 1 | 1 | |||||||
| 5 | 0 | 0 | 0 | 1 | 1 | 0 | 0 | 0 | 0 | 1 | 0 | 0 | 0 | 0 | 1 | 0 | 0 | 0 | 0 | 1 | |||||||
| 1 | 9 | 1 | 1 | 1 | 1 | 1 | 10 | 1 | 1 | 1 | 1 | 1 | 11 | 1 | 1 | 1 | 0 | 1 | 12 | 1 | 1 | 1 | 1 | 1 | |||
| 2 | 1 | 1 | 1 | 0 | 1 | 1 | 1 | 1 | 0 | 1 | 1 | 1 | 1 | 0 | 1 | 1 | 1 | 1 | 0 | 1 | |||||||
| 3 | 1 | 1 | 1 | 0 | 1 | 1 | 1 | 1 | 0 | 1 | 1 | 1 | 1 | 0 | 1 | 1 | 1 | 1 | 0 | 0 | |||||||
| 4 | 1 | 1 | 1 | 1 | 1 | 1 | 1 | 1 | 1 | 1 | 1 | 1 | 1 | 1 | 1 | 1 | 1 | 1 | 1 | 1 | |||||||
| 5 | 0 | 0 | 0 | 1 | 1 | 0 | 0 | 0 | 0 | 1 | 0 | 0 | 0 | 1 | 1 | 0 | 0 | 0 | 1 | 1 |
注:地类1-耕地;地类2-林地;地类3-草地与灌木;地类4-水体与湿地;地类5-建设用地。 |
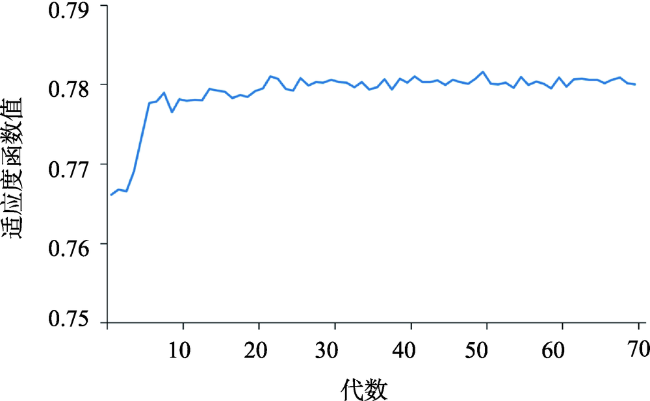
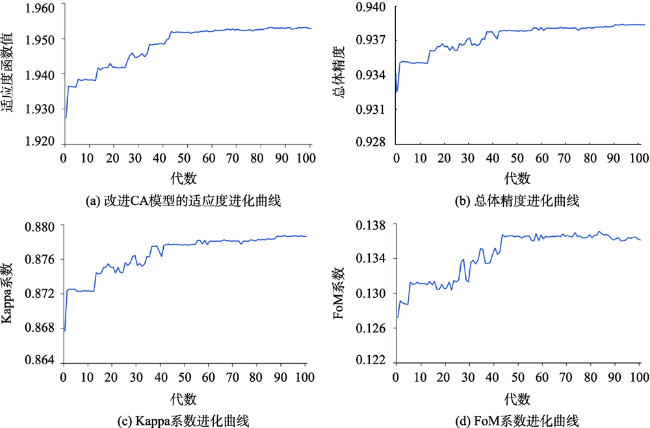
图9 改进CA模型的适应度函数值、总体精度、Kappa系数、FoM系数进化曲线Fig. 9 The fitness function value, overall accuracy, Kappa coefficient and FoM coefficient evolution curve of improved CA model |
表4 模拟精度评价指标对比Tab. 4 Comparison of simulation accuracy evaluation indicators |
| 指标 | 总体精度/% | Kappa系数 | FoM系数 |
|---|---|---|---|
| 改进前 | 93.25 | 0.868 | 0.127 |
| 改进后 | 93.81 | 0.879 | 0.136 |
表5 进化算法运算获得的各分区邻域窗口尺寸、邻域权重Tab. 5 Window size and neighborhood weights of each partition obtained by evolutionary algorithm operation |
| 分区 | 窗口尺寸 | 地类1 | 地类2 | 地类3 | 地类4 | 地类5 | 分区 | 窗口尺寸 | 地类1 | 地类2 | 地类3 | 地类4 | 地类5 |
|---|---|---|---|---|---|---|---|---|---|---|---|---|---|
| 1 | 3 | 0.62 | 0.33 | 0.48 | 1.00 | 1.00 | 2 | 7 | 1.00 | 0.00 | 1.00 | 0.88 | 1.00 |
| 3 | 9 | 0.99 | 0.00 | 1.00 | 1.00 | 1.00 | 4 | 9 | 1.00 | 0.00 | 0.71 | 0.39 | 0.59 |
| 5 | 9 | 0.79 | 0.74 | 0.91 | 0.65 | 1.00 | 6 | 11 | 1.00 | 0.12 | 0.10 | 0.00 | 0.17 |
| 7 | 5 | 0.36 | 0.70 | 0.22 | 0.40 | 0.60 | 8 | 5 | 1.00 | 0.13 | 1.00 | 0.26 | 0.59 |
| 9 | 11 | 0.36 | 0.09 | 0.16 | 0.53 | 0.51 | 10 | 3 | 0.90 | 0.57 | 0.79 | 1.00 | 1.00 |
| 11 | 5 | 0.85 | 0.41 | 0.00 | 1.00 | 0.45 | 12 | 3 | 1.00 | 0.00 | 1.00 | 0.76 | 0.83 |
注:地类1-耕地;地类2-林地;地类3-草地与灌木;地类4-水体与湿地;地类5-建设用地。 |
表6 进化算法运算获得的各分区转换成本矩阵Tab. 6 Conversion cost matrix of each partition obtained by evolutionary algorithm operation |
| 地类编号 | 分区 | 1 | 2 | 3 | 4 | 5 | 分区 | 1 | 2 | 3 | 4 | 5 | 分区 | 1 | 2 | 3 | 4 | 5 | 分区 | 1 | 2 | 3 | 4 | 5 | |||
|---|---|---|---|---|---|---|---|---|---|---|---|---|---|---|---|---|---|---|---|---|---|---|---|---|---|---|---|
| 1 | 1 | 1 | 1 | 1 | 0 | 1 | 2 | 1 | 0 | 0 | 1 | 1 | 3 | 0 | 0 | 0 | 1 | 0 | 4 | 1 | 1 | 1 | 1 | 1 | |||
| 2 | 1 | 1 | 1 | 1 | 1 | 1 | 1 | 1 | 1 | 0 | 0 | 0 | 1 | 0 | 1 | 1 | 1 | 1 | 1 | 0 | |||||||
| 3 | 0 | 0 | 1 | 1 | 1 | 1 | 0 | 1 | 0 | 0 | 0 | 0 | 0 | 0 | 1 | 1 | 1 | 0 | 1 | 0 | |||||||
| 4 | 0 | 0 | 0 | 1 | 0 | 1 | 0 | 0 | 1 | 1 | 1 | 1 | 1 | 1 | 1 | 1 | 0 | 1 | 1 | 1 | |||||||
| 5 | 0 | 0 | 0 | 1 | 1 | 0 | 0 | 0 | 0 | 1 | 1 | 0 | 1 | 1 | 1 | 0 | 0 | 0 | 1 | 1 | |||||||
| 1 | 5 | 1 | 1 | 1 | 1 | 1 | 6 | 1 | 1 | 0 | 1 | 0 | 7 | 1 | 0 | 1 | 0 | 1 | 8 | 1 | 1 | 0 | 0 | 1 | |||
| 2 | 1 | 0 | 0 | 1 | 1 | 0 | 1 | 0 | 0 | 1 | 1 | 1 | 1 | 0 | 0 | 0 | 0 | 1 | 1 | 1 | |||||||
| 3 | 0 | 1 | 1 | 0 | 0 | 1 | 1 | 1 | 0 | 0 | 0 | 1 | 1 | 1 | 1 | 1 | 0 | 0 | 1 | 1 | |||||||
| 4 | 1 | 0 | 1 | 1 | 0 | 1 | 0 | 0 | 0 | 1 | 1 | 1 | 0 | 1 | 0 | 0 | 0 | 1 | 0 | 0 | |||||||
| 5 | 0 | 0 | 1 | 0 | 0 | 1 | 0 | 1 | 1 | 0 | 0 | 1 | 1 | 1 | 1 | 0 | 1 | 1 | 1 | 1 | |||||||
| 1 | 9 | 0 | 1 | 1 | 1 | 0 | 10 | 1 | 0 | 1 | 0 | 0 | 11 | 1 | 0 | 1 | 0 | 1 | 12 | 1 | 0 | 0 | 0 | 1 | |||
| 2 | 1 | 0 | 0 | 1 | 1 | 0 | 1 | 1 | 1 | 0 | 1 | 1 | 0 | 0 | 0 | 1 | 1 | 1 | 1 | 0 | |||||||
| 3 | 0 | 0 | 0 | 1 | 1 | 0 | 1 | 0 | 0 | 1 | 0 | 1 | 1 | 0 | 0 | 0 | 0 | 0 | 1 | 1 | |||||||
| 4 | 1 | 1 | 1 | 0 | 0 | 0 | 1 | 0 | 0 | 0 | 1 | 1 | 0 | 1 | 0 | 1 | 1 | 0 | 1 | 0 | |||||||
| 5 | 0 | 1 | 1 | 1 | 1 | 1 | 0 | 1 | 0 | 1 | 0 | 0 | 0 | 1 | 0 | 0 | 0 | 1 | 0 | 0 |
表7 不同情景下的各土地利用类型规模Tab. 7 Scale of various land use types under different scenarios (km2) |
| 情景 | 耕地 | 林地 | 草地与灌木 | 水体与湿地 | 建设用地 |
|---|---|---|---|---|---|
| 2020年规模 | 4544.68 | 18 496.67 | 3255.82 | 203.18 | 1167.60 |
| 2030年自然发展情景 | 4896.84 | 17 795.17 | 3323.84 | 203.37 | 1448.73 |
| 2030年耕地保护情景 | 5030.24 | 17 786.27 | 3321.03 | 203.37 | 1327.04 |
| 2030年生态优先情景 | 4778.49 | 18 100.45 | 3337.51 | 205.78 | 1245.73 |
| [1] |
鲁胜晗, 朱成立, 周建新, 等. 生态景观视角下土地整治的生态效益评价[J]. 水土保持研究, 2020, 27(5):311-317.
[
|
| [2] |
赵林峰, 刘小平, 刘鹏华, 等. 基于地理分区与FLUS模型的城市扩张模拟与预警[J]. 地球信息科学学报, 2020, 22(3):517-530.
[
|
| [3] |
王保盛, 廖江福, 祝薇, 等. 基于历史情景的FLUS模型邻域权重设置——以闽三角城市群2030年土地利用模拟为例[J]. 生态学报, 2019, 39(12):4284-4298.
[
|
| [4] |
|
| [5] |
王越, 宋戈, 吕冰. 基于多智能体粒子群算法的松嫩平原土地利用格局优化[J]. 资源科学, 2019, 41(4):729-739.
[
|
| [6] |
王昊煜, 高培超, 谢一茹, 等. 基于改进型NSGA-Ⅱ算法的西宁市土地利用多目标优化[J]. 地理与地理信息科学, 2020, 36(6):84-89.
[
|
| [7] |
谢花林, 温家明, 陈倩茹, 等. 地球信息科学技术在国土空间规划中的应用研究进展[J]. 地球信息科学学报, 2022, 24(2):202-219.
[
|
| [8] |
张宸铭, 高尚, 何贝, 等. 基于空间句法耦合SLEUTH模型的新老城区扩展模拟研究——以开封市为例[J]. 地理研究, 2021, 40(5):1372-1386.
[
|
| [9] |
|
| [10] |
|
| [11] |
王旭东, 姚尧, 任书良, 等. 耦合FLUS和Markov的快速发展城市土地利用空间格局模拟方法[J]. 地球信息科学学报, 2022, 24(1):100-113.
[
|
| [12] |
|
| [13] |
|
| [14] |
赵轩, 彭建东, 樊智宇, 等. “双评价”视角下基于FLUS模型的武汉大都市区土地利用模拟和城镇开发边界划定研究[J]. 地球信息科学学报, 2020, 22(11):2212-2226.
[
|
| [15] |
杨露, 颉耀文, 宗乐丽, 等. 基于多目标遗传算法和FLUS模型的西北农牧交错带土地利用优化配置[J]. 地球信息科学学报, 2020, 22(3):568-579.
[
|
| [16] |
王海军, 夏畅, 张安琪, 等. 利用生物地理学优化算法获取城市扩展元胞自动机模型参数[J]. 武汉大学学报(信息科学版), 2017, 42(9):1323-1329.
[
|
| [17] |
朱珏然, 夏畅, 王海军. 利用生物地理学优化算法挖掘城市扩展元胞自动机模型的转换规则[J]. 地理与地理信息科学, 2018, 34(1):6-11,39.
[
|
| [18] |
伍艳莲, 姜海燕, 庄嘉祥, 等. 精英策略个体优势遗传算法研究[J]. 计算机工程与应用, 2016, 52(7):143-149.
[
|
| [19] |
王吉权, 程志文, 张攀利, 等. 求解有约束优化问题的实数遗传算法改进研究[J]. 控制与决策, 2019, 34(5):937-946.
[
|
| [20] |
|
| [21] |
李琦, 李婧, 蒋增强, 等. 考虑个体差异的系统退化建模与半Markov过程维修决策[J]. 计算机集成制造系统, 2020, 26(2):331-339.
[
|
| [22] |
杨俊宴, 朱骁. 人工智能城市设计在街区尺度的逐级交互式设计模式探索[J]. 国际城市规划, 2021, 36(2):7-15.
[
|
| [23] |
|
| [24] |
|
| [25] |
|
| [26] |
胡小建, 李睿豪. 基于混合遗传算法的液压元件装配流水车间调度[J]. 合肥工业大学学报(自然科学版), 2022, 45(9):1271-1278.
[
|
| [27] |
|
| [28] |
|
| [29] |
朱慧, 舒帮荣, 蔡成瑞, 等. 顾及空间非平稳性驱动的城市增长边界划定[J]. 地理与地理信息科学, 2020, 36(5):46-55.
[
|
| [30] |
蒋万钰, 陈冠, 孟兴民, 等. 基于卷积神经网络模型的区域滑坡敏感性评价——以川藏铁路沿线为例[J]. 兰州大学学报(自然科学版), 2022, 58(2):203-211.
[
|
| [31] |
贾兆红, 张袁源, 王海涛, 等. 基于Res2Net和双线性注意力的番茄病害时期识别方法[J]. 农业机械学报, 2022, 53(7):259-266.
[
|
| [32] |
邓元杰, 姚顺波, 侯孟阳, 等. 退耕还林还草工程对生态系统碳储存服务的影响——以黄土高原丘陵沟壑区子长县为例[J]. 自然资源学报, 2020, 35(4):826-844.
[
|
| [33] |
张世伟, 魏璐瑶, 金星星, 等. 基于FLUS-UGB的县域土地利用模拟及城镇开发边界划定研究[J]. 地球信息科学学报, 2020, 22(9):1848-1859.
[
|
| [34] |
徐嘉源, 陈美招, 郑荣宝, 等. 基于珞珈一号的珠三角地区GDP空间化研究[J]. 生态与农村环境学报, 2021, 37(6):689-697.
[
|
| [35] |
桂林市人民政府. 桂林市土地利用总体规划(2006-2020年)[M]. 桂林: 桂林市人民政府, 2011.
[The People's Government of Guilin. Master planning of land use in Guilin (2006-2020)[M]. Guilin: The People's Government of Guilin, 2011.]
|
| [36] |
王韬, 张娜娜, 李欢欢, 等. 基于电子地图兴趣点数据的城市可持续发展水平分析——以绍兴市为例[J]. 生态学报, 2018, 38(16):5914-5925.
[
|
| [37] |
桂林经济社会统计年鉴编委会. 桂林经济社会统计年鉴[M]. 北京: 中国统计出版社,2016-2021.
[Guilin Economic and Social Statistical Yearbook Editorial Committee. Guilin economic and social statistical yearbook[M]. Beijing: China Statistics Press, 2016-2021.]
|
| [38] |
张毅, 张珉浩. 基于机器学习的能力评价与匹配研究[J]. 计算机工程与科学, 2019, 41(2):363-369.
[
|
| [39] |
林丽, 樊辉, 金缘. 山区县域土地利用/覆被变化多尺度多模型模拟对比——以云南省勐腊县为例[J]. 山地学报, 2020, 38(4):630-642.
[
|
| [40] |
曾依浦, 戴毅茹, 王坚. 基于改进NSGA-Ⅲ的面向碳目标的区域综合能源系统容量优化[J]. 制造业自动化, 2022, 44(5):134-139.
[
|
| [41] |
|
| [42] |
李伟, 张振亚, 赵璐, 等. 基于GA-MADS混合算法的既有铁路平面线形自动重构[J]. 铁道工程学报, 2021, 38(1):19-24,83.
[
|
| [43] |
叶剑锋, 徐轲, 熊峻峰, 等. 基于注意力机制和辅助任务的语义分割算法[J]. 计算机工程, 2021, 47(9):203-209,216.
[
|
| [44] |
冯泉霖, 李洪涛, 徐夕博, 等. 基于聚类深度网络模型的莱州湾近岸平原表层土壤有机质含量遥感估算[J]. 安全与环境学报, 2022, 22(4):2248-2258.
[
|
| [45] |
杨练兵, 郑宏伟, 罗格平, 等. 基于遗传算法优化BP神经网络的土壤盐渍化反演[J]. 地理与地理信息科学, 2021, 37(2):12-21,37.
[
|
| [46] |
朱劲松, 李欢, 王世芳. 基于卷积神经网络和迁移学习的钢桥病害识别[J]. 长安大学学报(自然科学版), 2021, 41(3):52-63.
[
|
| [47] |
|
| [48] |
|
| [49] |
张亦汉, 刘小平, 陈广亮, 等. 基于最大熵的CA模型及其城市扩张模拟[J]. 中国科学:地球科学, 2020, 50(3):339-352.
[
|
| [50] |
付小千, 杨永斌, 张骞. 基于机器学习的区域火灾分布特征分析方法[J]. 消防科学与技术, 2022, 41(5):651-654.
[
|
| [51] |
陈理庭, 蔡海生, 张婷, 等. 基于Markov-FLUS模型的饶河流域土地利用多情景模拟分析[J]. 生态学报, 2022, 42(10):3947-3958.
[
|
| [52] |
张晓瑶, 张潇, 李冬花, 等. 城市土地利用变化对生态系统服务价值影响的多情景模拟——以深圳市为例[J]. 生态学报, 2022, 42(6):2086-2097.
[
|
/
| 〈 |
|
〉 |