
Journal of Geo-information Science >
Spatio-temporal Evolution and Synergy of Ecological Civilization and Common Prosperity in the Yellow River Basin based on Bayesian Statistics
Received date: 2022-10-17
Revised date: 2023-01-17
Online published: 2023-04-19
Supported by
National Social Science Foundation of China(22BTJ029)
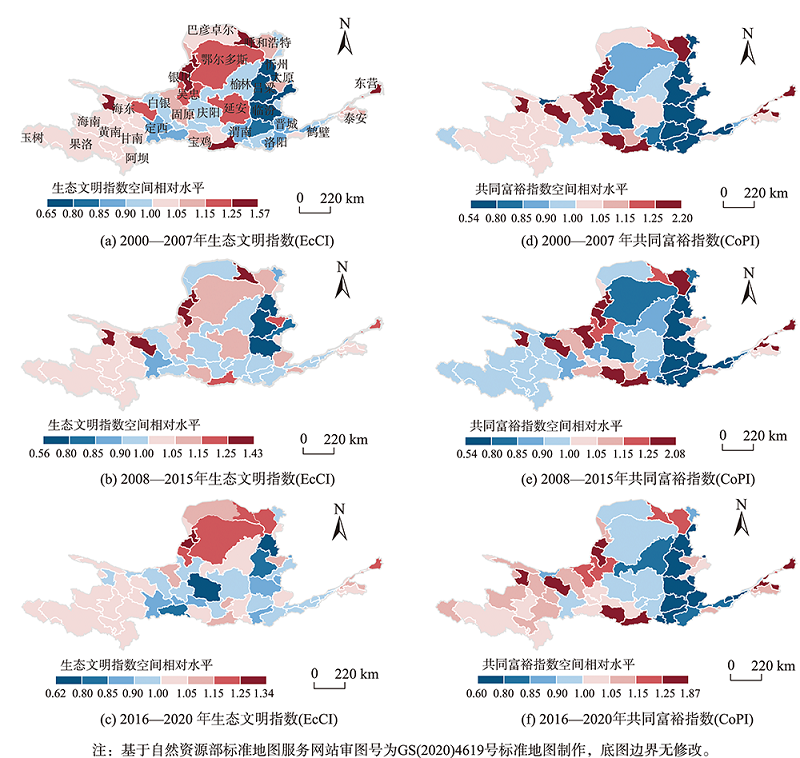
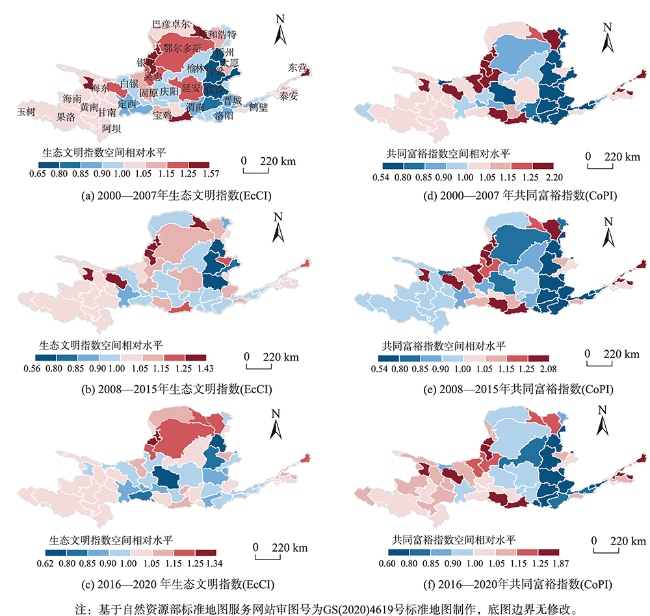
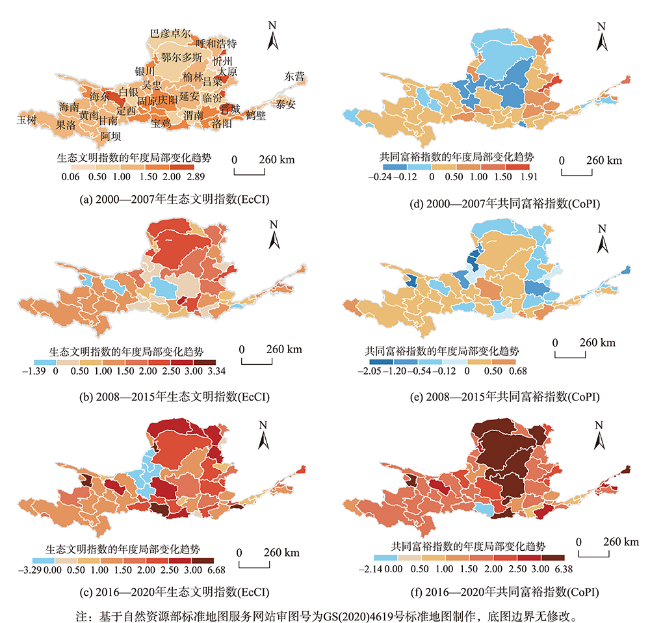
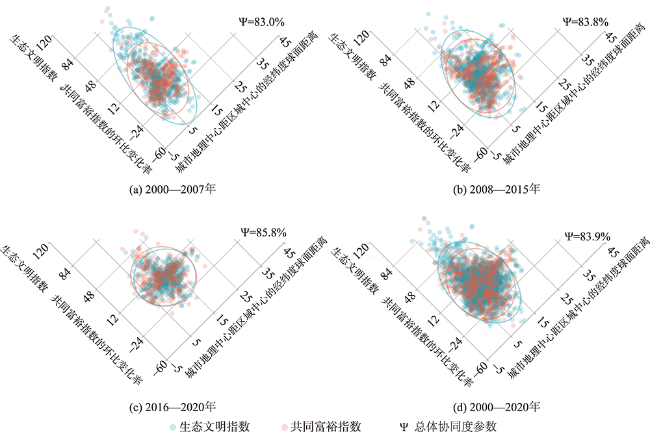
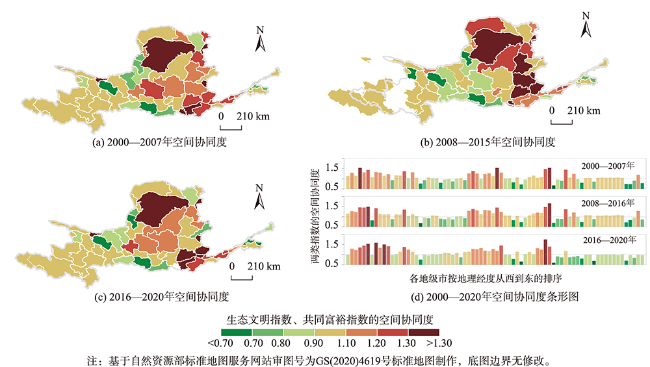
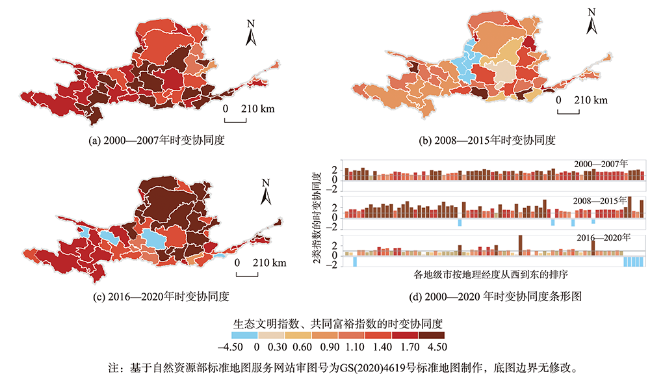
In view of the fact that the current comprehensive evaluation of spatiotemporal data fails to fully consider the spatiotemporal interaction information, this paper proposed a spatiotemporal dynamic entropy method, which can simultaneously consider the information entropy of the three dimensions of space, time, and spatiotemporal interaction. This method was employed to synthetically measure the Ecological Civilization Index (EcCI) and Common Prosperity Index (CoPI) at the prefecture-level scale in the Yellow River Basin in China from 2000 to 2020. Subsequently, the Bayesian Adaptive Multi-stage Spatio-temporal Evolution Model (BAMSTEM) was applied to finely study the spatiotemporal evolution of the EcCI and CoPI in the Yellow River Basin. The overall spatial pattern and the nonlinear local trends of the EcCI and CoPI in the Yellow River Basin were effectively explored and identified by the BAMSTEM. In order to quantitatively measure the spatiotemporal synergy state of the EcCI and CoPI in the Yellow River Basin, a Bayesian spatiotemporal synergy model was proposed in this paper. This model can effectively quantify the spatiotemporal synergy in four types of change combination scenarios: both increasing, the former increasing vs. the latter decreasing, the former decreasing vs. the latter increasing, and both decreasing. This study found that the process of the spatiotemporal evolution of the EcCI and CoPI in the Yellow River Basin can be divided into three periods: 2000-2007, 2007-2015 and 2015-2020. The overall spatial pattern of the EcCI transformed significantly in the later period, while the CoPI remained basically stable in the three periods. It indicates that the difficulty of the regional coordination of the CoPI is higher than that of the EcCI. In the early and mid-term, the EcCI and CoPI in a few regions showed a downward trend, but in the later stage, the EcCI and CoPI in most regions showed an increasing trend. Compared to EcCI, the increasing trend of the CoPI showed the characteristics of regional polarization in the later stage. In terms of the space-time synergy, the spatial synergy state of the EcCI and CoPI in the Yellow River Basin remained basically stable in the three stages. In terms of spatial and temporal coordination, the spatial coordination state of EcCI and CoPI remained stable in the three stages. The spatial pattern of the EcCI and CoPI reached synergy in the western and eastern regions in the Yellow River Basin, while the relative level of the EcCI in the central regions in the Yellow River Basin was higher than that of the CoPI. In particular, in the late stage (2016-2020), the growth trend of the EcCI and CoPI in 68 (92%) prefectural-level cities in the Yellow River Basin tended to be consistent, but the regional differences were significant. Therefore, the regional heterogeneity should be fully considered and the coordination among regional cities should be strengthened when the targeted policy system for promoting ecological progress and achieving common prosperity is made.
LI Junming , ZHOU Jiahui , LI Jie , GAO Jiayuan . Spatio-temporal Evolution and Synergy of Ecological Civilization and Common Prosperity in the Yellow River Basin based on Bayesian Statistics[J]. Journal of Geo-information Science, 2023 , 25(4) : 766 -782 . DOI: 10.12082/dqxxkx.2023.220798
表1 生态文明指数指标体系构成Tab. 1 Composition of ecological civilization index system |
| 一级指标 | 基础指标 | 属性 |
|---|---|---|
| 绿色发展 | 工业二氧化硫排放量占GDP比重 | - |
| 工业烟粉尘排放量占GDP比重 | - | |
| 工业氮氧化物排放量占GDP比重 | - | |
| 绿色实用新型占地区实用新型比重 | + | |
| 绿色发明占地区获得专利总数比重 | + | |
| 第三产业占GDP比重 | - | |
| 三废综合利用产值占GDP比重 | + | |
| 城市环境基础设施投资额/公共预算支出 | + | |
| 污染源治理投资/公共预算支出 | + | |
| 人均R&D内部经费支出 | + | |
| 每万人拥有公共汽车数 | + | |
| 人均农药使用量 | - | |
| 人均农用化肥施用折纯量 | - | |
| 环境保护 | 可吸入细颗粒物年平均浓度 | - |
| 每平方公里二氧化硫排放量 | - | |
| 人均工业烟粉尘排放量 | - | |
| 人均工业氮氧化物排放量 | - | |
| 工业废水排放达标率 | + | |
| 污水处理厂集中处理率 | + | |
| 一般工业固体废物综合利用率 | + | |
| 生活垃圾无害化处理率 | + | |
| 生态资源 | 森林覆盖率 | + |
| 人均水资源量 | + | |
| 人均人工造林面积 | + | |
| 人均年末耕地资源 | + | |
| 人均水土流失治理面积 | + | |
| 自然保护区占辖区面积比重 | + | |
| 人口密度 | - | |
| 人均绿地面积 | + | |
| 人均建成区面积 | + | |
| 生态意识 | 地方政府工作报告环境热词词频 | + |
| 居民生态认知水平 | + | |
| 每万人科研综合技术服务业从业人数 | + |
注:“+”表示正向指标,“-”表示负向指标。 |
表2 共同富裕指数指标体系构成Tab. 2 Composition of common prosperity index system |
| 一级指标 | 基础指标 | 属性 |
|---|---|---|
| 经济高质量 发展 | 区域人均GDP | + |
| 每万人在岗职工平均人数 | + | |
| 居民人均可支配收入 | + | |
| R&D内部经费支出占GDP比重 | + | |
| 第二产业占地区生产总值比重 | - | |
| 恩格尔系数 | - | |
| 技术市场成交额占GDP比重 | + | |
| 居民人均消费支出 | + | |
| 收入分配 | 居民人均可支配收入/人均GDP | + |
| 在岗职工工资总额占GDP比重 | - | |
| 基尼系数 | - | |
| 经济发展不平衡度 | + | |
| 社会捐赠款占GDP比重 | + | |
| 区域发展 | 城镇化率 | + |
| 区域经济发展均衡度 | + | |
| 城镇与农村居民可支配收入之比 | - | |
| 人均出租汽车数 | + | |
| 人均公共交通客运量 | + | |
| 公共服务 | 地方财政一般预算支出中公共服务比重 | + |
| 卫生用品类居民消费价格指数 | - | |
| 每万人普通高等学校在校学生数 | + | |
| 城镇登记失业率 | - | |
| 每万人中等职业教育学校在校学生数 | + | |
| 平均预期寿命 | + | |
| 每万人执业或助理医师数 | + | |
| 城市居民最低生活保障标准 | + | |
| 农村居民最低生活保障标准 | + | |
| 地方财政一般预算支出中住房保障比重 | + | |
| 精神文明 | 文化娱乐类居民消费价格指数 | + |
| 每万人博物馆数 | + | |
| 每万人体育场馆数 | + | |
| 每百人公共图书馆藏书量 | + | |
| 生态环境 | 单位GDP能耗(等价值) | - |
| 单位工业增加值能耗 | - | |
| 社会和谐 | 人口火灾发生率 | - |
| 交通事故直接财产损失占GDP比重 | - | |
| 社区服务机构覆盖率 | + | |
| 地方财政一般预算收入中罚没收入比重 | - |
注:“+”表示正向指标,“-”表示负向指标。 |
表3 黄河流域生态文明和共同富裕2个方面的热点、温点和冷点城市由前期(2000—2007年)到后期(2016—2020年)的马尔可夫转移矩阵Tab. 3 Markov transition matrix of hotspot, warmspot and coldspot cities in ecological civilization index and common prosperity index in the Yellow River Basin from the early period (2000-2007) to the late period (2016-2020) (个) |
| 指标 | 2016—2020年 | 合计 | ||||
|---|---|---|---|---|---|---|
| 热点区域 | 温点区域 | 冷点区域 | ||||
| 生态文明指数(EcCI) | 2000—2007年 | 热点区域 | 12 | 8 | 0 | 20 |
| 温点区域 | 1 | 21 | 3 | 25 | ||
| 冷点区域 | 3 | 8 | 18 | 29 | ||
| 合计 | 16 | 37 | 21 | 74 | ||
| 共同富裕指数(CoPI) | 2000—2007年 | 热点区域 | 18 | 3 | 1 | 22 |
| 温点区域 | 13 | 3 | 1 | 17 | ||
| 冷点区域 | 0 | 5 | 30 | 35 | ||
| 合计 | 31 | 11 | 32 | 74 | ||
图5 黄河流域生态文明和共同富裕在3期的时变协同状态以及按经度排列的74个地级市在3期的时变协同度条形图谱Fig. 5 Temporal collaborative stage of the ecological civilization and common prosperity across the Yellow River basin in three stages, and the bar charts of the temporal synergia of the ranged 74 prefecture regions based on longitude |
| [1] |
|
| [2] |
|
| [3] |
郭兆晖. 论中国特色的生态文明理论[J]. 福建论坛(人文社会科学版), 2015(1):169-173.
[
|
| [4] |
成金华, 王然, 袁一仁. 中国省域生态文明差异化评价指标体系研究[J]. 环境经济研究, 2016, 1(2):60-75.
[
|
| [5] |
冒袁媛, 杨加猛. 长三角地区国家生态县生态文明建设绩效评价[J]. 生态经济, 2018, 34(6):210-216.
[
|
| [6] |
王振波, 梁龙武, 褚昕阳, 等. 青藏高原旅游经济与生态环境协调效应测度及交互胁迫关系验证[J]. 地球信息科学学报, 2019, 21(9):1352-1366.
[
|
| [7] |
邹昕宸, 牟凤云, 王俊秀, 等. 基于多源数据的长江经济带内河港口区位优势度评估[J]. 地球信息科学学报, 2022, 24(9):1717-1729.
[
|
| [8] |
李金昌, 余卫. 共同富裕统计监测评价探讨[J]. 统计研究, 2022, 39(2):3-17.
[
|
| [9] |
蒋永穆, 豆小磊. 扎实推动共同富裕指标体系构建:理论逻辑与初步设计[J]. 东南学术, 2022(1):36-44,246.
[
|
| [10] |
沈满洪. 生态文明视角下的共同富裕观[J]. 治理研究, 2021, 37(5):5-13,2.
[
|
| [11] |
程慧娴, 俞洋, 牛惠, 等. 黄河流域生态环境与绿色发展测度及耦合协调性分析[J]. 林业经济, 2021, 43(6):5-20,96.
[
|
| [12] |
毛锦凰, 王林涛. 节能降碳约束、研发投入与工业绿色全要素生产率增长——“双碳”背景下对黄河流域城市群的实证分析[J]. 西北师大学报:社会科学版, 2022, 59(2):75-85.
[
|
| [13] |
丛晓男. 耦合度模型的形式、性质及在地理学中的若干误用[J]. 经济地理, 2019, 39(4):18-25.
[
|
| [14] |
成金华, 李悦, 陈军. 中国生态文明发展水平的空间差异与趋同性[J]. 中国人口·资源与环境, 2015, 25(5):1-9.
[
|
| [15] |
成金华, 陈军, 李悦. 中国生态文明发展水平测度与分析[J]. 数量经济技术经济研究, 2013, 30(7):36-50.
[
|
| [16] |
袁一仁, 罗菁菁, 李悦. 长江经济带生态文明发展水平测度及空间演化特征分析[J]. 统计与决策, 2016(20):98-101.
[
|
| [17] |
李悦, 成金华, 席皛. 基于资源问题区域差异的生态文明指标体系研究[J]. 中国国土资源经济, 2015, 28(3):29-32,65.
[
|
| [18] |
陈丽君, 郁建兴, 徐铱娜. 共同富裕指数模型的构建[J]. 治理研究, 2021, 37(4):5-16,2.
[
|
| [19] |
黄敦平, 朱小雨. 我国数字经济发展水平综合评价及时空演变[J]. 统计与决策, 2022, 38(16):103-107.
[
|
| [20] |
|
| [21] |
李俊明. 基于Bayesian层次时空模型的我国老龄化分析与预测[J]. 统计研究, 2016, 33(8):89-94.
[
|
| [22] |
|
| [23] |
张波, 邓鹏程. 资源型地区的收入差距:现状、机理及现实对策[J]. 经济研究导刊, 2020(9):63-64.
[
|
| [24] |
樊杰, 王亚飞, 王怡轩. 基于地理单元的区域高质量发展研究——兼论黄河流域同长江流域发展的条件差异及重点[J]. 经济地理, 2020, 40(1):1-11.
[
|
| [25] |
孙久文, 崔雅琪, 张皓. 黄河流域城市群生态保护与经济发展耦合的时空格局与机制分析[J]. 自然资源学报, 2022, 37(7):1673-1690.
[
|
/
| 〈 |
|
〉 |