
Journal of Geo-information Science >
Extraction of Sugarcane Plantation Distribution in Western Guangdong by Combining Remote Sensing and Statistic Data and Its Spatiotemporal Analysis
Received date: 2022-08-12
Revised date: 2022-10-16
Online published: 2023-04-27
Supported by
China Postdoctoral Science Foundation(2021M690769)
National Natural Science Foundation of China(42201413)
National Natural Science Foundation of China(42071316)
National Natural Science Foundation of China - Guangdong Joint Fund(U1901219)
Key Laboratory of Natural Resources Monitoring in Tropical and Subtropical Area of South China, Ministry of Natural Resources(2022NRM0004)
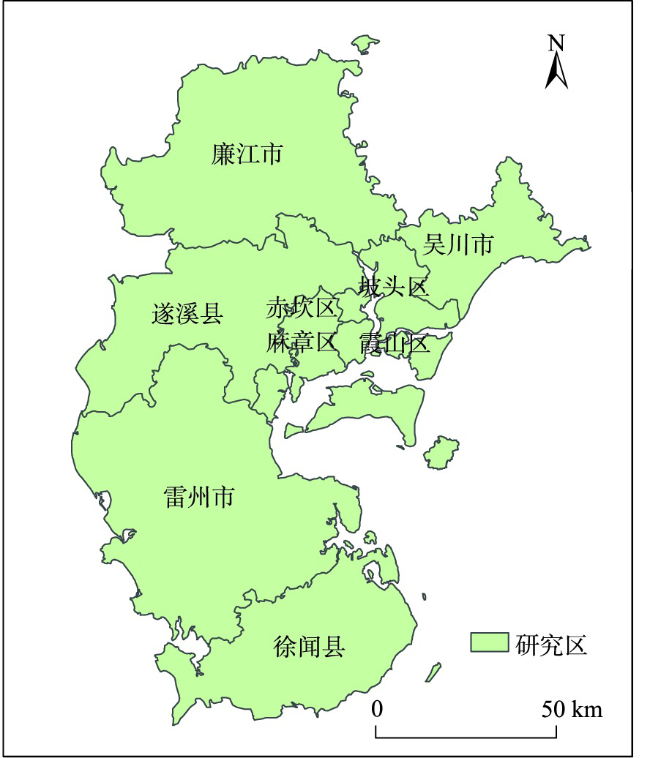
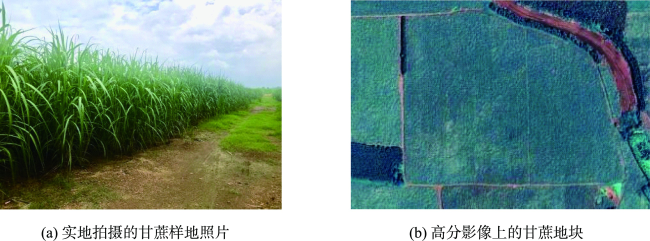
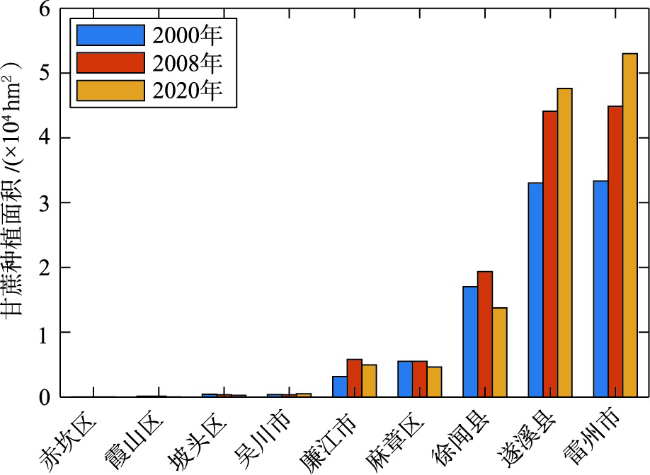
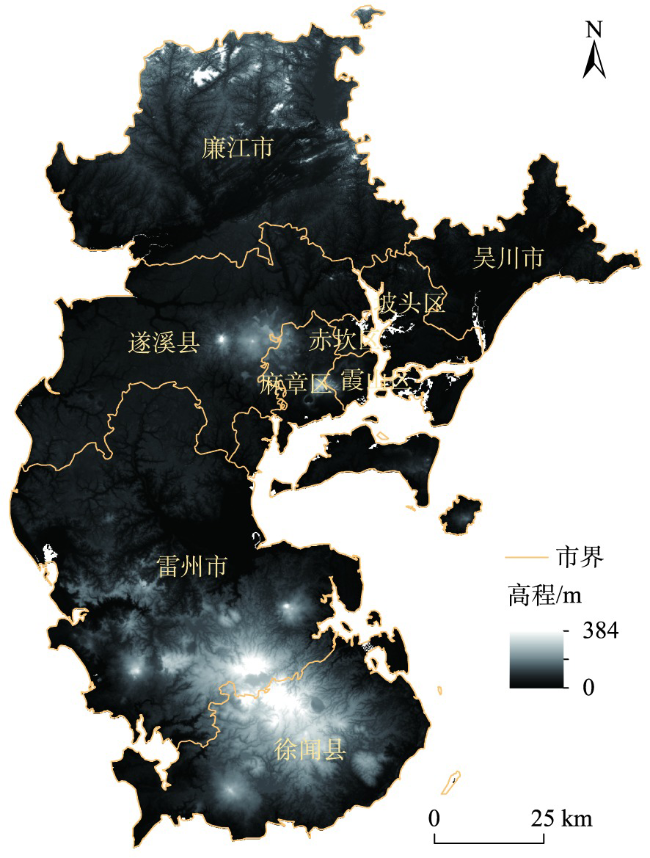
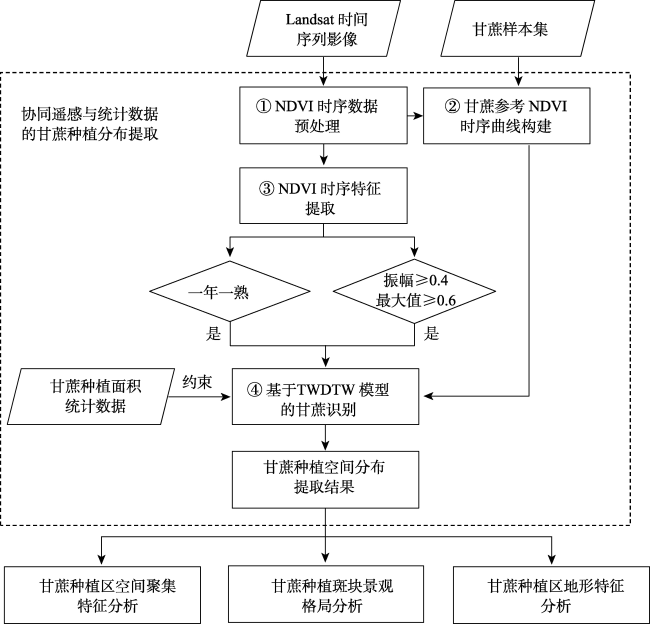
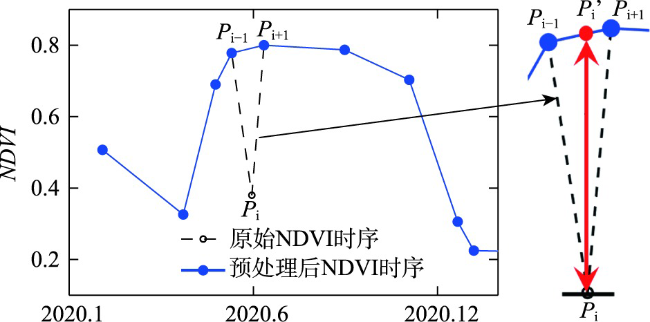
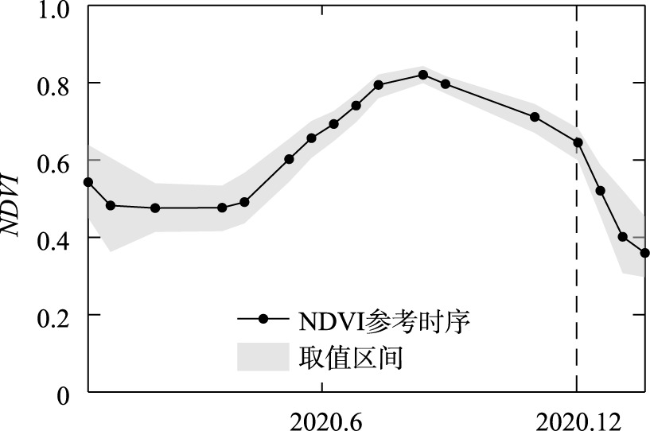
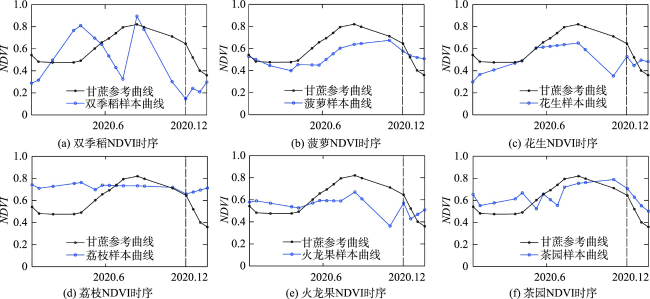
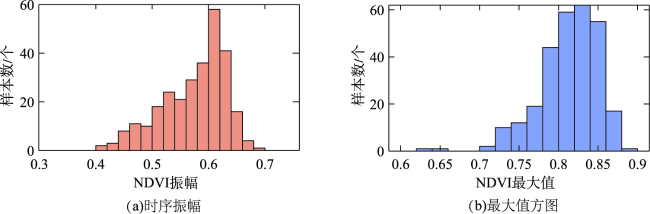
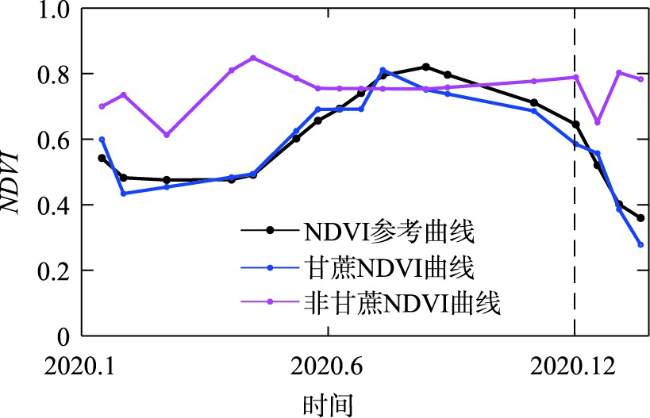
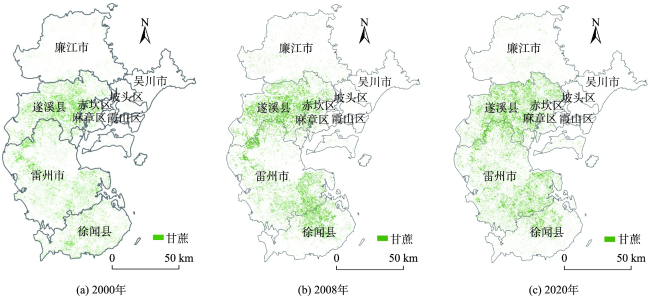
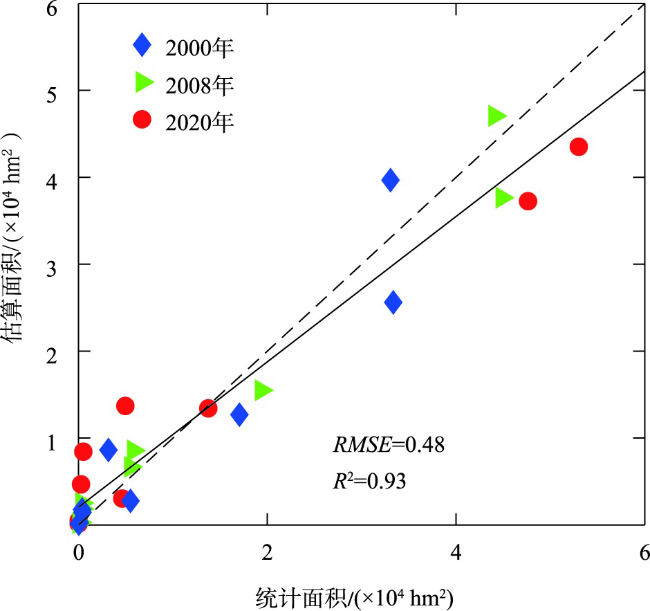
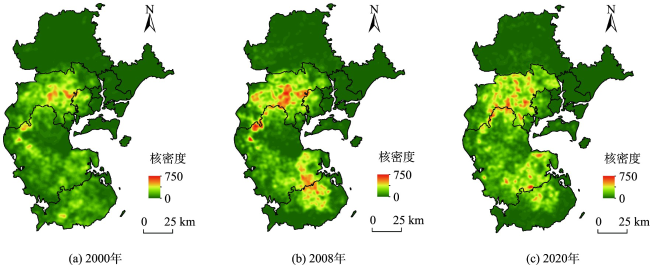
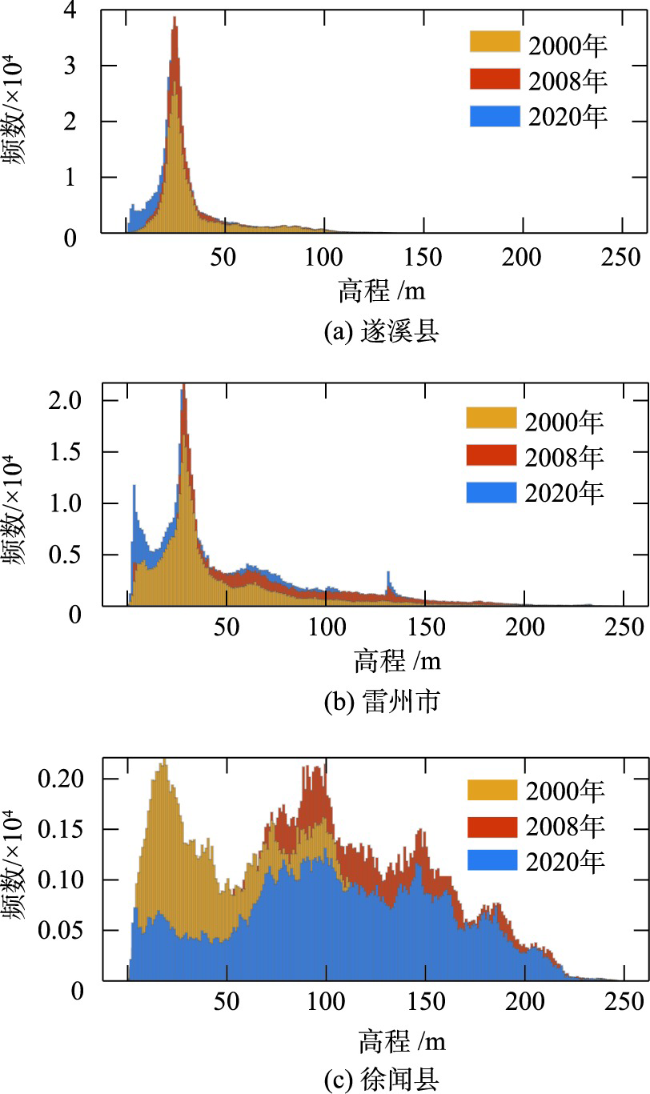
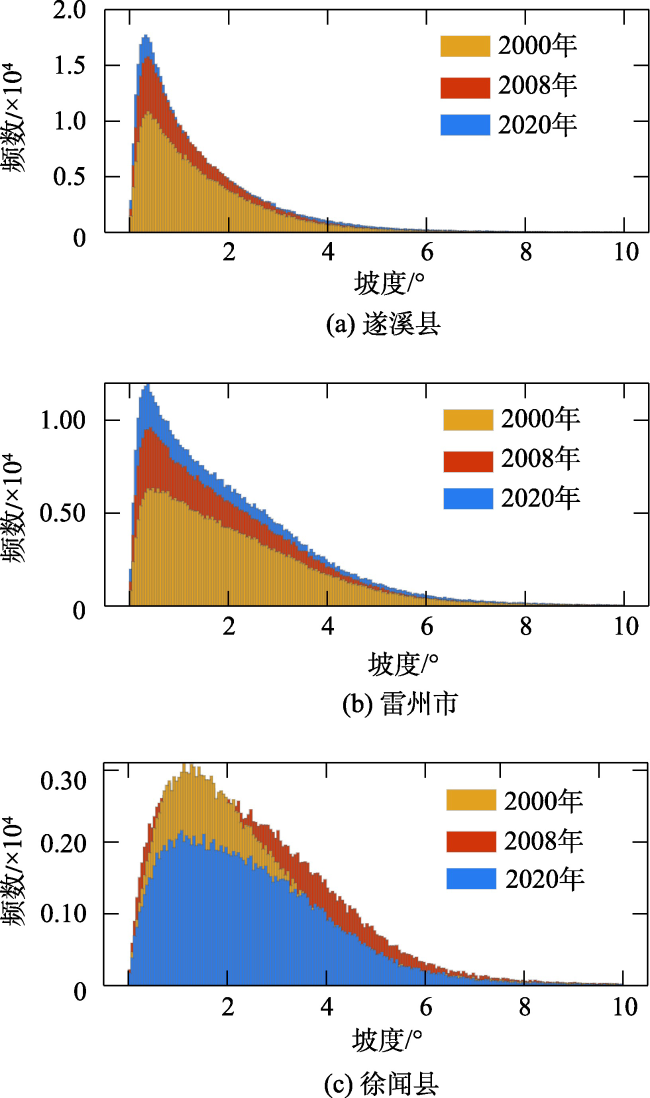
Western Guangdong is one of the three major sugarcane producing areas in China. Sugarcane in western Guangdong is mainly distributed in Zhanjiang, with more than 2 million sugarcane farmers. In 2020, the sugarcane planting area in Zhanjiang reached 130 030 hectares. Mapping sugarcane plantation and analyzing its spatiotemporal characteristics in western Guangdong are of great values for making polices in sugarcane industry, optimizing the distribution of sugarcane plantation, and promoting production efficiency. Remote sensing technology provides an efficient way to acquire land cover information. In this study, the sugarcane plantation distribution information in 2000, 2008, and 2020 was acquired based on Landsat remote sensing data and statistics data in sugarcane planting areas. Following steps were implemented: preprocessing of Normalized Difference Vegetation Index (NDVI) time series, construction of reference NDVI of sugarcane, extraction of the amplitude and the maximum of NDVI time series, and identification of sugarcane using the Time Weighted Dynamic Time Warping (TWDTW) method. The TWDTW method calculated the distance between NDVI time series of unknown pixels and sugarcane pixels, and a distance threshold was set via the statistics data to acquire the sugarcane plantation distribution. Based on the extracted distribution of sugarcane plantation, the kernel density of sugarcane distribution was calculated to analyze the spatial clustering characteristics of sugarcane planting areas. Landscape pattern indexes such as the percentage of landscape, average patch area, patch density, and aggregation index were calculated to analyze the spatial distribution characteristics of sugarcane planting patches. The topographic characteristics of sugarcane planting areas were also analyzed based on DEM data. The results showed that: ① the TWDTW model could realize sugarcane identification with high accuracy by combing remote sensing time series data and statistics data. In 2000, 2008 and 2020, the average accuracy of sugarcane mapping reached 87.62%; ② Sugarcane was mainly distributed in Suixi, Leizhou, and Xuwen in western Guangdong. The distribution of sugarcane planting in Suixi and Leizhou presented a pattern of high-density aggregation in multi centers; ③ From 2000 to 2020, the average area of sugarcane patches increased, the patch density decreased, and the aggregation index increased in Suixi and Leizhou, which indicated that the layout of sugarcane plantation had been significantly adjusted in these areas, and sugarcane production showed a trend of intensive production; ④ In Suixi and Leizhou, most of sugarcane was planted in flat areas, showing a great potential to develop mechanized production.

YANG Yingpin , WU Zhifeng , HUANG Qiting , LUO Jiancheng , WU Tianjun , DONG Wen , HU Xiaodong , XIAO Wenju . Extraction of Sugarcane Plantation Distribution in Western Guangdong by Combining Remote Sensing and Statistic Data and Its Spatiotemporal Analysis[J]. Journal of Geo-information Science, 2023 , 25(5) : 1012 -1026 . DOI: 10.12082/dqxxkx.2023.220585
表1 Landsat影像数据Tab. 1 Landsat images |
| 序号 | 2000年Landsat5成像时间 | 2008年Landsat5成像时间 | 2020年Landsat8成像时间 |
|---|---|---|---|
| 1 | 2000-01-24 | 2008-02-15 | 2020-01-15 |
| 2 | 2000-03-28 | 2008-03-02 | 2020-01-31 |
| 3 | 2000-04-29 | 2008-04-19 | 2020-03-03 |
| 4 | 2000-05-15 | 2008-05-05 | 2020-04-20 |
| 5 | 2000-05-31 | 2008-06-22 | 2020-05-06 |
| 6 | 2000-07-02 | 2008-07-24 | 2020-06-07 |
| 7 | 2000-08-19 | 2008-08-25 | 2020-06-23 |
| 8 | 2000-09-04 | 2008-09-10 | 2020-07-09 |
| 9 | 2000-10-06 | 2008-09-26 | 2020-07-25 |
| 10 | 2000-11-07 | 2008-10-28 | 2020-08-10 |
| 11 | 2000-11-23 | 2008-11-13 | 2020-09-11 |
| 12 | 2000-12-09 | 2008-11-29 | 2020-09-27 |
| 13 | 2000-12-25 | 2008-12-15 | 2020-11-30 |
| 14 | 2001-02-11 | 2009-01-16 | 2021-01-01 |
| 15 | 2009-02-17 | 2021-01-17 | |
| 16 | 2021-02-02 | ||
| 17 | 2021-02-18 |
表2 甘蔗识别精度混淆矩阵Tab. 2 Confusion matrix of the accuracy of sugarcane identification |
| 年份 | 区县 | 真实类型 | 识别类型 | 合计 | 制图精度/% | 用户精度/% | 总体精度/% | |
|---|---|---|---|---|---|---|---|---|
| 甘蔗 | 非甘蔗 | |||||||
| 2000年 | 遂溪县 | 甘蔗 | 190 | 29 | 219 | 86.75 | 90.48 | 92.41 |
| 非甘蔗 | 20 | 432 | 454 | 95.15 | 93.71 | |||
| 雷州市 | 甘蔗 | 254 | 36 | 290 | 87.59 | 83.28 | 91.08 | |
| 非甘蔗 | 51 | 634 | 685 | 92.55 | 94.63 | |||
| 徐闻县 | 甘蔗 | 140 | 22 | 162 | 86.42 | 83.83 | 91.01 | |
| 非甘蔗 | 27 | 356 | 383 | 92.95 | 94.18 | |||
| 2008年 | 遂溪县 | 甘蔗 | 191 | 29 | 220 | 86.82 | 83.77 | 90.69 |
| 非甘蔗 | 37 | 452 | 489 | 92.43 | 93.97 | |||
| 雷州市 | 甘蔗 | 287 | 38 | 325 | 88.31 | 84.16 | 90.85 | |
| 非甘蔗 | 54 | 626 | 680 | 92.06 | 94.28 | |||
| 徐闻县 | 甘蔗 | 140 | 23 | 163 | 85.89 | 85.37 | 90.29 | |
| 非甘蔗 | 24 | 297 | 321 | 92.52 | 92.81 | |||
| 2020年 | 遂溪县 | 甘蔗 | 202 | 29 | 231 | 87.45 | 83.13 | 90.50 |
| 非甘蔗 | 41 | 465 | 506 | 91.90 | 94.13 | |||
| 雷州市 | 甘蔗 | 303 | 31 | 334 | 90.72 | 82.34 | 91.04 | |
| 非甘蔗 | 65 | 673 | 738 | 91.19 | 95.60 | |||
| 徐闻县 | 甘蔗 | 117 | 15 | 132 | 88.64 | 81.25 | 90.25 | |
| 非甘蔗 | 27 | 281 | 309 | 90.94 | 94.93 | |||
表3 湛江2000、2008、2020年甘蔗景观格局指数计算结果Tab. 3 Calculation results of sugarcane landscape pattern index in Zhanjiang in 2000, 2008 and 2020 |
| 区县 | 年份 | 景观格局指数 | |||
|---|---|---|---|---|---|
| 景观比例/% | 平均斑块面积/hm2 | 斑块密度/(个/km2) | 聚集度指数 | ||
| 遂溪县 | 2000 | 16.33 | 1.14 | 13.36 | 61.45 |
| 2008 | 21.78 | 1.69 | 12.03 | 67.13 | |
| 2020 | 23.53 | 2.31 | 9.51 | 70.99 | |
| 雷州市 | 2000 | 9.47 | 0.56 | 15.79 | 48.85 |
| 2008 | 12.74 | 0.82 | 14.60 | 62.15 | |
| 2020 | 15.05 | 1.08 | 13.04 | 64.98 | |
| 徐闻县 | 2000 | 9.44 | 0.51 | 17.47 | 47.19 |
| 2008 | 10.71 | 1.00 | 10.09 | 64.09 | |
| 2020 | 7.61 | 0.67 | 10.68 | 59.35 | |
| 麻章区 | 2000 | 7.49 | 0.78 | 9.00 | 57.31 |
| 2008 | 7.50 | 0.77 | 9.11 | 58.17 | |
| 2020 | 6.31 | 0.47 | 12.65 | 47.49 | |
| 廉江市 | 2000 | 1.13 | 0.20 | 5.23 | 26.76 |
| 2008 | 2.07 | 0.35 | 5.47 | 42.15 | |
| 2020 | 1.77 | 0.24 | 6.90 | 31.26 | |
| 吴川市 | 2000 | 0.43 | 0.17 | 2.36 | 21.64 |
| 2008 | 0.39 | 0.18 | 2.09 | 23.00 | |
| 2020 | 0.58 | 0.15 | 3.64 | 17.06 | |
| 霞山区 | 2000 | 1.32 | 0.27 | 4.54 | 33.18 |
| 2008 | 1.14 | 0.30 | 3.61 | 35.50 | |
| 2020 | 0.22 | 0.13 | 1.60 | 12.93 | |
| 坡头区 | 2000 | 0.82 | 0.21 | 3.67 | 27.83 |
| 2008 | 0.71 | 0.20 | 3.36 | 25.23 | |
| 2020 | 0.52 | 0.17 | 2.86 | 22.14 | |
| 赤坎区 | 2000 | 0.42 | 0.16 | 2.37 | 21.07 |
| 2008 | 0.35 | 0.18 | 1.84 | 22.49 | |
| 2020 | 0.22 | 0.14 | 1.57 | 15.16 | |
| [1] |
谭宗琨, 欧钊荣, 何燕. 全球蔗糖主产国甘蔗产量与气象条件关系的初步研究[J]. 中国农业气象, 2007, 28(1):71-75.
[
|
| [2] |
国家统计局农村社会经济调查司. 中国农村统计年鉴[M]. 北京: 中国统计出版社, 2005.
[Department of Rural Surveys, National Bureau of Statistics. China rural statistical yearbook[M]. Beijing: China Statistics Press, 2005. ]
|
| [3] |
马改艳, 徐学荣. 对当前我国甘蔗产业发展形势的分析与思考[J]. 云南农业大学学报(社会科学版), 2013, 7(6):29-35.
[
|
| [4] |
严艳荣. 粤西地区甘蔗产业对外贸易的发展现状及对策[J]. 桉树科技, 2019, 36(2):57-62.
[
|
| [5] |
|
| [6] |
|
| [7] |
|
| [8] |
赵英时. 遥感应用分析原理与方法[M]. 北京: 科学出版社, 2003.
[
|
| [9] |
宋茜, 周清波, 吴文斌, 等. 农作物遥感识别中的多源数据融合研究进展[J]. 中国农业科学, 2015, 48(6):1122-1135.
[
|
| [10] |
胡琼, 吴文斌, 宋茜, 等. 农作物种植结构遥感提取研究进展[J]. 中国农业科学, 2015, 48(10):1900-1914.
[
|
| [11] |
唐华俊, 吴文斌, 杨鹏, 等. 农作物空间格局遥感监测研究进展[J]. 中国农业科学, 2010, 43(14):2879-2888.
[
|
| [12] |
|
| [13] |
|
| [14] |
|
| [15] |
|
| [16] |
|
| [17] |
杨颖频, 吴志峰, 骆剑承, 等. 时空协同的地块尺度作物分布遥感提取[J]. 农业工程学报, 2021, 37(7):166-174.
[
|
| [18] |
|
| [19] |
|
| [20] |
|
| [21] |
|
| [22] |
|
| [23] |
|
| [24] |
|
| [25] |
|
| [26] |
|
| [27] |
|
| [28] |
黄青, 唐华俊, 吴文斌, 等. 农作物分布格局动态变化的遥感监测——以东北三省为例[J]. 中国农业科学, 2013, 46(13):2668-2676.
[
|
| [29] |
《广东农村统计年鉴》编辑委员会. 广东农村统计年鉴[M]. 北京: 中国统计出版社, 2021.
[ Editorial committee of Guangdong rural statistical yearbook. Guangdong rural statistical yearbook[M]. Beijing: China Statistics Press, 2021. ]
|
| [30] |
|
| [31] |
王远飞, 何洪林. 空间数据分析方法[M]. 北京: 科学出版社, 2007.
[
|
| [32] |
全国农业区划委员会. 土地利用现状调查技术规程[S]. 1984:9.
[ National Agricultural Zoning Committee. Technical Regulations for Land Use Status Survey[S]. 1984:9. ]
|
/
| 〈 |
|
〉 |