
Journal of Geo-information Science >
Landslide Susceptibility Prediction based on Non-Landslide Samples Selection and Heterogeneous Ensemble Machine Learning
Received date: 2022-11-30
Revised date: 2023-02-28
Online published: 2023-07-14
Supported by
National Natural Science Foundation of China(41907253)
National Natural Science Foundation of China(41702330)
Key Research and Development Program of Hubei Province(2021BCA219)
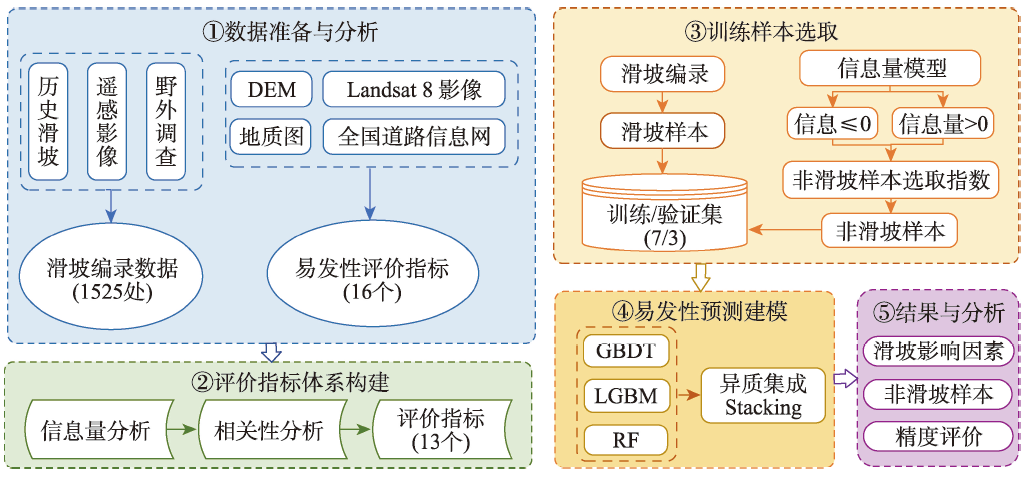
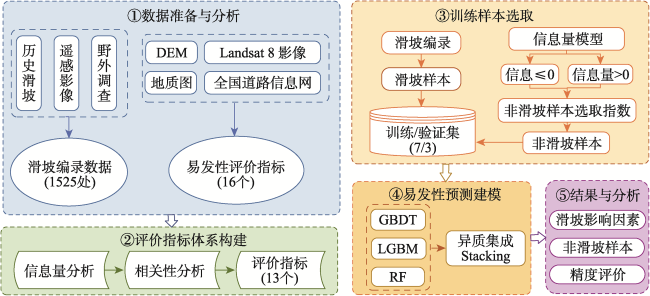
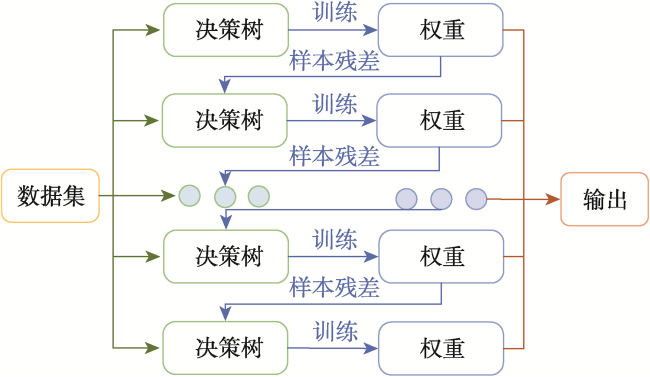
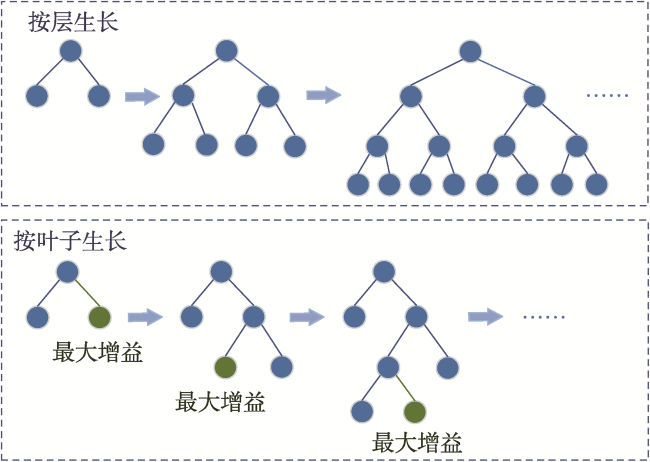
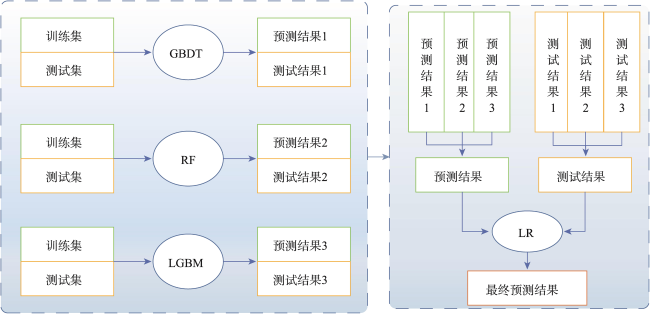
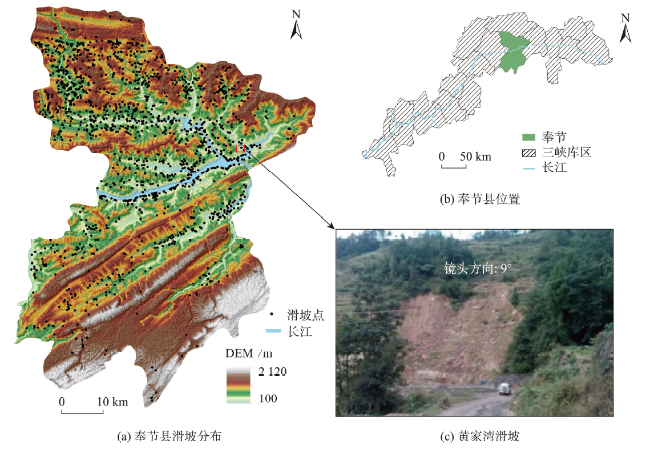
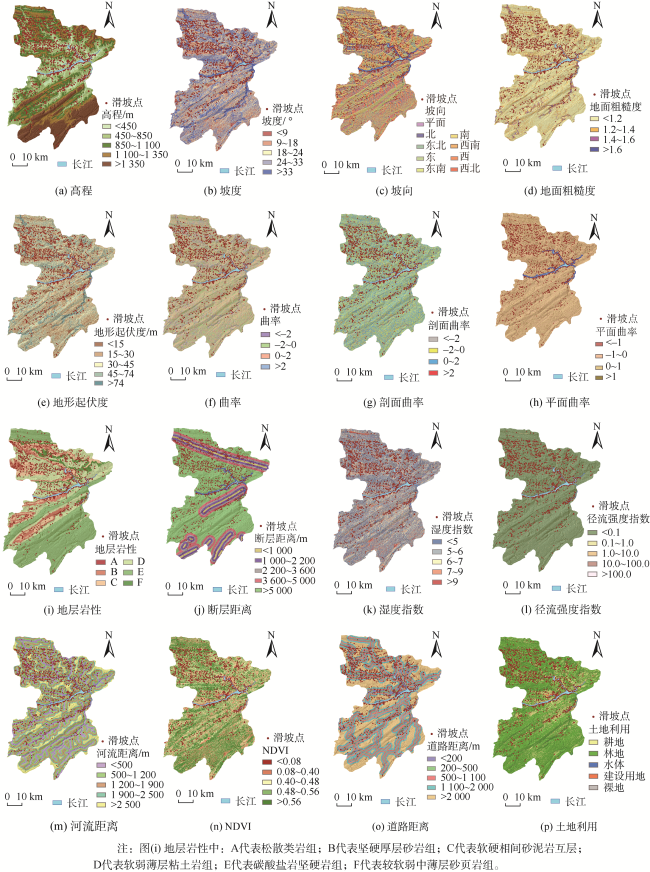
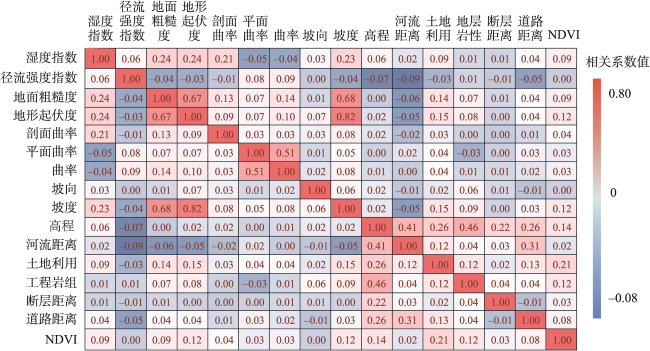
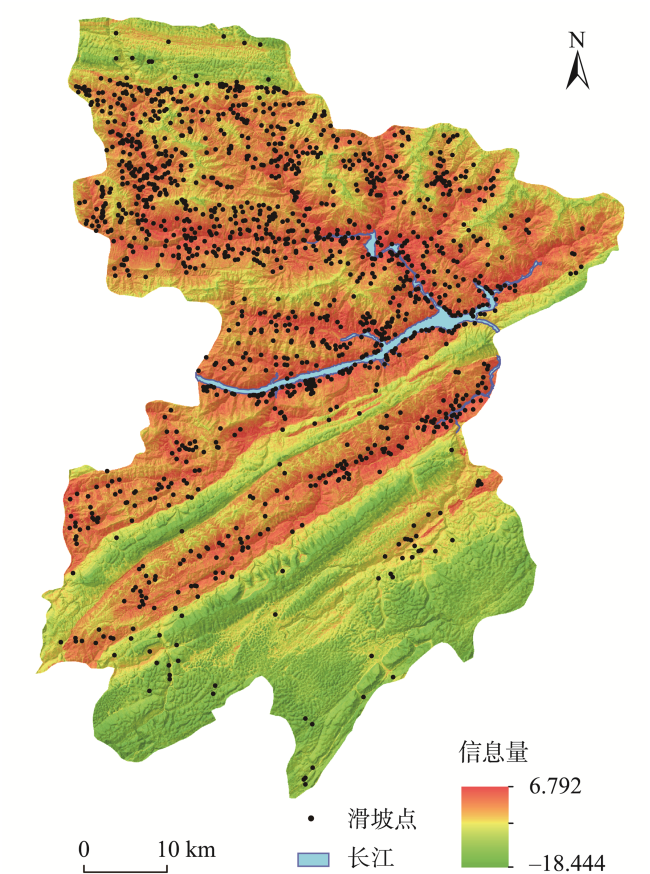
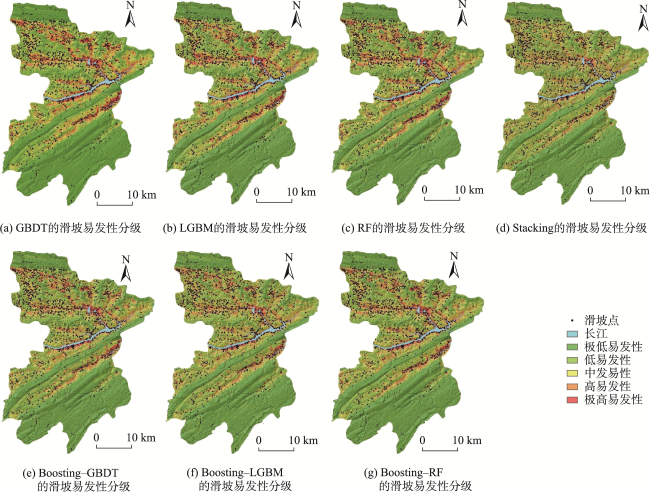
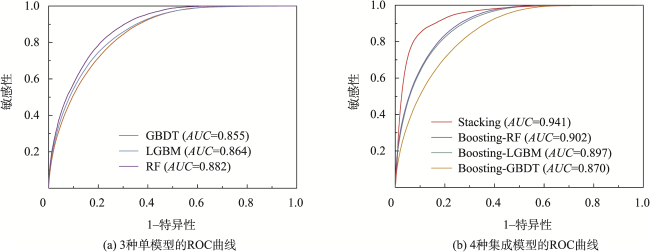
The single machine learning-based landslide susceptibility prediction model has different focuses of features and a weak classification ability, and also the accuracy of traditional random sampling of non-landslide is low. To solve these problems, this study optimized Non-Landslide Samples (NLS) based on the information value model and utilized Stacking heterogeneous ensemble models to evaluate the landslide susceptibility of Fengjie County in the Three Gorges Reservoir. Firstly, 16 evaluation indexes were extracted based on multiple sources of topographic, geologic, and remote sensing data, including elevation, slope, aspect, profile curvature, plan curvature, lithology, distance to fault, topographic wetness index, stream power index, distance to river, normalized difference vegetation index, distance to road, and land use, and the correlation analysis was carried out to exclude high correlation indicators and construct the landslide susceptibility evaluation criteria system. Then, the NLS index was proposed based on the information value model to divide the non-landslide samples into two categories: information values less than or equal to 0, and greater than 0. Finally, the logistic regression model was used to compare the non-landslide samples under different NLS conditions, and the NLS index was used to obtain optimized non-landslide samples, which forms the training set with the same number of landslide samples. Finally, Random Forest (RF), Light Gradient Boosting Machine (LGBM), Gradient Boosting Decision Tree (GBDT), and homogeneous (Boosting-RF, Boosting-LGBM, Boosting-GBDT) and heterogeneous (Stacking) ensemble methods based on these three models were compared for susceptibility evaluation. The results show that non-landslide sampling using NLS can produce non-landslide samples of high quality and generalization ability, which in turn improves the learning ability of the model and the accuracy of susceptibility evaluation. The Stacking heterogeneous ensemble model has the best accuracy of 0.941, which is better than the Boosting homogeneous ensemble models (an accuracy of 0.902, 0.897, 0.870, respectively) and other single models (an accuracy of 0.882, 0.864, 0.855, respectively). These results indicate that the Stacking heterogeneous ensemble algorithm is capable of extracting landslide and non-landslide features from various spatial angles, realizing the complementary advantages and disadvantages of the models, significantly improving the performance of machine learning, and obtaining better predictions, and thus is a reliable landslide susceptibility evaluation model. This study contributes to a better understanding of the landslide activity, improves the reliability of regional landslide hazard risk assessment, and provides support for carrying out reasonable land use planning, disaster prevention, and mitigation strategies.
ZHOU Chao , GAN Lulu , WANG Yue , WU Hongyang , YU Jin , CAO Ying , YIN Kunlong . Landslide Susceptibility Prediction based on Non-Landslide Samples Selection and Heterogeneous Ensemble Machine Learning[J]. Journal of Geo-information Science, 2023 , 25(8) : 1570 -1585 . DOI: 10.12082/dqxxkx.2023.220934
图6 滑坡易发性评价指标空间分布Fig. 6 Spatial distribution of landslide susceptibility evaluation indexes |
表1 数据类型与来源Tab. 1 Data types and sources |
| 数据类型 | 分辨率 | 年份 | 来源 |
|---|---|---|---|
| 滑坡编录 | - | 2014 | 重庆市规划与自然资源局 |
| DEM | 10 m | 2016 | 重庆市规划与自然资源局 |
| 地质图 | 1: 50 000 | 2018 | 重庆市规划与自然资源局 |
| Landsat 8影像 | 30 m | 2014 | 地理空间数据云(https://www.gscloud.cn/) |
| 土地利用 | 10 m | 2014 | 清华大学数据中心(http://data.ess.tsinghua.edu.cn/) |
| 全国路网 | 1: 100 000 | 2015 | Open Steet Map(http://www.openstreetmap.org/) |
表2 地层岩性类型分布Tab. 2 Lithological classification in the study area |
| 类型 | 岩性性质 | 地层符号 |
|---|---|---|
| A 松散类岩组 | 粉质粘土,碎石土 | Q4el+dl |
| B 坚硬厚层砂岩组 | 厚层长石砂岩、石英砂岩、粉砂岩 | J3p,T3xj,J2x |
| C 软硬相间砂泥岩互层 | 紫红色泥岩、粉砂质泥岩、长石砂岩、粉砂岩与黄灰色块状长石岩屑砂岩 | J3S,J1z1,J1z |
| D 软弱薄层粘土岩组 | 薄层泥岩、页岩、粉砂岩 | J2S,T2b,P3d |
| E 碳酸盐岩类 | 灰岩、白云岩和少量泥岩 | T1,P1,P3w,C2h,D3S |
| F 较软弱中薄层砂页岩组 | 绿色、灰绿色中薄层粉砂岩和砂页岩 | S1+2lr |
表3 滑坡易发性评价指标信息量值Tab. 3 The information value of landslide susceptibility evaluation indexes |
| 评价指标 | 分级范围 | 信息量 | 评价指标 | 分级范围 | 信息量 |
|---|---|---|---|---|---|
| 高程/m | <450 | 1.465 | 河流距离/m | <400 | 0.463 |
| 450~850 | 0.641 | 400~1 000 | 0.415 | ||
| 850~1 100 | -0.320 | 1 000~1 600 | -0.283 | ||
| 1 100~1 350 | -2.108 | 1 600~2 300 | -0.978 | ||
| >1 350 | -5.406 | >2 300 | -1.196 | ||
| 坡度/° | <9 | -0.947 | 道路距离/m | <200 | 0.704 |
| 9~18 | 0.599 | 200~500 | 0.356 | ||
| 18~24 | 0.449 | 500~1 100 | 0.218 | ||
| 24~33 | -0.199 | 1 100~2 000 | -0.163 | ||
| >33 | -0.961 | >2 000 | -0.484 | ||
| 径流强度指数 | <0.1 | 0.008 | 断层距离/m | <300 | -0.107 |
| 0.1~1 | -0.352 | 300~900 | -0.080 | ||
| 1~10 | -0.950 | 900~1 300 | 0.083 | ||
| 10~100 | -0.978 | 1 300~2 000 | -0.240 | ||
| >100 | -1.180 | >2 000 | 0.049 | ||
| 湿度指数 | <5 | -0.454 | NDVI | <0.08 | -3.275 |
| 5~6 | 0.033 | 0.08~0.40 | 0.404 | ||
| 6~7 | 0.447 | 0.40~0.48 | 0.474 | ||
| 7~9 | 0.483 | 0.48~0.56 | 0.164 | ||
| >9 | -0.419 | >0.56 | -0.877 | ||
| 平面曲率 | <-1 | -0.872 | 剖面曲率 | <-2 | -1.488 |
| -1~0 | 0.037 | -2~0 | 0.026 | ||
| 0~1 | 0.135 | 0~2 | 0.049 | ||
| >1 | -1.270 | >2 | -1.402 | ||
| 曲率 | <-2 | -1.072 | 地形起伏度/m | <15 | -0.370 |
| -2~0 | 0.040 | 15~30 | 0.600 | ||
| 0~2 | 0.148 | 30~45 | 0.011 | ||
| >2 | -1.289 | 45~74 | -0.762 | ||
| 地面粗糙度 | <1.2 | 0.169 | >74 | -1.522 | |
| 1.2~1.4 | -0.875 | 土地利用 | 耕地 | 0.926 | |
| 1.4~1.6 | -1.302 | 林地 | -0.293 | ||
| >1.6 | -1.893 | 建设用地 | 0.822 | ||
| 坡向 | 平面 | -1.994 | 水体 | 0.000 | |
| 北 | 0.294 | 裸地 | 0.297 | ||
| 东北 | -0.025 | 地层岩性 | A 松散类岩组 | 1.662 | |
| 东 | -0.212 | B 坚硬厚层砂岩组 | 0.511 | ||
| 东南 | -0.074 | C 软硬相间砂泥岩互层 | 1.120 | ||
| 南 | 0.316 | D 软弱薄层粘土岩组 | 0.546 | ||
| 西南 | 0.153 | E 碳酸盐岩坚硬岩组 | -3.650 | ||
| 西 | -0.307 | F 较软弱中薄层砂页岩组 | 0.662 | ||
| 西北 | -0.181 |
表4 模型参数设置Tab. 4 Parameters of the used models |
| 模型名称 | 模型参数 |
|---|---|
| RF | 决策树个数 = 120, 最大树深度 = 5 |
| GBDT | 损失函数 = l s, 学习率 = 0.1, 决策树个数=100 |
| LGBM | Bagging比例 = 0.8, Bagging频率 = 6 |
| Boosting-GBDT | 基分类器数量 = 45,学习率 = 1 |
| Boosting-LGBM | 基分类器数量 = 5, 学习率 = 1 |
| Boosting-RF | 基分类器数量 = 10,学习率 = 1 |
| Stacking | 类别概率值 = True |
表5 不同NLS指数的滑坡易发性建模精度Tab. 5 Landslide susceptibility modeling accuracy of NLS indexes |
| NLS | 数据集A | 数据集B | AUC | NLS | 数据集A | 数据集B | AUC |
|---|---|---|---|---|---|---|---|
| 50 | 64 294 | 1 286 | 0.799 | 1/2 | 21 860 | 43 720 | 0.795 |
| 20 | 62 547 | 3 123 | 0.800 | 1/3 | 16 395 | 49 185 | 0.792 |
| 10 | 59 618 | 5 962 | 0.800 | 1/4 | 13 116 | 52 464 | 0.788 |
| 9 | 59 022 | 6 558 | 0.800 | 1/5 | 10 930 | 54 650 | 0.784 |
| 8 | 58 293 | 7 287 | 0.800 | 1/6 | 9 369 | 56 211 | 0.780 |
| 7 | 57 382 | 8 198 | 0.800 | 1/7 | 8 198 | 57 382 | 0.775 |
| 6 | 56 211 | 9 369 | 0.800 | 1/8 | 7 287 | 58 293 | 0.772 |
| 5 | 54 650 | 10 930 | 0.800 | 1/9 | 6 558 | 59 022 | 0.768 |
| 4 | 52 464 | 13 116 | 0.801 | 1/10 | 5 962 | 59 618 | 0.764 |
| 3 | 49 185 | 16 395 | 0.801 | 1/20 | 3 123 | 62 457 | 0.731 |
| 2 | 42 808 | 22 772 | 0.800 | 1/50 | 1 296 | 64 294 | 0.675 |
| 1 | 32 790 | 32 790 | 0.799 | - | - | - | - |
图11 各模型预测滑坡易发性的ROC曲线Fig. 11 The ROC curves of the models in landslide susceptibility |
表6 易发性建模精度统计与对比Tab. 6 Statistics and comparison of the accuracy of susceptibility modeling |
| 精度 | 单模型(a) | 同质集成(b) | 异质集成(c) | 精度提升1(b-a) | 精度提升2(c-a) | 精度提升3(c-b) |
|---|---|---|---|---|---|---|
| RF | 0.882 | 0.902 | 0.941 | 0.020 | 0.059 | 0.039 |
| LGBM | 0.864 | 0.897 | 0.033 | 0.077 | 0.044 | |
| GBDT | 0.855 | 0.870 | 0.015 | 0.086 | 0.071 |
注:a、b、c分别为单模型,同质集成与异质集成的精度;b-a为同质集成相比于单模型的精度提升;c-a为异质集成相比于单模型的精度提升;c-b为异质集成相比于同质集成的精度提升。 |
| [1] |
|
| [2] |
|
| [3] |
|
| [4] |
|
| [5] |
|
| [6] |
|
| [7] |
许冲, 戴福初, 姚鑫, 等. GIS支持下基于层次分析法的汶川地震区滑坡易发性评价[J]. 岩石力学与工程学报, 2009, 28(S2):3978-3985.
[
|
| [8] |
王进, 郭靖, 王卫东, 等. 权重线性组合与逻辑回归模型在滑坡易发性区划中的应用与比较[J]. 中南大学学报(自然科学版), 2012, 43(5):1932-1939.
[
|
| [9] |
|
| [10] |
林齐根, 刘燕仪, 刘连友, 等. 支持向量机与Newmark模型结合的地震滑坡易发性评估研究[J]. 地球信息科学学报, 2017, 19(12):1623-1633.
[
|
| [11] |
|
| [12] |
|
| [13] |
|
| [14] |
|
| [15] |
吴润泽, 胡旭东, 梅红波, 等. 基于随机森林的滑坡空间易发性评价:以三峡库区湖北段为例[J]. 地球科学, 2021, 46(1):321-330.
[
|
| [16] |
徐胜华, 刘纪平, 王想红, 等. 熵指数融入支持向量机的滑坡灾害易发性评价方法——以陕西省为例[J]. 武汉大学学报·信息科学版, 2020, 45(8):1214-1222.
[
|
| [17] |
周超, 殷坤龙, 曹颖, 等. 基于集成学习与径向基神经网络耦合模型的三峡库区滑坡易发性评价[J]. 地球科学, 2020, 45(6):1865-1876.
[
|
| [18] |
|
| [19] |
|
| [20] |
徐慧丽. Stacking算法的研究及改进[D]. 广州: 华南理工大学, 2018.
[
|
| [21] |
|
| [22] |
段宇英, 汤军, 刘远刚, 等. 基于随机森林的山西省柳林县黄土滑坡空间敏感性评价[J]. 地理科学, 2022, 42(2):343-351.
[
|
| [23] |
黄发明, 潘李含, 姚池, 等. 基于半监督机器学习的滑坡易发性预测建模[J]. 浙江大学学报(工学版), 2021, 55(9):1705-1713.
[
|
| [24] |
|
| [25] |
何书, 鲜木斯艳·阿布迪克依木, 胡萌, 等. 基于自组织特征映射网络-随机森林模型的滑坡易发性评价—以江西大余县为例[J]. 中国地质灾害与防治学报, 2022, 33(1):132-140.
[
|
| [26] |
|
| [27] |
|
| [28] |
周超, 殷坤龙, 向章波, 等. 基于GIS的淳安县滑坡易发性定量评价[J]. 安全与环境工程, 2015, 22(1):45-50,55.
[
|
| [29] |
|
| [30] |
|
| [31] |
|
| [32] |
|
| [33] |
|
| [34] |
刘月, 王宁涛, 周超, 等. 基于ROC曲线与确定性系数法集成模型的三峡库区奉节县滑坡易发性评价[J]. 安全与环境工程, 2020, 27(4):61-70.
[
|
| [35] |
|
| [36] |
徐帅, 王尚晓, 牛瑞卿. 基于InSAR技术的三峡库区巫山—奉节段潜在滑坡识别[J]. 安全与环境工程, 2020, 27(1):32-38.
[
|
| [37] |
王佳佳, 殷坤龙, 肖莉丽. 基于GIS和信息量的滑坡灾害易发性评价——以三峡库区万州区为例[J]. 岩石力学与工程学报, 2014, 33(4):797-808.
[
|
| [38] |
刘坚, 李树林, 陈涛. 基于优化随机森林模型的滑坡易发性评价[J]. 武汉大学学报·信息科学版, 2018, 43(7):1085-1091.
[
|
| [39] |
中国地质调查局. 地质灾害调查技术要求(1:50 000):DD2019-08[S]. 北京: 中国标准出版社, 2019.
[Technical requirement for geohazard survey (1:50 000): DD2019-08[S]. Beijing: Standards Press of China, 2019.]
|
| [40] |
|
| [41] |
唐睿旋, 晏鄂川, 唐薇. 基于粗糙集和BP神经网络的滑坡易发性评价[J]. 煤田地质与勘探, 2017, 45(6):129-138.
[
|
| [42] |
郭子正, 殷坤龙, 付圣, 等. 基于GIS与WOE-BP模型的滑坡易发性评价[J]. 地球科学, 2019, 44(12):4299-4312.
[
|
/
| 〈 |
|
〉 |