
Journal of Geo-information Science >
Research on the Spatial Distribution and Influencing Factors of the Catering Industry in Guangzhou from the Perspective of Spatial Correlation
Received date: 2023-05-25
Revised date: 2023-08-09
Online published: 2023-11-02
Supported by
Guangdong Provincial Social Science Planning Project(GD21CYJ06)
Guangdong Provincial Social Science Planning Project(GD22CYJ05)
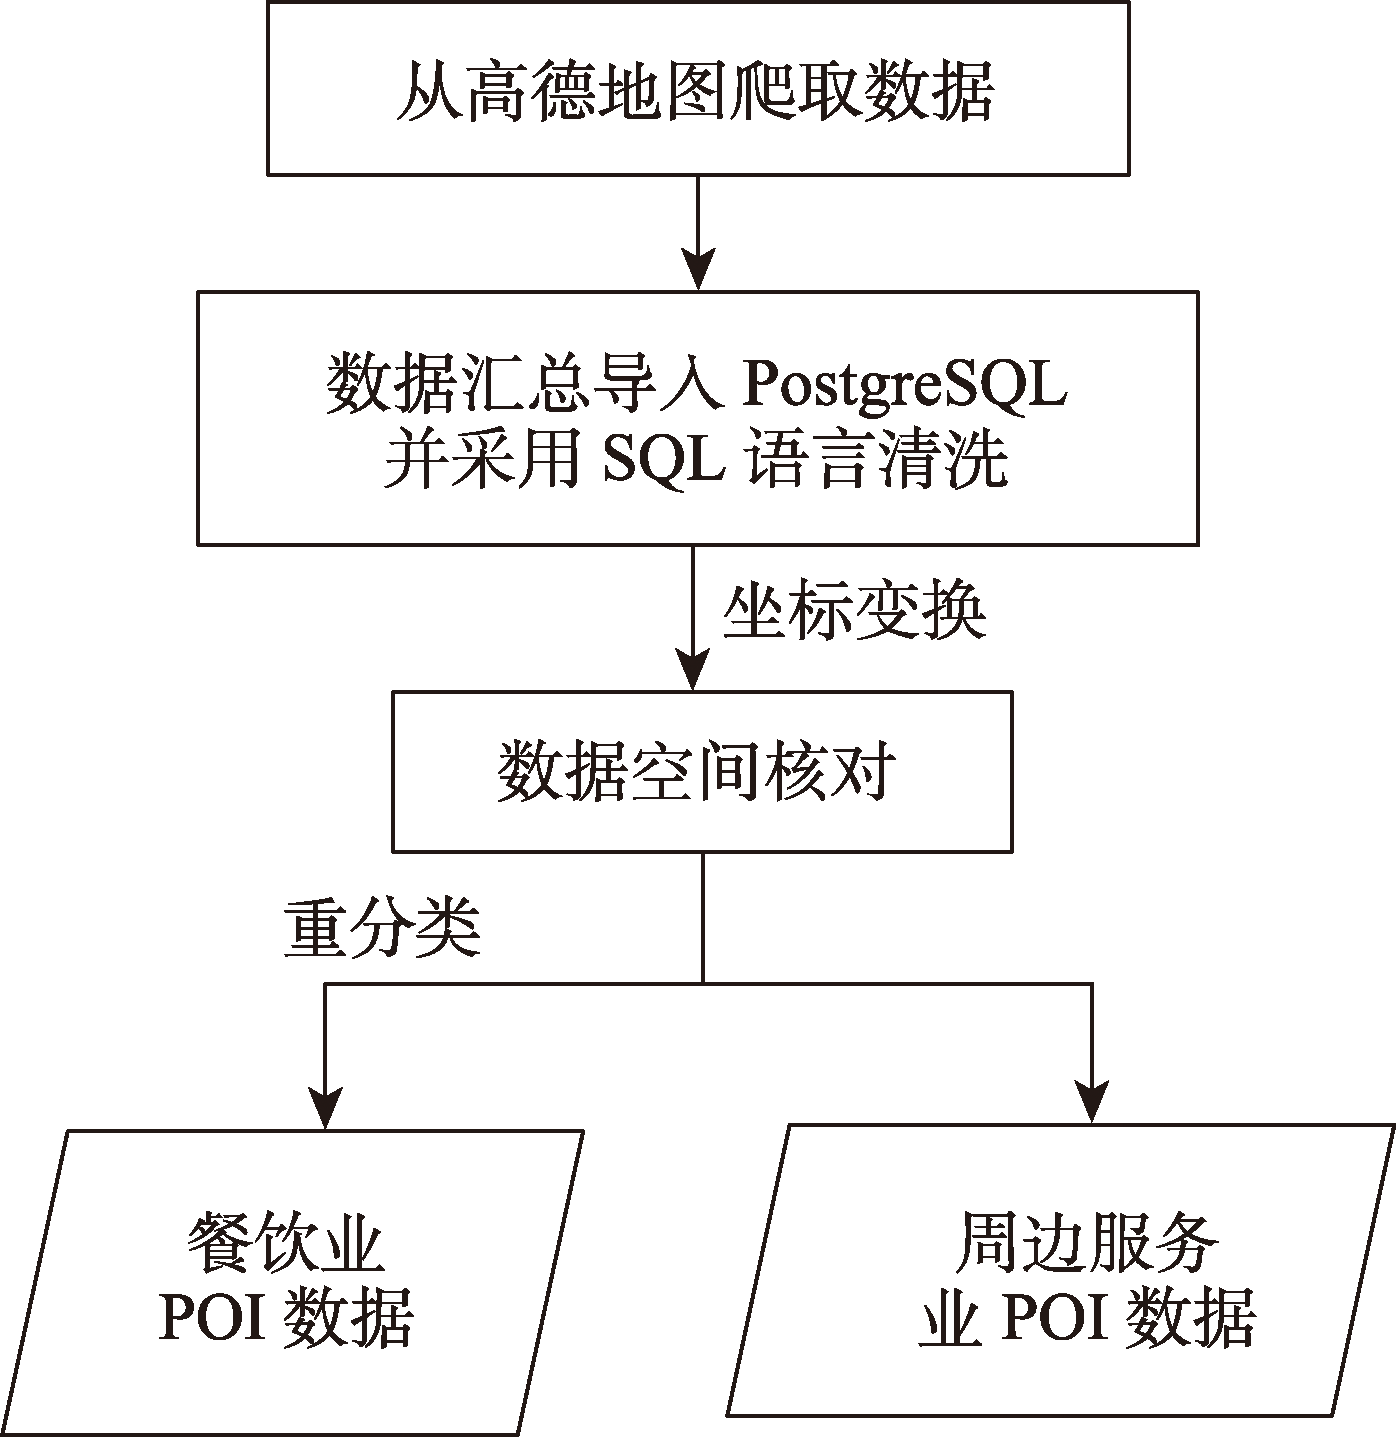
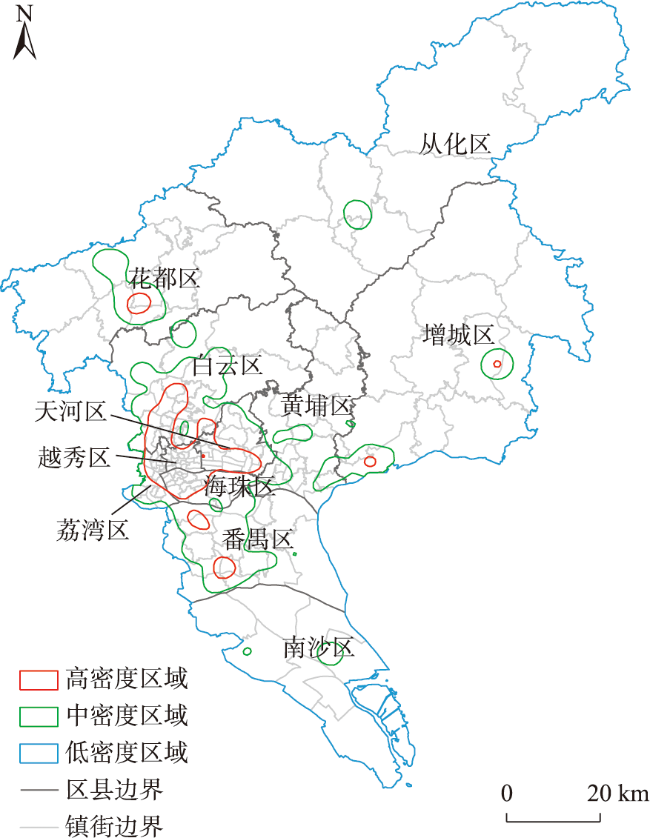
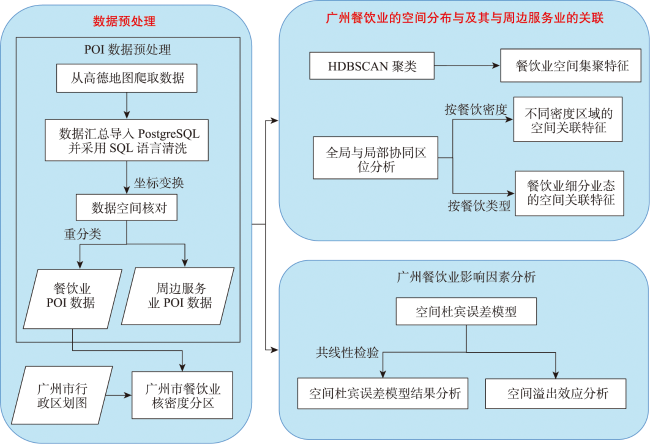
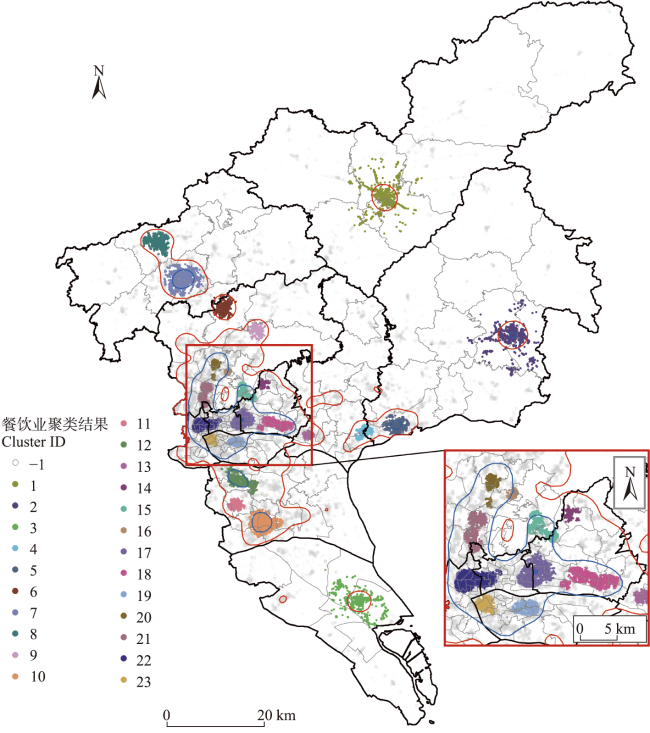
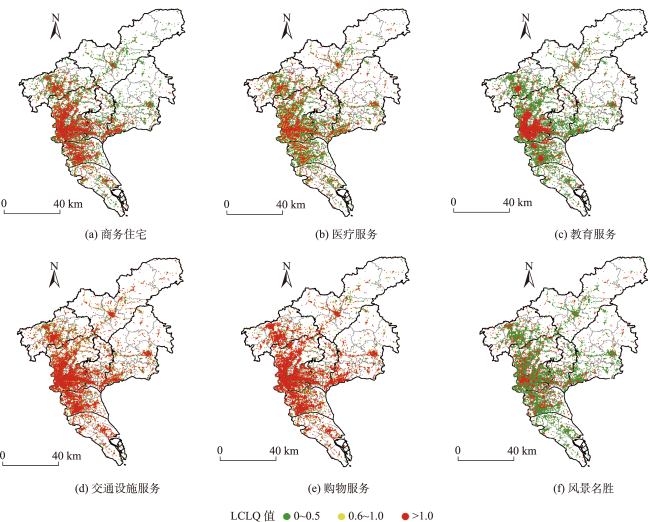
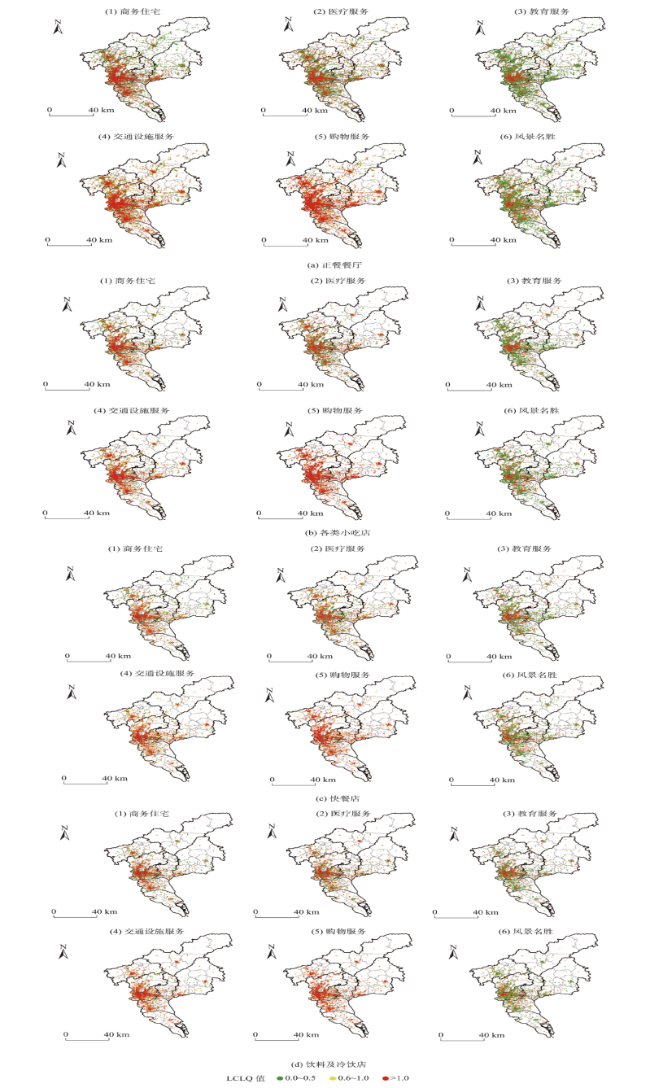
Based on the Point of Interest (POI) big data of the catering industry and related service industries in Guangzhou in 2021, this study analyzes the spatial distribution characteristics, influencing factors, and the spatial spillover effects of the overall and subdivided catering industry in Guangzhou based on the methods of HDBSCAN clustering, Collaborative Location Quotient, and Spatial Durbin Error Model. The study mainly explores the overall and local spatial relationships between the catering industry and surrounding service industries. The results show that: 1) Different catering density areas show variations in the spatial distribution of the catering industry in Guangzhou. The catering industry in high-density areas is characterized by a muti-central agglomeration pattern, while the catering industry in low-density areas is characterized by central agglomeration with surrounding radiation. The local distribution of restaurants are related to population features, such as population density, population education level, and so on; 2) There are variations in the spatial correlation between the catering industry and its surrounding service industries across different catering density areas. Areas with high catering density have the strongest spatial correlation, while areas with moderate catering density have the weakest spatial correlation; 3) the influence of surrounding service industries on different types of catering industry also varies. In general, the spatial correlation strength from strong to weak is as follows: fast restaurants, dinner restaurants, snack bars, and cold beverage shops. The local spatial differences are similar but the spatial difference of dining restaurants is the most obvious; 4) The estimation results of the Spatial Durbin Error Model at the street-town scale show that transportation facilities services, shopping services, and population size have the most direct impact on the POI number of local catering industries, with obvious spatial spillover effects. Both the population size and surrounding service industries are the main factors that influence the spatial distribution of fast food restaurants, while dinner restaurants, snack bars, beverage shops, and other catering industries are easily affected by transportation facilities and shopping services. In general, from the perspective of spatial correlation, this study deepens the research on the location theory of service industries. It also provides references for the study of commercial geography and the optimization and adjustment of the spatial pattern of the catering industry in big cities.
WU Xueqin , HU Weiping , WU Xibo . Research on the Spatial Distribution and Influencing Factors of the Catering Industry in Guangzhou from the Perspective of Spatial Correlation[J]. Journal of Geo-information Science, 2023 , 25(11) : 2232 -2248 . DOI: 10.12082/dqxxkx.2023.230293
表1 2021年POI数据类型及数量Tab. 1 Type and quantity of POI data in 2021 |
| POI类型 | 类别细分 | 数量/万条 | |
|---|---|---|---|
| 餐饮业 | 正餐服务 | 地方菜、火锅、酒楼等 | 8.95 |
| 快餐服务 | 中式快餐店、肯德基、麦当劳等 | 1.61 | |
| 小吃服务 | 面点、粉类、炸串、甜品等 | 4.43 | |
| 饮料及冷饮服务 | 奶茶店、凉茶店、茶饮店等 | 1.79 | |
| 周边服务业 | 购物服务 | 便利店、超级市场、体育用品店等 | 8.08 |
| 商务住宅 | 写字楼、产业园区等 | 1.33 | |
| 教育服务 | 中学、大学、职业学校等 | 0.34 | |
| 风景名胜 | 观景点、海滩、纪念馆等 | 0.39 | |
| 交通设施服务 | 公交车站、地铁站、停车场等 | 6.27 | |
| 医疗保健服务 | 诊所、专科医院、综合医院 | 0.64 | |
表2 基于Queen邻接矩阵的因变量Moran's I指数Tab. 2 Moran's I index of dependent variable based on the Queen adjacency matrix |
| 指标 | Moran's I | 标准差 | Z值 | P值 |
|---|---|---|---|---|
| 所有餐饮业POI数量 | 0.133 | 0.047 | 2.918 | 0.004 |
| 基于熵权法的4种餐饮业POI数量之和 | 0.134 | 0.047 | 2.944 | 0.003 |
| 快餐厅POI数量 | 0.169 | 0.048 | 3.643 | 0.000 |
| 饮料冷饮POI数量 | 0.159 | 0.048 | 0.871 | 0.002 |
| 小吃POI数量 | 0.166 | 0.047 | 3.607 | 0.000 |
| 正餐餐厅POI数量 | 0.124 | 0.047 | 2.737 | 0.006 |
表3 变量及其统计描述Tab. 3 Variables and its statistical description |
| 变量 | 单位 | 样本数/个 | 均值 | 标准差 | 最小值 | 最大值 | 说明 | |
|---|---|---|---|---|---|---|---|---|
| 因变量Yi | Yall | 十个 | 176 | 95.34 | 84.99 | 3.70 | 552.90 | 4种餐饮业POI数量之和 |
| Yewall | 十个 | 176 | 24.60 | 22.00 | 0.96 | 143.24 | 基于熵权法的4种餐饮业POI数量之和 | |
| 快餐厅POI数量Y1 | 十个 | 176 | 9.12 | 7.79 | 0.20 | 47.60 | 高德地图POI中类代码为:0503 | |
| 饮料冷饮POI数量Y2 | 十个 | 176 | 10.17 | 9.00 | 0.00 | 53.20 | POI中类代码为:0505、0506、0507 | |
| 小吃POI数量Y3 | 十个 | 176 | 25.19 | 23.93 | 0.50 | 154.60 | POI中类代码为:0508、0509 | |
| 正餐餐厅POI数量Y4 | 十个 | 176 | 50.85 | 46.07 | 2.40 | 303.00 | POI中类代码为:0501、1001、1002 | |
| 自变量Xi | 风景名胜X1 | 十个 | 176 | 2.23 | 2.36 | 0.00 | 13.20 | POI中类代码为:1102 |
| 购物服务X2 | 十个 | 176 | 45.87 | 47.34 | 1.60 | 359.50 | POI中类代码为:0601、0602、0603、0609 | |
| 交通设施X3 | 十个 | 176 | 35.61 | 28.03 | 0.70 | 185.50 | POI中类代码为:1505、1507、1508、1509 | |
| 教育服务X4 | 十个 | 176 | 1.94 | 3.88 | 0.00 | 34.70 | POI中类代码为:1402 | |
| 医疗服务X5 | 十个 | 176 | 3.66 | 3.03 | 0.10 | 21.10 | POI中类代码为:0901、0902、0903 | |
| 商务住宅X6 | 十个 | 176 | 7.55 | 7.71 | 0.00 | 55.10 | POI中类代码为:1201 | |
| 区位X7 | - | 176 | 2.22 | 0.841 | 1.00 | 3.00 | 将广州176个街镇分成中心城区(包括越秀、天河、海珠、荔湾)、近郊区(包括黄埔、白云、番禺)及远郊区(包括从化、增城、花都、南沙)三类,分别赋值3、2、1 | |
| 人口规模X8 | 万人 | 176 | 10.61 | 6.979 | 0.320 | 39.73 | 基于广州市2020年第七次人口普查数据 | |
表4 不同餐饮密度区域餐饮业吸引周边服务业的全局区位熵Tab. 4 GCLQ results of surrounding service industry attracted by catering industry in different catering density areas |
| 餐饮密度 | 商务住宅 | 教育服务 | 购物服务 | 医疗服务 | 交通设施服务 | 风景名胜 |
|---|---|---|---|---|---|---|
| 高密度 | 0.686 1 | 0.591 6 | 0.788 8 | 0.631 1 | 0.591 6 | 0.506 8 |
| 中密度 | 0.627 2 | 0.411 4 | 0.805 8 | 0.715 7 | 0.592 4 | 0.469 9 |
| 低密度 | 0.558 9 | 0.633 9 | 0.847 6 | 0.737 5 | 0.574 1 | 0.465 1 |
注:计算结果在0.01水平上显著。 |
表5 不同餐饮密度区域周边服务业吸引餐饮业的全局区位熵Tab. 5 GCLQ results of catering industry attracted by surrounding service industry in different catering density areas |
| 餐饮密度 | 商务住宅 | 教育服务 | 购物服务 | 医疗服务 | 交通设施服务 | 风景名胜 |
|---|---|---|---|---|---|---|
| 高密度 | 0.829 0 | 0.730 8 | 0.849 4 | 0.710 5 | 0.730 8 | 0.699 8 |
| 中密度 | 0.822 3 | 0.621 9 | 0.889 2 | 0.823 4 | 0.747 9 | 0.723 2 |
| 低密度 | 0.807 7 | 0.904 8 | 0.917 0 | 0.888 3 | 0.750 8 | 0.680 4 |
注:计算结果在0.01水平上显著。 |
表6 不同类型餐饮业吸引周边服务业的全局区位熵Tab. 6 GCLQ results of surrounding service industry attracted by different types catering industry |
| 餐饮类型 | 商务住宅 | 教育服务 | 购物服务 | 医疗服务 | 交通设施服务 | 风景名胜 |
|---|---|---|---|---|---|---|
| 正餐餐厅 | 0.652 4 | 0.452 0 | 0.806 4 | 0.716 6 | 0.623 9 | 0.493 6 |
| 快餐厅 | 0.699 9 | 0.522 6 | 0.896 3 | 0.762 7 | 0.754 3 | 0.512 8 |
| 小吃服务 | 0.564 6 | 0.407 3 | 0.828 8 | 0.668 4 | 0.582 2 | 0.410 9 |
| 饮料及冷饮服务 | 0.644 2 | 0.487 5 | 0.805 8 | 0.683 4 | 0.708 1 | 0.450 6 |
注:计算结果在0.01水平上显著。 |
表7 周边服务业吸引不同类型餐饮业的全局区位熵Tab. 7 GCLQ results of different types catering industry attracted by surrounding service industry |
| 餐饮类型 | 正餐餐厅 | 快餐厅 | 小吃服务 | 饮料及冷饮服务 |
|---|---|---|---|---|
| 商务住宅 | 0.795 3 | 0.753 8 | 0.735 4 | 0.729 3 |
| 教育服务 | 0.614 7 | 0.605 7 | 0.588 7 | 0.588 4 |
| 购物服务 | 0.863 8 | 0.928 7 | 0.922 3 | 0.844 5 |
| 医疗服务 | 0.777 0 | 0.775 4 | 0.765 5 | 0.744 0 |
| 交通设施服务 | 0.743 8 | 0.785 1 | 0.700 4 | 0.779 9 |
| 风景名胜 | 0.668 2 | 0.592 5 | 0.606 5 | 0.570 3 |
注:计算结果在0.01水平上显著。 |
表8 解释变量共线性检验Tab. 8 Collinearity test of explanatory variables |
| 变量 | 风景名胜X1 | 购物服务X2 | 交通设施X3 | 教育服务X4 | 医疗服务X5 | 商务住宅X6 | 区位X7 | 人口规模X8 |
|---|---|---|---|---|---|---|---|---|
| VIF | 1.46 | 7.73 | 5.51 | 1.96 | 3.82 | 4.22 | 1.4 | 4.36 |
表9 空间杜宾误差模型估计结果Tab. 9 The estimation results of SDEM |
| 指标 | 全类型 | 细分业态 | |||||
|---|---|---|---|---|---|---|---|
| Yall | Yewall | Y1 | Y2 | Y3 | Y4 | ||
| lnX1 | -0.015 | -0.008 | 0.025 | -0.027 | -0.027 | -0.000 | |
| (-0.56) | (-0.33) | (0.82) | (-0.56) | (-0.99) | (-0.01) | ||
| lnX2 | 0.565*** | 0.524*** | 0.549*** | 0.230* | 0.616*** | 0.636*** | |
| (8.50) | (8.29) | (6.95) | (1.89) | (8.74) | (9.92) | ||
| lnX3 | 0.353*** | 0.282*** | 0.069 | 0.533*** | 0.078 | 0.351*** | |
| (5.68) | (4.91) | (0.93) | (4.77) | (1.15) | (6.05) | ||
| lnX4 | 0.038 | 0.050 | 0.142*** | 0.074 | 0.071** | 0.027 | |
| (1.17) | (1.56) | (3.60) | (1.23) | (2.06) | (0.85) | ||
| lnX5 | -0.027 | 0.012 | -0.066 | 0.130 | -0.017 | 0.027 | |
| (-0.49) | (0.23) | (-1.00) | (1.29) | (-0.29) | (0.51) | ||
| lnX6 | -0.040 | -0.003 | 0.155*** | 0.054 | 0.070 | -0.089** | |
| (-0.94) | (-0.06) | (3.08) | (0.70) | (1.55) | (-2.20) | ||
| X7 | 0.032 | 0.043 | 0.001 | 0.043 | 0.072* | 0.024 | |
| (0.97) | (1.55) | (0.04) | (0.78) | (1.81) | (0.84) | ||
| lnX8 | 0.190*** | 0.183*** | 0.135 | 0.154 | 0.360*** | 0.048 | |
| (2.72) | (2.67) | (1.59) | (1.18) | (4.83) | (0.69) | ||
| _cons | 0.744*** | -0.321** | -0.688*** | -1.257*** | -0.542*** | 0.226 | |
| (4.39) | (-2.22) | (-3.65) | (-4.31) | (-2.85) | (1.52) | ||
| 空间滞后W: | |||||||
| lnX1 | 0.079 | 0.031 | -0.008 | -0.043 | 0.048 | 0.037 | |
| (1.37) | (0.60) | (-0.11) | (-0.41) | (0.71) | (0.70) | ||
| lnX2 | -0.585*** | -0.492*** | -0.411** | 0.107 | -0.422** | -0.700*** | |
| (-3.07) | (-3.35) | (-2.38) | (0.41) | (-2.00) | (-4.33) | ||
| lnX3 | -0.521*** | -0.281*** | 0.135 | -0.345* | -0.071 | -0.485*** | |
| (-3.98) | (-3.06) | (1.13) | (-1.66) | (-0.60) | (-4.94) | ||
| lnX4 | 0.011 | -0.062 | -0.088 | -0.094 | -0.046 | -0.014 | |
| (0.16) | (-0.96) | (-0.97) | (-0.74) | (-0.55) | (-0.22) | ||
| lnX5 | 0.095 | -0.047 | -0.197 | -0.342* | -0.079 | 0.004 | |
| (0.86) | (-0.47) | (-1.56) | (-1.74) | (-0.63) | (0.04) | ||
| lnX6 | 0.173** | -0.026 | -0.164 | -0.211 | -0.048 | 0.162** | |
| (2.43) | (-0.36) | (-1.58) | (-1.56) | (-0.49) | (2.39) | ||
| lnX8 | -0.076 | -0.265* | -0.202 | -0.320 | -0.486*** | -0.040 | |
| (-0.49) | (-1.76) | (-1.15) | (-1.23) | (-2.61) | (-0.28) | ||
| Spatial rho | 0.818*** | 1.122*** | 0.964*** | 1.113*** | 0.993*** | 1.055*** | |
| (4.24) | (6.24) | (5.94) | (5.11) | (4.63) | (6.31) | ||
| Spatial lamda | -0.598** | -0.876*** | -0.746*** | -0.835*** | -0.307 | -0.800*** | |
| (-2.04) | (-3.10) | (-2.76) | (-2.91) | (-0.98) | (-3.05) | ||
| N | 176 | 176 | 176 | 176 | 176 | 176 | |
| Wald test of spatial terms | 38.29*** | 70.75*** | 62.70*** | 37.88*** | 39.78*** | 90.46*** | |
注:*p<0.1; **p<0.05; ***p<0.01,括号内数据为对应系数的z值; Spatial rho为空间自回归系数; Spatial lamda为误差项的空间自回归系数。 |
表10 空间溢出效应分解Tab. 10 Decomposition of spatial spillover effect |
| 变量 | 总体效应 | 直接效应 | 间接效应 |
|---|---|---|---|
| lnX1 | 0.217 | -0.000 5 | 0.218 |
| lnX2 | 0.135 | 0.538 0 | -0.403 |
| lnX3 | -0.454 | 0.303 0 | -0.757 |
| lnX4 | 0.186 | 0.047 0 | 0.138 |
| lnX5 | 0.226 | -0.011 0 | 0.237 |
| lnX6 | 0.449 | -0.010 0 | 0.458 |
| X7 | 0.122 | 0.037 0 | 0.085 |
| lnX8 | 0.467 | 0.207 0 | 0.260 |
| [1] |
阎小培, 姚一民. 广州第三产业发展变化及空间分布特征分析[J]. 经济地理, 1997, 17(2):41-48.
[
|
| [2] |
方远平, 闫小培, 毕斗斗, 等. 转型期广州市服务业区位演变及布局特征[J]. 经济地理, 2009, 29(3):370-376.
[
|
| [3] |
方远平, 阎小培. 1990年代以来我国沿海中心城市服务业特征与趋势比较研究——以北京、上海与广州为例[J]. 经济地理, 2004, 24(5):614-619,637.
[
|
| [4] |
申玉铭, 邱灵, 任旺兵, 等. 中国服务业空间差异的影响因素与空间分异特征[J]. 地理研究, 2007, 28(6):1255-1264.
|
| [5] |
施响, 王士君, 浩飞龙. 等. 基于实体店比较的长春市外卖O2O餐饮业空间特征及成因[J]. 人文地理, 2019, 34(2):80-89.
[
|
| [6] |
|
| [7] |
|
| [8] |
金相郁. 20世纪区位理论的五个发展阶段及其评述[J]. 经济地理, 2004, 24(3):294-298,317.
[
|
| [9] |
方远平, 阎小培, 陈忠暖. 服务业区位因素体系的研究[J]. 经济地理, 2008,(1):44-48,58.
[
|
| [10] |
|
| [11] |
|
| [12] |
|
| [13] |
夏令军, 刘艳芳, 刘国炜. 中国地级城市餐饮业分布格局及影响因素——基于“大众点评网”数据的实证研究[J]. 经济地理, 2018, 38(5):133-141.
|
| [14] |
车冰清, 简晓彬, 陆玉麒. 江苏省商业网点的空间分布特征及其区域差异因素[J]. 地球信息科学学报, 2017, 19(8):1060-1068.
|
| [15] |
|
| [16] |
舒舍玉, 王润, 孙艳伟, 等. 城市餐饮业的空间格局及影响因素分析——以厦门市为例[J]. 热带地理, 2012, 32(2):134-140.
|
| [17] |
徐晓宇, 李梅. 基于开源大数据的北京地区餐饮业空间分布格局[J]. 地球信息科学学报, 2019, 21(2):215-225.
|
| [18] |
|
| [19] |
|
| [20] |
曾璇, 崔海山, 刘志根. 广州市餐饮店分布演变特征与影响因素[J]. 经济地理, 2019, 39(3):143-151.
|
| [21] |
莫惠斌, 罗珂, 王少剑, 等. 广州市中心城区餐饮店空间分异与机制差异研究——基于传统店与外卖店的对比[J]. 地理研究, 2022, 41(12):3318-3334.
[
|
| [22] |
国家统计局,中国标准化研究院. 《国民经济行业分类》GB/T4754-2017[M]. 中国计划出版社, 2017
[ National Bureau of Statistics,China National Institute of Standardization. Industrial classification of the national economy GB/T4754-2017[M]. China planning press, 2017. ]
|
| [23] |
统计局. 统计局关于印发《生活性服务业统计分类(2019)》的通知[J]. 中华人民共和国国务院公报, 2019(24):60-73.
[
|
| [24] |
巫细波. 外资主导下的汽车制造业空间分布特征及其影响因素——以广州为例[J]. 经济地理, 2019, 39(7):119-128.
[
|
| [25] |
|
| [26] |
|
| [27] |
|
| [28] |
|
| [29] |
|
| [30] |
|
| [31] |
|
| [32] |
|
| [33] |
姜磊, 柏玲, 季民河. 金融支撑与区域创新的竞争和溢出效应——基于空间杜宾误差模型的研究[J]. 区域金融研究, 2012(11):16-24.
[
|
/
| 〈 |
|
〉 |