
Journal of Geo-information Science >
An Improved SFIM Remote Sensing Image Fusion Method Considering Local Variance Mutual Information and Gradient Consistency
Received date: 2023-11-14
Revised date: 2024-01-05
Online published: 2024-03-31
Supported by
Natural Science Foundation of Henan Province(222300420592)
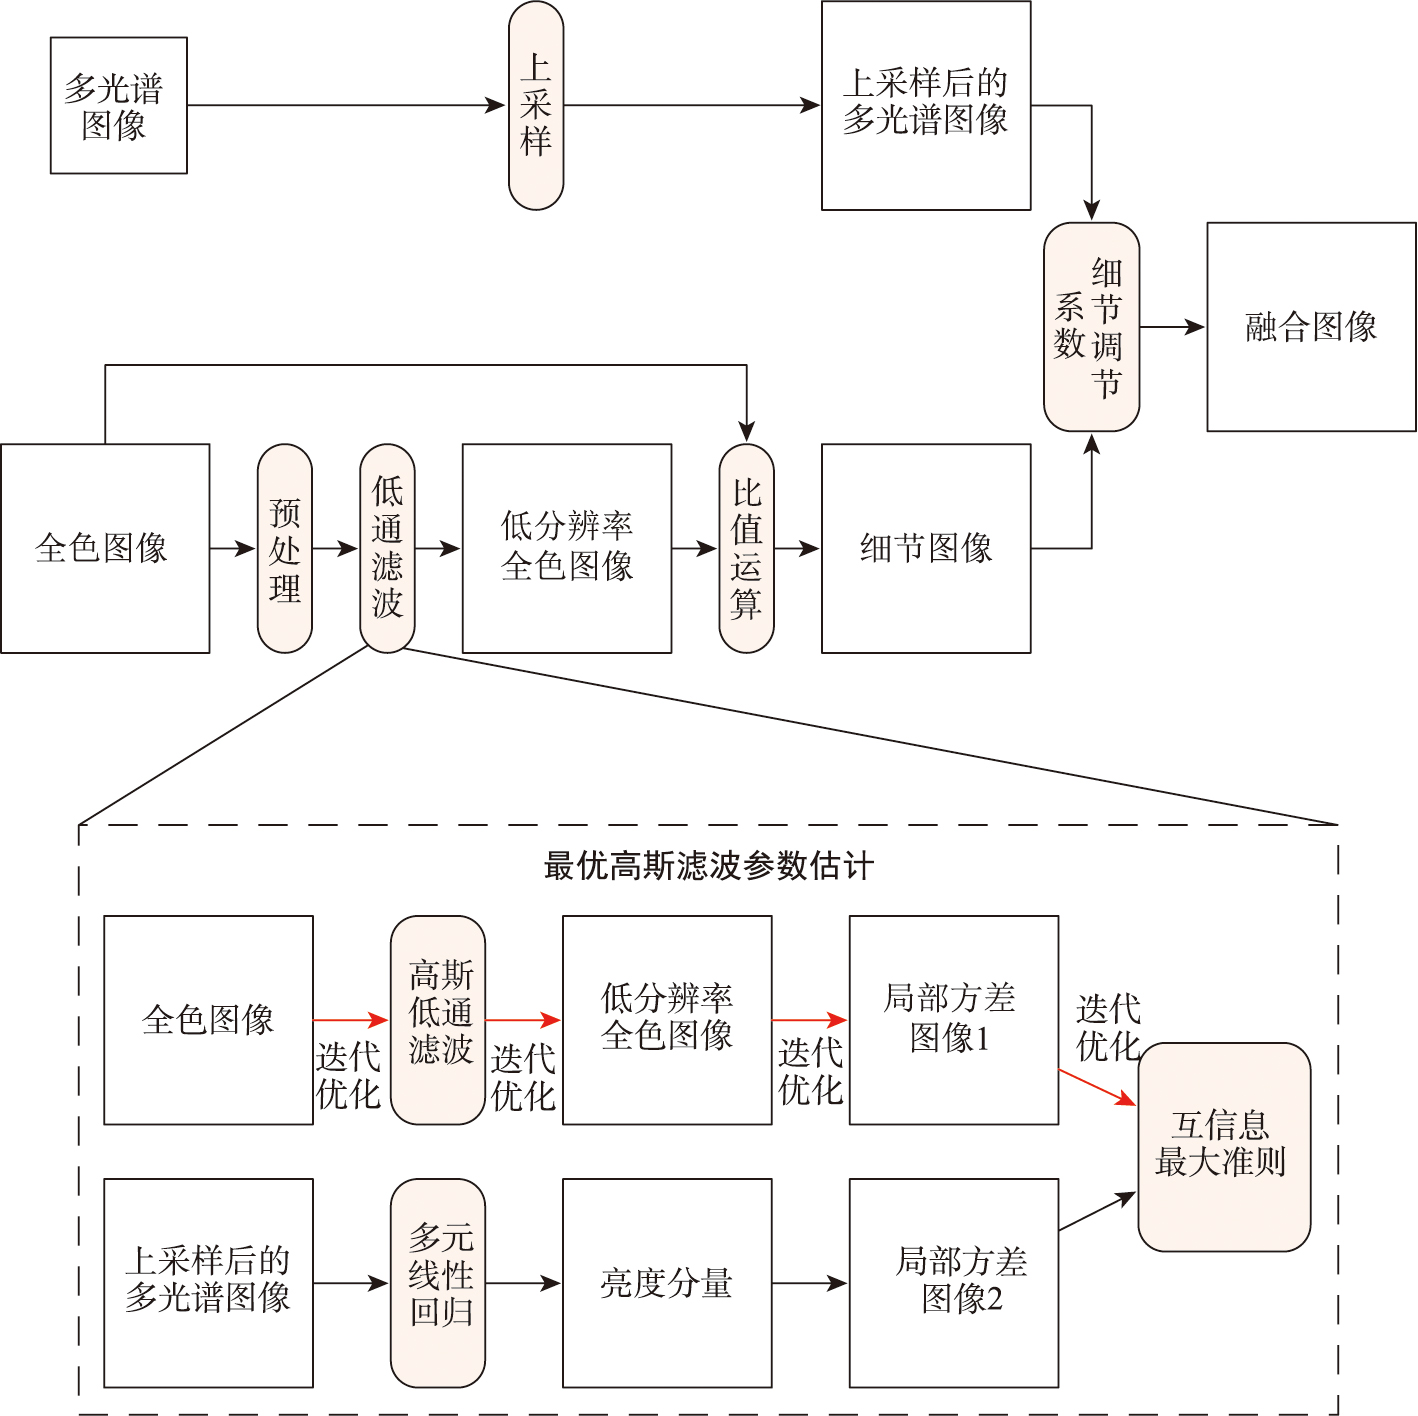
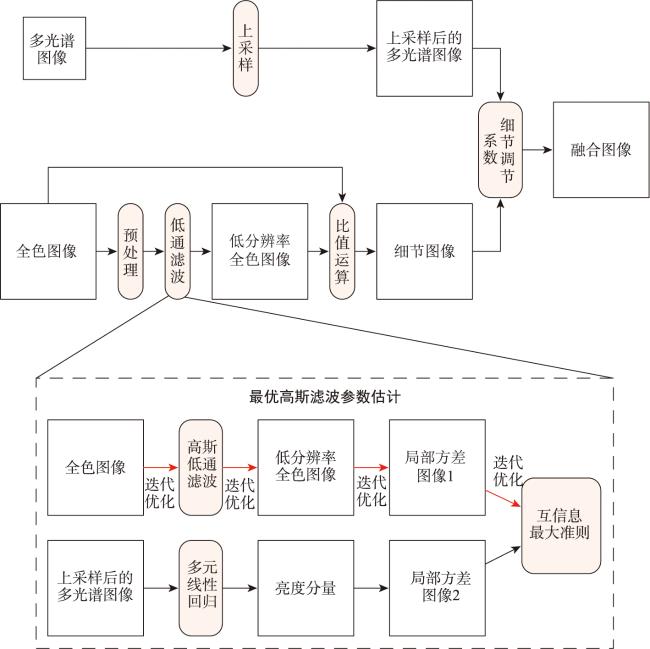
Due to differences in spectral and spatial scales, the fusion results of panchromatic and multispectral images often have spectral or spatial distortion. How to achieve alignment on both scales simultaneously is crucial for enhancing fusion performance. The traditional Smoothing Filter-based Intensity Modulation (SFIM) remote sensing image fusion method can ensure consistency on the spectral scale but is not precise enough in measuring spatial scale consistency. To address this issue, this paper proposes a spatial scale alignment method considering local variance mutual information and further improves the SFIM method with the constraint of average gradient consistency. This method first linearly fits each band of the multispectral images to generate an intensity image and applies Gaussian low-pass filtering to high-resolution panchromatic images. By iteratively calculating the mutual information between the local variance images of the two images, the optimal filtering estimation parameters are determined when the mutual information is maximized. Then, the Gaussian filter is used to convolve the high-resolution panchromatic image, obtaining a low-resolution panchromatic image that matches the spatial scale of the multispectral images. The detail image is obtained by processing the ratio between the high-resolution and low-resolution panchromatic images. Based on the average gradient of high-resolution panchromatic images, an adjustment coefficient is introduced to control the amount of detail injection. Finally, the fusion image is obtained by multiplying the detail image, modulation factor, and multispectral image. To validate the effectiveness of this method, fusion experiments are conducted on six sets of images from three different scenes: vegetation area, building area, and mixed area of the IKONOS and Quickbird datasets. For the IKONOS data, the three experimental groups of our method all rank second in terms of spectral retention index SAM, and the information content EN ranks first in two groups. For the Quickbird data, the proposed method performs best in terms of SAM, EN, and AG indices in all three sets of experiments, demonstrating good spectral preservation and information richness. The proposed method outperforms the AGSFIM method in terms of SAM, EN, and AG in four sets of experiments, though the AGSFIM method obtains the highest spatial information preservation index SCC. Compared with the GSA or SFIM methods with similar SCC values, the proposed method shows an average improvement of 13.39%, 39.52%, and 34.03% for the other three indicators in the six experiments. In terms of fusion scenes, the proposed method performs well in scenes where vegetation or mixed areas dominate, while scenes dominated by buildings show the advantages of the proposed method in spectral methods. The abundance and clarity of image information also satisfactory, especially in fusion scenes with a higher proportion of vegetation. Moreover, the proposed method also exhibits good visual appearance. There is minimal color difference between the fused true-color image and the original true image and acomparable image clarity against the panchromatic image. In terms of fusion scenes, the method in this paper demonstrates a clear advantage in spectral preservation for vegetation-dominated or mixed areas, with a relatively rich amount of image information; for scenes dominated by buildings, the fusion results also show good performance in terms of spectral richness, information content, and clarity.
WANG Shuxiang , JIN Fei , LIN Yuzhun , ZUO Xibing , LIU Xiao . An Improved SFIM Remote Sensing Image Fusion Method Considering Local Variance Mutual Information and Gradient Consistency[J]. Journal of Geo-information Science, 2024 , 26(3) : 693 -708 . DOI: 10.12082/dqxxkx.2024.230675
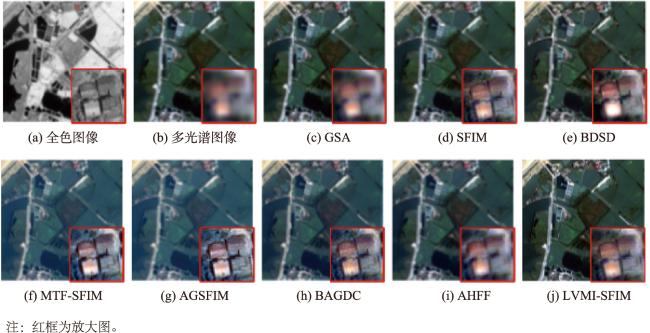
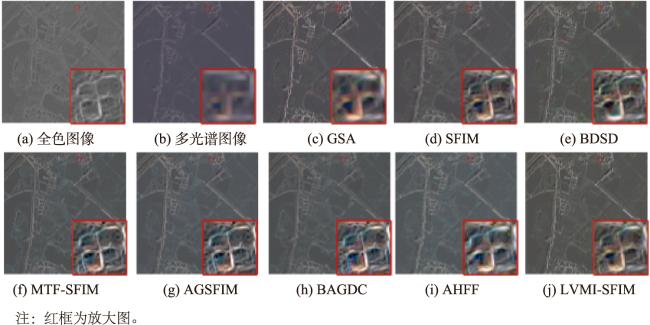
图2 IKONOS数据植被区不同方法融合结果Fig.2 The fusion results of different methods for IKONOS data in vegetation region |
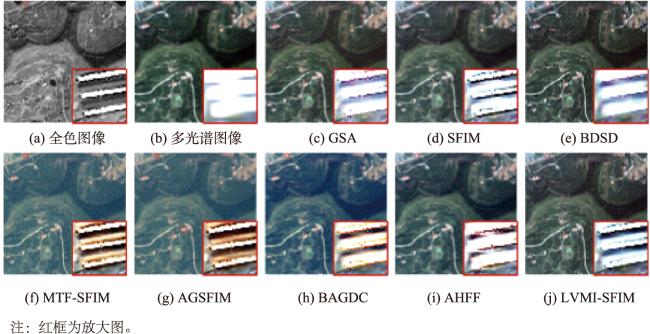
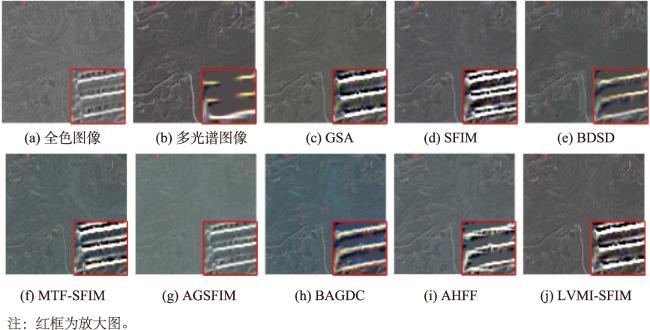
图3 Quickbird数据植被区不同方法融合结果Fig. 3 The fusion results of different methods for Quickbird data in vegetation region |
图4 IKONOS数据植被区不同方法融合结果梯度图像Fig. 4 Gradient of different fusion image for IKONOS data in vegetation region |
图5 QuickBird数据植被区不同方法融合结果梯度图像Fig. 5 Gradient of different fusion image for Quickbird data in vegetation region |
表1 IKONOS植被区融合结果客观评价指标Tab. 1 Objective evaluation indicators for the fusion results of IKONOS vegetation region |
| 方法 指标 | GSA | BDSD | SFIM | MTF-SFIM | AGSFIM | BAGDC | AFHH | LVMI-SFIM |
|---|---|---|---|---|---|---|---|---|
| SAM↓ | 1.164 | 1.461 | 0.883 | 1.000 | 1.166 | 0.820 | 0.878 | 0.855 |
| EN ↑ | 0.778 | 0.826 | 0.783 | 0.834 | 0.830 | 0.316 | 0.782 | 0.989 |
| AG↑ | 13.056 | 18.305 | 15.833 | 19.236 | 18.615 | 12.183 | 13.606 | 17.634 |
| SCC↑ | 0.663 | 0.647 | 0.713 | 0.854 | 0.877 | 0.755 | 0.688 | 0.715 |
注:表中加粗数值表示最佳, 表示最差。 |
表2 QuickBird植被区融合结果客观评价指标Tab. 2 Objective evaluation indicators for the fusion results of QuickBird vegetation region |
| 方法 指标 | GSA | BDSD | SFIM | MTF-SFIM | AGSFIM | BAGDC | AFHH | LVMI-SFIM |
|---|---|---|---|---|---|---|---|---|
| SAM↓ | 1.856 | 1.704 | 0.999 | 1.123 | 1.300 | 1.085 | 1.015 | 0.953 |
| EN ↑ | 0.367 | 0.479 | 0.433 | 0.519 | 0.534 | 0.159 | 0.391 | 0.772 |
| AG↑ | 12.275 | 13.530 | 13.951 | 22.249 | 22.616 | 10.324 | 10.474 | 24.360 |
| SCC↑ | 0.762 | 0.692 | 0.741 | 0.913 | 0.931 | 0.649 | 0.704 | 0.789 |
注:表中加粗数值表示最佳, 表示最差。 |
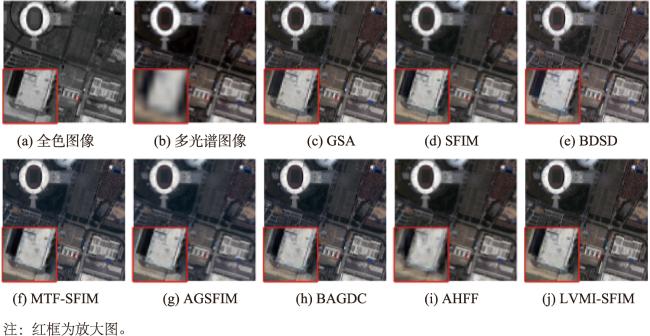
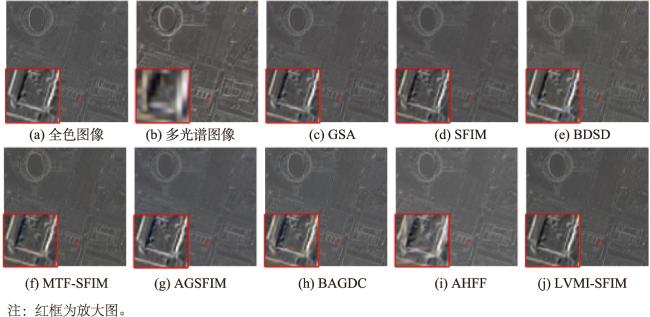
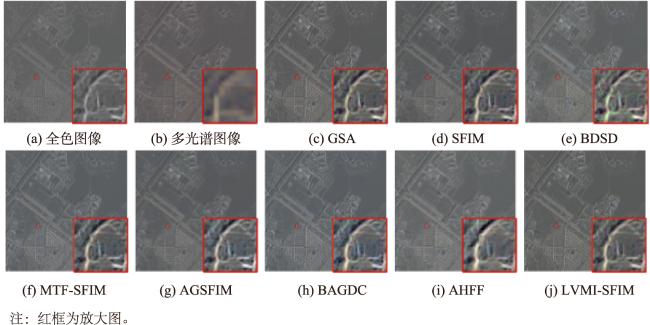
图6 IKONOS数据建筑区不同方法融合结果Fig. 6 The fusion results of different methods for IKONOS data in building region |
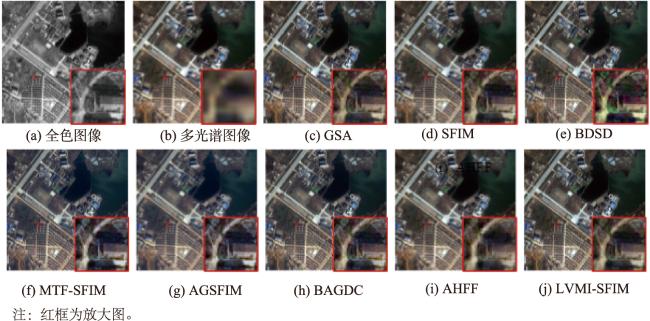
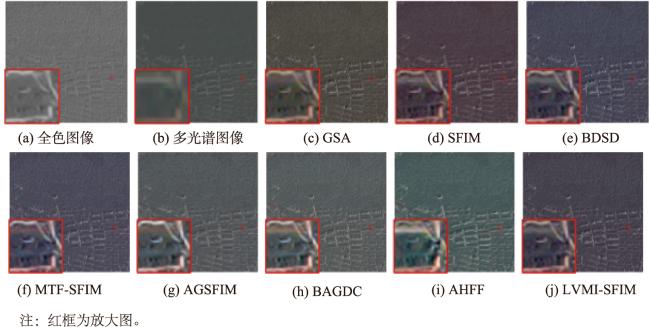
图7 Quickbird数据建筑区不同方法融合结果Fig. 7 The fusion results of different methods for Quickbird data in building region |
图8 IKONOS数据建筑区不同方法融合结果梯度图像Fig. 8 Gradient of different fusion image for IKONOS data in building region |
表3 IKONOS建筑区融合结果客观评价指标Tab.3 Objective evaluation indicators for the fusion results of IKONOS buiding region |
| 方法 指标 | GSA | BDSD | SFIM | MTF-SFIM | AGSFIM | BAGDC | AHFF | LVMI-SFIM |
|---|---|---|---|---|---|---|---|---|
| SAM↓ | 1.289 | 2.252 | 1.216 | 1.235 | 1.396 | 1.060 | 1.210 | 1.212 |
| EN ↑ | 1.282 | 1.511 | 1.360 | 1.454 | 1.358 | 1.338 | 1.324 | 1.304 |
| AG↑ | 29.298 | 39.383 | 32.689 | 35.909 | 31.759 | 30.812 | 24.200 | 30.627 |
| SCC↑ | 0.944 | 0.871 | 0.933 | 0.954 | 0.955 | 0.893 | 0.779 | 0.938 |
注:表中加粗数值表示最佳, 表示最差。 |
表4 QuickBird 建筑区 融合结果客观评价指标Tab.4 Objective evaluation indicators for the fusion results of IKONOS building region |
| 方法 指标 | GSA | BDSD | SFIM | MTF-SFIM | AGSFIM | BAGDC | AHFF | LVMI-SFIM |
|---|---|---|---|---|---|---|---|---|
| SAM↓ | 1.075 | 1.572 | 0.807 | 0.893 | 1.041 | 0.858 | 0.825 | 0.793 |
| EN ↑ | 0.621 | 0.739 | 0.692 | 0.736 | 0.733 | 0.615 | 0.649 | 0.888 |
| AG↑ | 14.781 | 16.959 | 17.974 | 22.149 | 22.146 | 20.413 | 11.233 | 22.702 |
| SCC↑ | 0.937 | 0.845 | 0.901 | 0.954 | 0.961 | 0.874 | 0.805 | 0.932 |
注:表中加粗数值表示最佳, 表示最差。 |
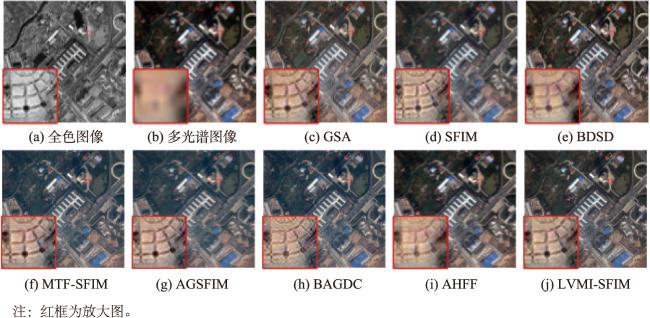
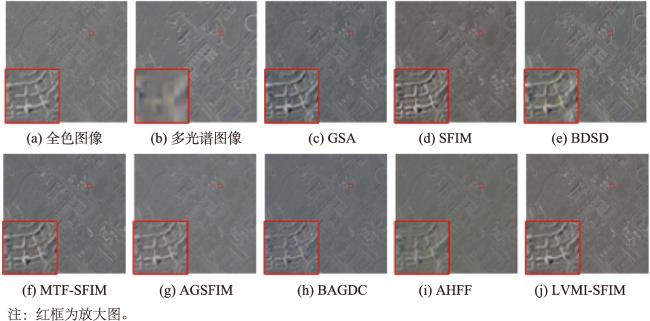
图10 IKONOS数据混合区不同方法融合结果Fig. 10 The fusion results of different methods for IKONOS data in mixed region |
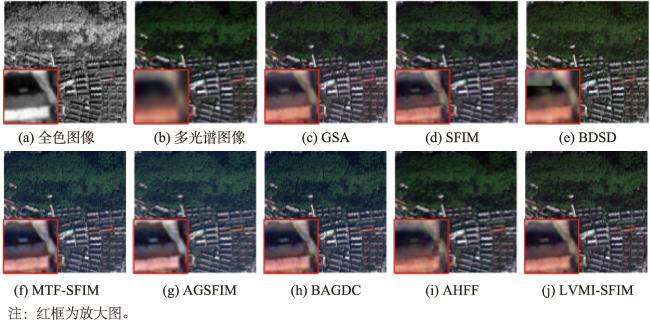
图11 Quickbird数据混合区不同方法融合结果Fig. 11 The fusion results of different methods for Quickbird data in mixed region |
图12 IKONOS数据混合区不同方法融合结果梯度图像Fig. 12 Gradient of different fusion image for IKONOS data in mixed region |
表5 IKONOS混合区融合结果客观评价指标Tab. 5 Objective evaluation indicators for the fusion results of IKONOS Mixed region |
| 方法 指标 | GSA | BDSD | SFIM | MTF-SFIM | AGSFIM | BAGDC | AHFF | LVMI-SFIM |
|---|---|---|---|---|---|---|---|---|
| SAM↓ | 0.855 | 1.040 | 0.696 | 0.753 | 0.871 | 0.646 | 0.706 | 0.681 |
| EN ↑ | 0.800 | 0.834 | 0.821 | 0.854 | 0.842 | 0.838 | 0.817 | 0.910 |
| AG↑ | 11.622 | 15.800 | 12.565 | 15.858 | 15.234 | 12.994 | 10.293 | 13.681 |
| SCC↑ | 0.934 | 0.902 | 0.925 | 0.969 | 0.980 | 0.938 | 0.840 | 0.929 |
注:表中加粗数值表示最佳, 表示最差。 |
表6 QuickBird混合区融合结果客观评价指标Tab. 6 Objective evaluation indicators for the fusion results of Quickbird mixed region |
| 方法 指标 | GSA | BDSD | SFIM | MTF-SFIM | AGSFIM | BAGDC | AHFF | LVMI-SFIM |
|---|---|---|---|---|---|---|---|---|
| SAM↓ | 1.444 | 1.858 | 0.909 | 1.008 | 1.195 | 0.935 | 0.923 | 0.890 |
| EN ↑ | 0.408 | 0.521 | 0.428 | 0.466 | 0.477 | 0.294 | 0.421 | 0.724 |
| AG↑ | 9.006 | 10.287 | 9.970 | 12.632 | 13.217 | 9.681 | 7.856 | 13.620 |
| SCC↑ | 0.850 | 0.758 | 0.838 | 0.925 | 0.941 | 0.881 | 0.736 | 0.865 |
注:表中加粗数值表示最佳, 表示最差。 |
表7 不同融合方法综合比较Tab. 7 Comparison of different fusion methods |
| 方法 | 方法重点 | 融合结果 | 适应场景 | |
|---|---|---|---|---|
| 光谱保持 | 空间保持 | |||
| GSA | 多光谱图像线性拟合亮度分量 | 视觉效果较好 客观指标不佳 | 客观指标不高 | 植被为主 |
| BDSD | 分块处理,局部共享权重 | 无明显光谱失真 | 块状明显 清晰度不稳定 | |
| SFIM | 均值滤波获取低分辨率全色图像 | 视觉效果较好 | 客观指标不高 | 植被为主 混合场景 |
| MTF-SFIM | 与卫星传感器MTF匹配的高斯低通滤波获取低分辨率全色图像 | 光谱失真明显 | 边缘细节显著 清晰度较好 | 建筑为主 |
| AGSFIM | 多项式表示平均梯度和高斯滤波参数方差间关系 | |||
| BAGDC | 自适应梯度、细节注入校正约束联合的变分优化 | |||
| AHFF | 多级高通滤波获取注入细节,结构相似度和均方根误差联合计算细节注入权重 | 视觉效果较好 | 边缘细节不足 | 植被为主 |
| LVMI-SFIM | 局部方差互信息的高斯滤波空间尺度对齐,梯度一致性约束细节注入系数 | 视觉效果较好 | 客观指标EN较好、SCC不高 | 植被为主 混合场景 |
表8 IKONOS混合区低分辨率全色与多光谱图像的空间相关系数SCCTab. 8 SCC for low resolution panchromatic and multispectral images in IKONOS mixed region |
| 低通滤波方法 | 多光谱图像 | |||
|---|---|---|---|---|
| 波段1 | 波段2 | 波段3 | 波段4 | |
| 3×3 均值滤波 | 0.921 0 | 0.883 7 | 0.834 6 | 0.822 4 |
| MTF 高斯滤波 | 0.931 2 | 0.951 4 | 0.921 2 | 0.886 7 |
| 梯度一致性 高斯滤波 | 0.019 4 | 0.013 4 | 0.013 0 | 0.016 5 |
| 方差互信息 高斯滤波 | 0.962 9 | 0.952 1 | 0.940 4 | 0.927 4 |
表9 QuickBird混合区低分辨率全色与多光谱图像的空间相关系数SCCTab. 9 SCC for low resolution panchromatic and multispectral images in QuickBird mixed region |
| 低通滤波方法 | 多光谱图像 | |||
|---|---|---|---|---|
| 波段1 | 波段2 | 波段3 | 波段4 | |
| 均值滤波 3×3 | 0.753 4 | 0.782 9 | 0.549 6 | 0.637 7 |
| MTF 高斯滤波 | 0.789 2 | 0.845 7 | 0.805 6 | 0.835 1 |
| 梯度一致性 高斯滤波 | -0.037 3 | 0.076 9 | -0.102 8 | -0.120 2 |
| 方差互信息 高斯滤波 | 0.925 6 | 0.895 4 | 0.801 8 | 0.834 3 |
| [1] |
李树涛, 李聪妤, 康旭东. 多源遥感图像融合发展现状与未来展望[J]. 遥感学报, 2021, 25(1):148-166.
[
|
| [2] |
|
| [3] |
|
| [4] |
|
| [5] |
|
| [6] |
|
| [7] |
|
| [8] |
刘红毅, 赵肖飞, 韩海波, 等. 基于光谱映射和细节注入的Pansharpening[J]. 电子学报, 2023, 51(6):1527-1540.
[
|
| [9] |
|
| [10] |
张兵, 高连如, 李嘉鑫, 等. 高/多光谱遥感图像超分辨率融合研究进展与展望[J]. 测绘学报, 2023, 52(7):1074-1089.
[
|
| [11] |
唐霖峰, 张浩, 徐涵, 等. 基于深度学习的图像融合方法综述[J]. 中国图象图形学报, 2023, 28(1):3-36.
[
|
| [12] |
邓良剑, 冉燃, 吴潇, 等. 遥感图像全色锐化的卷积神经网络方法研究进展[J]. 中国图象图形学报, 2023, 28(1):57-79.
[
|
| [13] |
杨勇, 苏昭, 黄淑英, 等. 基于深度学习的像素级全色图像锐化研究综述[J]. 遥感学报, 2022, 26(12):2411-2432.
[
|
| [14] |
杨景辉. 遥感影像像素级融合通用模型及其并行计算方法[J]. 测绘学报, 2015, 44(8):943.
[
|
| [15] |
|
| [16] |
|
| [17] |
方帅, 潮蕾, 曹风云. 自适应权重注入机制遥感图像融合[J]. 中国图象图形学报, 2020, 25(3):546-557.
[
|
| [18] |
|
| [19] |
韩冰, 赵银娣. 一种改进的SFIM高光谱图像融合算法[J]. 遥感信息, 2012, 27(5):44-47,54.
[
|
| [20] |
王密, 何鲁晓, 程宇峰, 等. 自适应高斯滤波与SFIM模型相结合的全色多光谱影像融合方法[J]. 测绘学报, 2018, 47(1):82-90.
[
|
| [21] |
|
| [22] |
杨勇, 卢航远, 黄淑英, 等. 基于自适应注入模型的遥感图像融合方法[J]. 北京航空航天大学学报, 2019, 45(12):2351-2363.
[
|
| [23] |
董宏平, 刘利雄. 互信息域中的无参考图像质量评价[J]. 中国图象图形学报, 2014, 19(3):484-492.
[
|
| [24] |
|
| [25] |
|
| [26] |
|
| [27] |
|
| [28] |
|
| [29] |
|
| [30] |
|
| [31] |
|
| [32] |
|
| [33] |
|
/
| 〈 |
|
〉 |