
Journal of Geo-information Science >
Application of the Deformed Thiessen Polygon in the Analysis of Layout Influence Factors for Rural Express Delivery Points
Received date: 2023-12-05
Revised date: 2024-06-07
Online published: 2024-09-10
Supported by
National Natural Science Foundation of China(42071224)
Later-stage Project of National Social Science Foundation of China(21FSHB014)
Humanities and Social Science Foundation of the Ministry of Education of China(20YJCZH069)
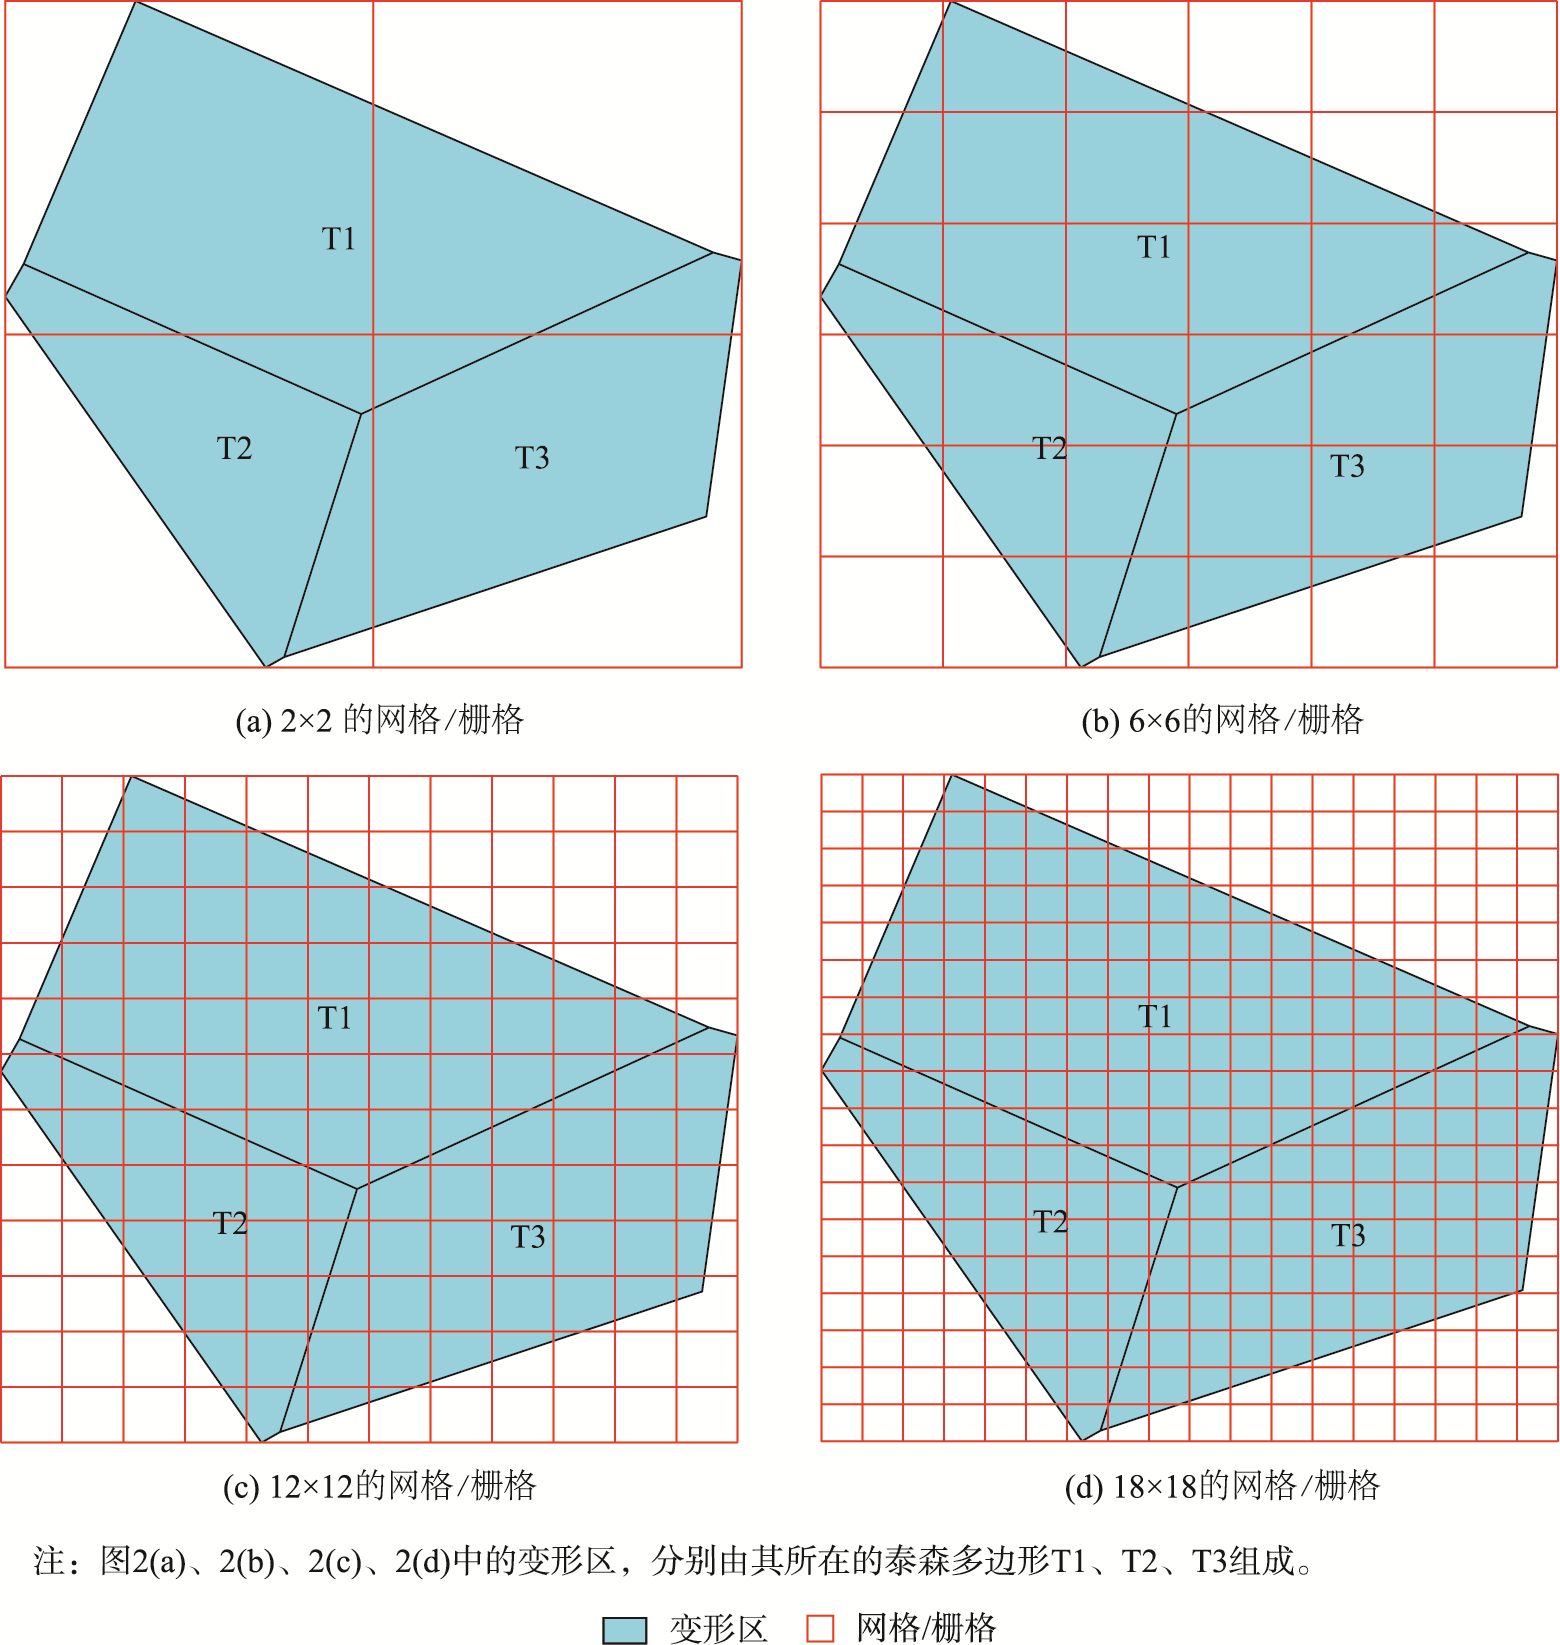
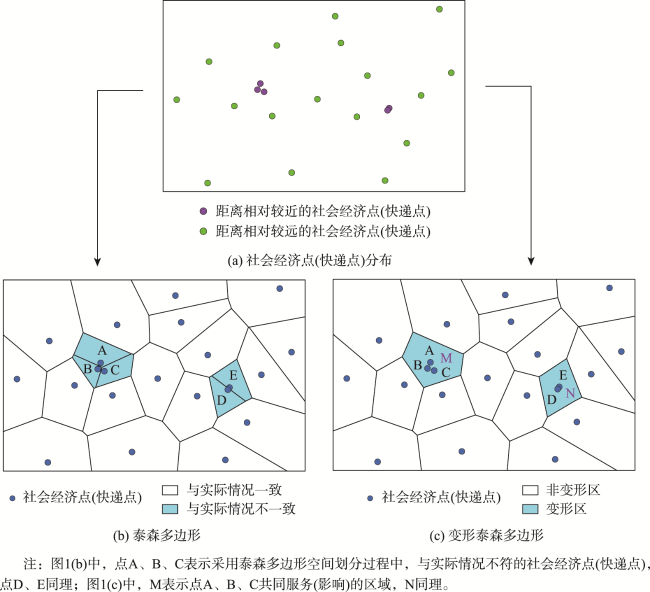
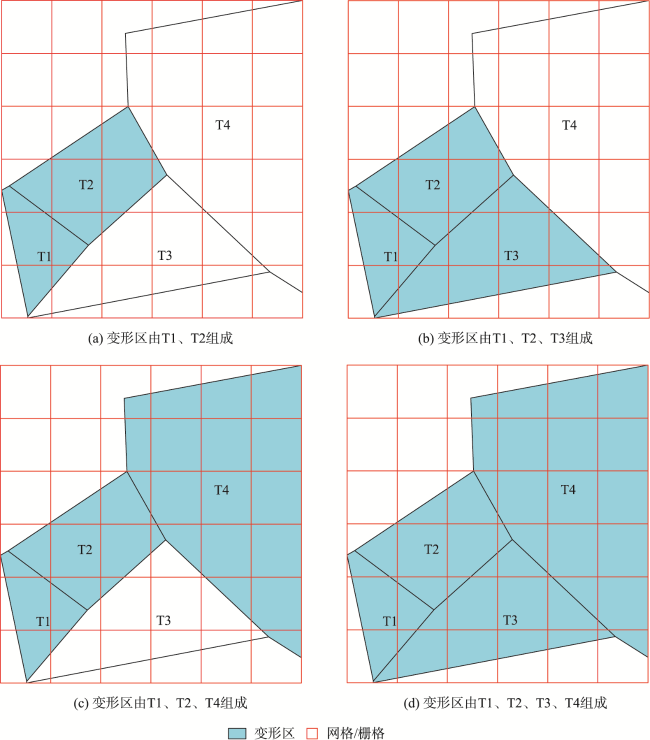
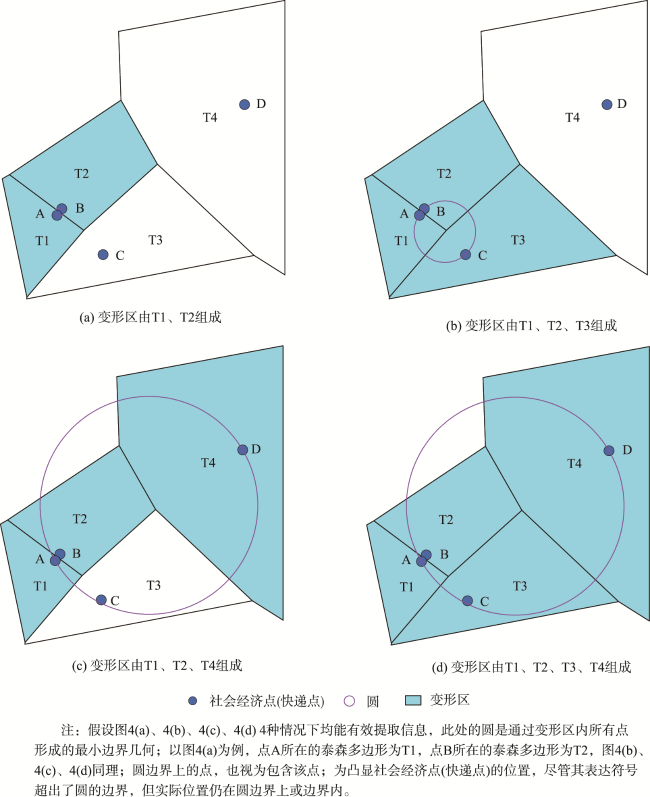
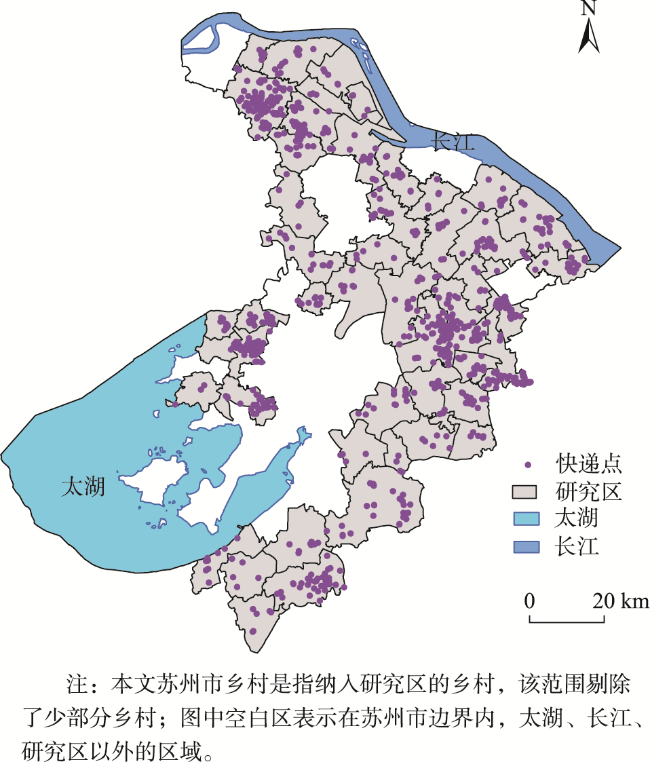
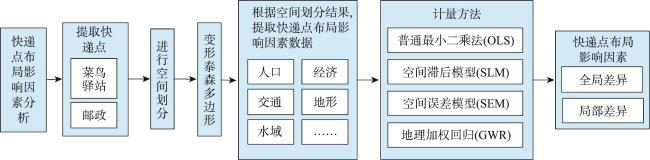
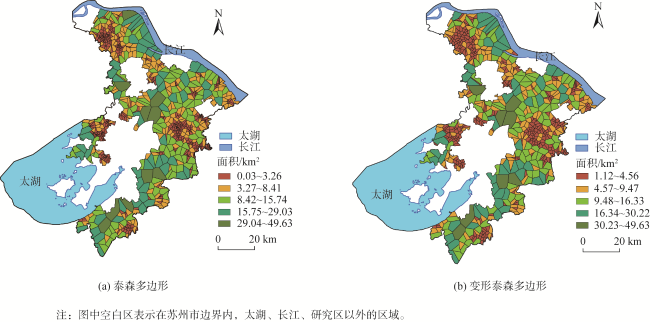
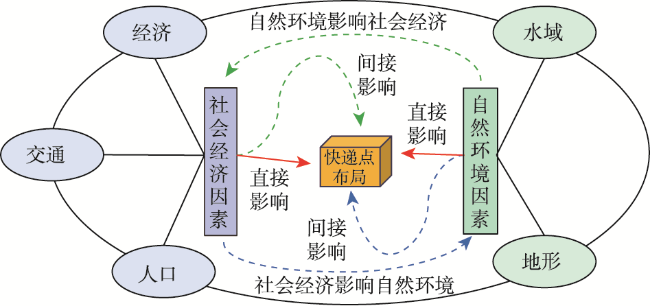
In the context of rural revitalization, it is important to explore the layout influence factors of rural express delivery points for rural infrastructure construction. In this paper, we propose the Deformed Thiessen Polygon theory based on the current development status of the Thiessen Polygon theory and the needs for the socio-economic application research. Using the Deformed Thiessen Polygon, this study considers the rural area in Suzhou City, Jiangsu Province (its meaning is explained in the main text) as the study area, with the express delivery points as the specific case. Methods such as Ordinary Least Squares (OLS), Spatial Lag Model (SLM), Spatial Error Model (SEM), and Geographically Weighted Regression (GWR) were used to reveal the layout influence factors of rural express delivery points. The main conclusions drawn from this paper are as follows. (1) The Deformed Thiessen Polygon is an improvement and expansion of the Thiessen Polygon for socio-economic applications. It consists of two parts: the deformation area and the non-deformation area. The deformation area represents a local deformation of the Thiessen Polygon, while the non-deformation area retains the original Thiessen Polygon. The Deformed Thiessen Polygon can effectively solve the mismatch problem between the spatial division of the Thiessen Polygon and actual situations, improving the feasibility and scientificity of social and economic research. (2) Using the service scope as a characterization indicator of express delivery point layout, with this indicator as the dependent variable and population size, economic size, road network density, etc., as independent variables, we explored the layout influence factors of express delivery points in the study area. When the probability is less than 0.05, the OLS and SLM results show that population size, average slope, and water area are positive influence factors, with population size being the dominant positive influence factor; Economic size is a negative influence factor. The GWR results show that population size and water area have positive spatial effects, while economic size has a negative spatial effect. There are both positive and negative spatial effects on the road network density and average slope. Based on the analysis presented throughout this paper, the main considerations for the development of the rural express delivery industry are as follows. (1) Give full play to the basic guarantee role of public express delivery points. (2) Emphasize the decisive role of population and economic factors. (3) Guide the comprehensive layout for express delivery points. (4) Create relatively equal rural express delivery services. The Deformed Thiessen Polygon helps to advance the development of the Thiessen Polygon, providing a new basis for spatial division in future studies of socio-economic applications. At the same time, the results of this paper have value for understanding the layout influence factors for rural express delivery points and for implementing rural revitalization strategies.
CHENG Dongya , ZHANG Xiaolin , LI Hongbo . Application of the Deformed Thiessen Polygon in the Analysis of Layout Influence Factors for Rural Express Delivery Points[J]. Journal of Geo-information Science, 2024 , 26(9) : 2140 -2160 . DOI: 10.12082/dqxxkx.2024.230727
表1 变形泰森多边形的主要特征Tab. 1 Main features of the Deformed Thiessen Polygon |
| 主要特征 | 属性 | 变形区 | 非变形区 | 主要特征归纳 |
|---|---|---|---|---|
| 1 | 分区 | 泰森多边形局部变形而来 | 原始的泰森多边形 | 存在2个分区 |
| 2 | 点数量 | 单个多边形内,点数量有两个或以上 | 单个多边形内,点数量仅有一个 | 单个多边形内,点数量具有差异 |
| 3 | 适用性 | 社会经济点距离很近,且各点实际服务(影响)边界相对模糊时,变形区能够科学准确地说明该特征 | 社会经济点距离较大,且各点服务(影响)边界相对明显时,非变形区能够科学准确地说明该特征 | 适用于社会经济点空间划分研究 |
表2 快递点布局影响因素的数据来源与指标说明Tab. 2 Data sources and indicator description of layout influence factors for express delivery points |
| 数据名称 | 来源说明 | 提取的 具体指标 | 指标单位 | 指标 编码 | 标准化后的指标编码 | 指标用途 |
|---|---|---|---|---|---|---|
| 快递点变形泰森多边形数据 | 以变形泰森多边形理论为基础,提取若干个快递点所服务的范围,即单个变形泰森多边形的面积 | 服务范围 | km2 | Y | ZY | 反映快递点布局特征 |
| 人口数据 | 来源于中国人口空间分布公里网格数据集[28],该数据来源于资源环境科学数据注册与出版系统[资源环境科学数据平台(https://www.resdc.cn/)],数据分辨率为 1 km,时间为2019年 | 人口规模 | 人 | RK | ZRK | 反映人口因素对快递点布局的影响 |
| 经济数据 | 来源于中国GDP空间分布公里网格数据集[29],该数据来源于资源环境科学数据注册与出版系统[资源环境科学数据平台(https://www.resdc.cn/)],数据分辨率为 1 km,时间为2019年 | 经济规模 | 元 | JJ | ZJJ | 反映经济因素对快递点布局的影响 |
| 道路数据 | 来源于全国地理信息资源目录服务系统(https://mulu.tianditu.gov.cn/main.do?method=index),本文路网密度是公路的路网密度 | 路网密度 | m/km2 | JT | ZJT | 反映交通因素对快递点布局的影响 |
| 坡度数据 | 通过DEM(Digital Elevation Model,DEM)数据计算得出,DEM数据来源于中国科学院计算机网络信息中心地理空间数据云(https://www.gscloud.cn/),分辨率为90 m | 平均坡度 | o | DX | ZDX | 反映地形因素对快递点布局的影响 |
| 水域数据 | 来源于全国地理信息资源目录服务系统(https://mulu.tianditu.gov.cn/main.do?method=index),本文水域面积 基于面SHP格式水系数据提取 | 水域面积 | m2 | SY | ZSY | 反映水域因素对快递点布局的影响 |
注:由于具体指标进行了编码处理,后文中经济规模与ZJJ可以认为一致,其他指标同理。 |
表3 本文涉及的主要计量方法Tab. 3 The main measurement methods covered in this article |
| 方法 | 简要表达形式 | 公式和变量说明 | 公式编号 |
|---|---|---|---|
| 普通最小二乘法(OLS)[30-31] | x为自变量,y为因变量,q0为常数,qi为系数值,ε是随机误差。文献[30]和[31]中基本表达式有所差异,本文结合两个文献[30-31]简化表达式 | (33)[30-31] | |
| 空间滞后模型(SLM)[31-32] | x为自变量,y为因变量,q0为空间系数值,w空间矩阵;qi反映自变量对因变量的影响,ε是随机误差 | (34)[31-32] | |
| 空间误差模型(SEM)[31-32] | x为自变量,y为因变量,qi反映自变量对因变量的影响,w空间矩阵,λ表示误差系数,u表示随机误差向量,ε是随机误差 | (35)[31-32] | |
| 地理加权回归(GWR)[30,35] | xi为自变量,yi为因变量,(mi, ni)为某个点的中心坐标,qi(mi, ni)为i处的值,εi是随机误差,k为样本量 | (36)[30,35] |
注:“方法”和“编号”栏目中的引用标注,表示本行参考(引用)的文献。 |
表4 苏州市乡村快递点布局影响因素的普通最小二乘法(OLS)、空间滞后模型(SLM)、空间误差模型(SEM)的莫兰指数和R2检验Tab. 4 Moran's index and R-squared of ordinary least squares, spatial lag model and spatial error model of layout influence factors of rural express delivery points in Suzhou city |
| 莫兰指数 | R2 | Adjusted R2 | |
|---|---|---|---|
| 普通最小二乘法(OLS) | — | 0.89 | 0.89 |
| 空间滞后模型(SLM) | 0.46 | 0.90 | — |
| 空间误差模型(SEM) | 0.46 | 0.92 | — |
注:本文空间自相关分析采用莫兰指数测度,莫兰指数采用GeoDa软件计算得出,其适用于SLM、SEM、GWR的前提性检验,不属于回归模型计算结果;自变量为ZRK、ZJJ、ZJT、ZDX、ZSY,因变量为ZY。 |
表5 苏州市乡村快递点布局影响因素的普通最小二乘法(OLS)、空间滞后模型(SLM)、空间误差模型(SEM)结果Tab. 5 Results of ordinary least squares, spatial lag model and spatial error model of layout influence factors of rural express delivery points in Suzhou city |
| 模型 | 属性 | ZRK | ZJJ | ZJT | ZDX | ZSY |
|---|---|---|---|---|---|---|
| 普通最小二乘法 (OLS) | Coefficient | 1.60 | -0.84 | -0.03 | 0.04 | 0.17 |
| Std. Error | 0.05 | 0.05 | 0.01 | 0.01 | 0.02 | |
| t-Statistic | 33.80 | -18.51 | -1.85 | 2.73 | 10.58 | |
| Probability | 0.00 | 0.00 | 0.07 | 0.01 | 0.00 | |
| 空间滞后模型 (SLM) | Coefficient | 1.46 | -0.74 | -0.02 | 0.04 | 0.15 |
| Std. Error | 0.05 | 0.04 | 0.01 | 0.01 | 0.01 | |
| z-value | 31.63 | -17.36 | -1.90 | 2.93 | 9.78 | |
| Probability | 0.00 | 0.00 | 0.06 | 0.00 | 0.00 | |
| 空间误差模型 (SEM) | Coefficient | 1.48 | -0.73 | -0.01 | 0.02 | 0.16 |
| Std. Error | 0.05 | 0.05 | 0.01 | 0.01 | 0.02 | |
| z-value | 28.88 | -14.66 | -1.03 | 1.21 | 10.33 | |
| Probability | 0.00 | 0.00 | 0.30 | 0.23 | 0.00 |
注:自变量为ZRK、ZJJ、ZJT、ZDX、ZSY,因变量为ZY。 |
表6 苏州市乡村快递点布局影响因素的地理加权回归(GWR)参数检验Tab. 6 Simulation parameter test of geographically weighted regression on layout influence factors of rural express delivery points in Suzhou City |
| Bandwidth | Residual Squares | Effective Number | Sigma | AICc | R2 | R2 Adjusted |
|---|---|---|---|---|---|---|
| 25 206.35 | 46.22 | 32.24 | 0.28 | 202.02 | 0.93 | 0.92 |
注:自变量为ZRK、ZJJ、ZJT、ZDX、ZSY,因变量为ZY。 |
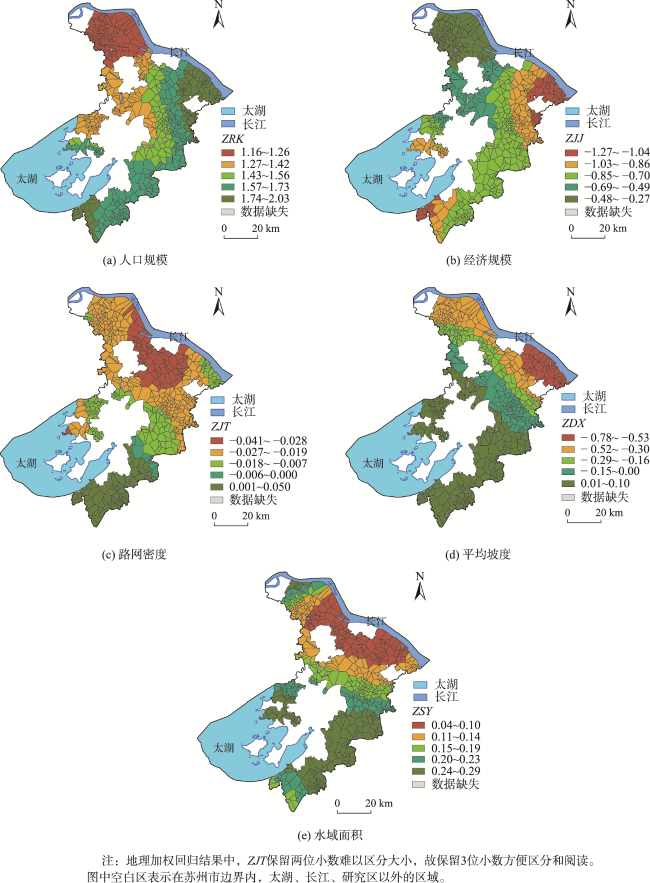
表7 苏州市乡村快递点布局影响因素的地理加权回归(GWR)回归系数统计特征Tab. 7 Statistical characteristics of geographically weighted regression regression coefficient on layout influence factors of rural express delivery points in Suzhou City |
| 属性 | ZRK | ZJJ | ZJT | ZDX | ZSY |
|---|---|---|---|---|---|
| 最大值 | 2.03 | -0.27 | 0.05 | 0.10 | 0.29 |
| 最小值 | 1.16 | -1.27 | -0.04 | -0.78 | 0.04 |
| 极差 | 0.87 | 1.00 | 0.09 | 0.88 | 0.24 |
| 空间回归系数极差大小排序 | 3 | 1 | 5 | 2 | 4 |
注:由于四舍五入的原因,数据会出现加减运算后不相等的情况。 |
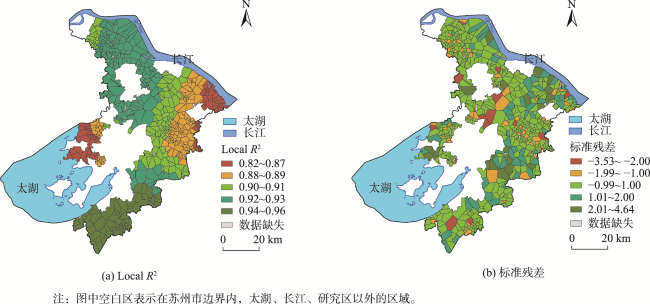
图9 苏州市乡村快递点布局影响因素的地理加权回归(GWR)局部R2和标准残差Fig. 9 Local R2 and standard residual analysis of geographically weighted regression on layout influence factors of rural express delivery points in Suzhou City |
| [1] |
中共中央, 国务院. 中共中央国务院关于做好二〇二三年全面推进乡村振兴重点工作的意见[J]. 中华人民共和国国务院公报, 2023(6):4-10.
[The Central Committee of the CPC, The State Council. Opinions of the Central Committee of the CPC and the State Council on fulfilling the key work of comprehensively promoting rural revitalization in 2023[J]. Gazette of the State Council of the People's Republic of China, 2023(6):4-10.]
|
| [2] |
国务院办公厅. 国务院办公厅关于加快农村寄递物流体系建设的意见[J]. 中华人民共和国国务院公报, 2021(25):16-18.
[The General Office of the State Council. Opinions of the General Office of the State Council on accelerating the development of rural delivery and logistics systems[J]. Gazette of the State Council of the People's Republic of China, 2021(25):16-18.]
|
| [3] |
国家邮政局办公室等七部门办公厅(室). 国家邮政局办公室等七部门办公厅(室)关于印发《农村寄递物流体系建设三年行动方案(2023—2025年)》的通知[国邮办发[2023]29号][Z]. 北京: 国家邮政局办公室等七部门办公厅(室), 2023.
[Office of State Post Bureau, et al: Notice on issuing a three-year action plan for the construction of a rural postal logistics system in 2023-2025 (NO.[2023]29 published by Office of State Post Bureau)[Z]. Beijing: Office of State Post Bureau, et al, 2023.
|
| [4] |
刘玲, 李钢, 杨兰, 等. 深圳市快递自提点的空间分布特征与影响因素[J]. 地球信息科学学报, 2019, 21(8):1240-1253.
[
|
| [5] |
冀琴, 朱敏, 刘睿. 重庆市中心城区快递自提点空间格局及影响因素研究——基于POI数据[J]. 重庆师范大学学报(自然科学版), 2021, 38(3):121-128.
[
|
| [6] |
高延辉, 王宝义. 基于地理信息数据的青岛市快递自提点布局规律与影响因素[J]. 山东交通学院学报, 2023, 31(3):29-39.
[
|
| [7] |
唐建荣, 郑楠. 基于POI大数据的快递末端网点空间分异及影响因素研究[J]. 资源开发与市场, 2023, 39(6):706-717.
[
|
| [8] |
夏文亮, 朱勤东, 刘敏, 等. 微观尺度下城市快递网点空间格局及影响因素——以成都市中心城区为例[J]. 测绘与空间地理信息, 2023, 46(3):42-46.
[
|
| [9] |
王欢, 吴相利. 哈尔滨市快递自提点空间布局与影响因素研究[J]. 边疆经济与文化, 2021(4):7-12.
[
|
| [10] |
李俊, 王仲智, 孟浩, 等. 淮海经济区快递网点空间格局及影响因素研究[J]. 现代城市研究, 2020(6):2-7.
[
|
| [11] |
吴晓, 王凌瑾, 宁昱西, 等. 南京市快递企业网点布局及其影响因素解析——基于民营企业(顺丰速递)和国营企业(EMS)的比较[J]. 地域研究与开发, 2019, 38(4):52-59,67.
[
|
| [12] |
雷蕾, 吴洁, 吴高海. 乡村振兴背景下乡镇快递取件二次收费的困境与应对策略研究[J]. 邮政研究, 2022, 38(1):14-18.
[
|
| [13] |
陆秋羽. 乡村振兴背景下快递进村的网点布局规划研究[D]. 镇江: 江苏大学, 2022.
[
|
| [14] |
甘泉. 乡村快递的网络布局优化[J]. 济宁学院学报, 2020, 41(4):75-79.
[
|
| [15] |
甘泉. 安徽省乡村快递业的网络布局研究——以肥西县为例[J]. 重庆科技学院学报(社会科学版), 2020(5):48-51.
[
|
| [16] |
刘鹏. 县域乡村快递业网点选址问题研究[D]. 西安: 长安大学, 2016.
[
|
| [17] |
李少华, 刘远刚, 王延忠. 泰森多边形在地质数据去丛聚中的应用[J]. 物探与化探, 2011, 35(4):562-564.
[
|
| [18] |
谢远扬, 王森. 泰森多边形在分析西安市PM2.5污染状况中的应用[J]. 环境科学与技术, 2017, 40(7):22-27.
[
|
| [19] |
陈晓杰, 张金亭, 张长城, 等. 基于泰森多边形的南京市PM2.5时空特征及其与土地利用的相关性研究[J]. 水土保持通报, 2018, 38(1):293-298.
[
|
| [20] |
谢绍锋, 肖化顺, 储蓉, 等. 基于泰森多边形的广州市林火空间分布规律研究[J]. 西北林学院学报, 2018, 33(3):178-185.
[
|
| [21] |
谢绍锋, 欧阳君祥, 肖化顺. 基于泰森多边形与条件熵的林火易发性空间分布研究[J]. 林业资源管理, 2017(4):50-58.
[
|
| [22] |
陈天驰. 基于泰森多边形的建筑表皮优化设计——以杭州运河大剧院为例[J]. 浙江建筑, 2022, 39(4):6-8.
[
|
| [23] |
李泰, 姚敏峰. 自然分形——论Voronoi泰森多边形在建筑设计中的应用[J]. 中外建筑, 2017(7):139-144.
[
|
| [24] |
宋洁华, 李少伟, 赵志忠, 等. 泰森多边形在居民点空间分布特征分析中的应用研究——以海南省临高县为例[J]. 海南师范大学学报(自然科学版), 2013, 26(2):223-226.
[
|
| [25] |
葛奔, 蔡琳, 王富. 基于泰森多边形服务分区的常规公交站点布局优化[J]. 武汉工程大学学报, 2018, 40(6):668-672.
[
|
| [26] |
章扬. 基于泰森多边形的农村基本公共服务设施空间布局优化研究——以淄博市凤凰镇为例[D]. 济南: 山东建筑大学, 2021.
[
|
| [27] |
苏州市统计局, 国家统计局苏州调查队. 2022年苏州市国民经济和社会发展统计公报[R]. 苏州: 苏州市统计局,国家统计局苏州调查队, 2023.
[Statistics Bureau of Suzhou City, Suzhou Survey Team of National Bureau of Statistics. Statistical bulletin on economic and social development of Suzhou City in 2022[R]. Suzhou: Statistics Bureau of Suzhou City, Suzhou Survey Team of National Bureau of Statistics, 2023.]
|
| [28] |
徐新良. 中国人口空间分布公里网格数据集[Z]. 资源环境科学数据注册与出版系统(http://www.resdc.cn/DOI), 2017.
[
|
| [29] |
徐新良. 中国GDP空间分布公里网格数据集[Z]. 资源环境科学数据注册与出版系统(http://www.resdc.cn/DOI), 2017.
[
|
| [30] |
汤庆园, 徐伟, 艾福利. 基于地理加权回归的上海市房价空间分异及其影响因子研究[J]. 经济地理, 2012, 32(2):52-58.
[
|
| [31] |
唐锦玥, 何益珺, 塔娜. 基于POI数据的上海市餐饮业空间分布特征及影响因素[J]. 热带地理, 2020, 40(6):1015-1025.
[
|
| [32] |
肖雅文, 李仙德. 2010—2020年长三角常住人口空间格局演变及影响因素研究[J]. 上海师范大学学报(自然科学版), 2023, 52(4):495-506.
[
|
| [33] |
程叶青, 王哲野, 张守志, 等. 中国能源消费碳排放强度及其影响因素的空间计量[J]. 地理学报, 2013, 68(10):1418-1431.
[
|
| [34] |
戴丽, 尹昌应, 毛春艳, 等. 喀斯特山地城市景观格局对城市内涝的影响研究——以贵阳市为例[J]. 贵州师范大学学报(自然科学版), 2024, 42(2):53-61.
[
|
| [35] |
程东亚, 李旭东. 贵州乌江流域气温与降水空间分布特征及其地形影响分析[J]. 水土保持研究, 2020, 27(2):246-252.
[
|
| [36] |
张明龙, 周剑勇, 刘娜. 杜能农业区位论研究[J]. 浙江师范大学学报(社会科学版), 2014, 39(5):95-100.
[
|
| [37] |
姚付龙. 韦伯工业区位论在建设虚拟型生态工业园中的应用研究——以伊宁市边境经济合作区为例[J]. 伊犁师范学院学报(自然科学版), 2012(2):59-64.
[
|
| [38] |
陈殷, 李金勇. 生产性服务业区位模式及影响机制研究[J]. 上海经济研究, 2004(7):52-57.
[
|
| [39] |
张文忠. 大城市服务业区位理论及其实证研究[J]. 地理研究, 1999, 18(3):273-281.
[
|
| [40] |
方远平, 闫小培. 服务业区位论:概念、理论及研究框架[J]. 人文地理, 2008(5):12-16.
[
|
/
| 〈 |
|
〉 |
