
Journal of Geo-information Science >
Exploring Urban Renewal Consumption: A Rapid Estimation Method for Annual Urban Construction Waste Production Based on High-Resolution Remote Sensing Images
Received date: 2024-04-11
Revised date: 2024-06-27
Online published: 2024-09-10
Supported by
National Key Research and Development Program of China(2020YFF0305401)
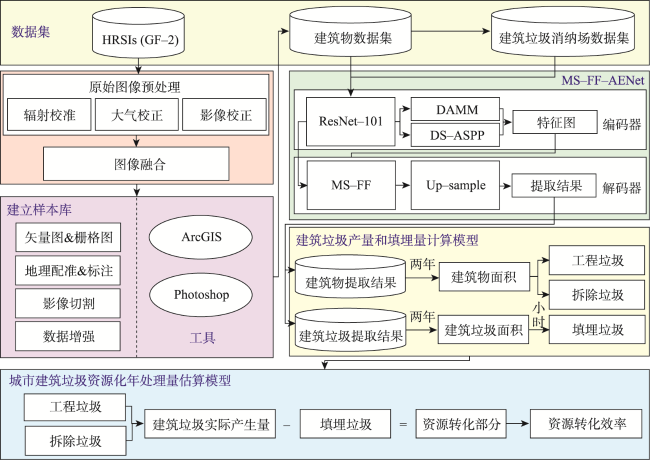
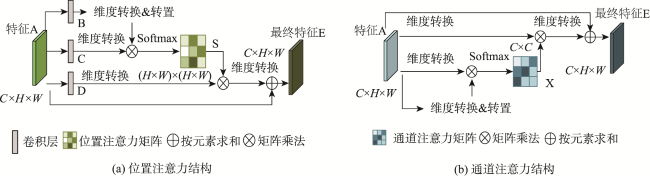
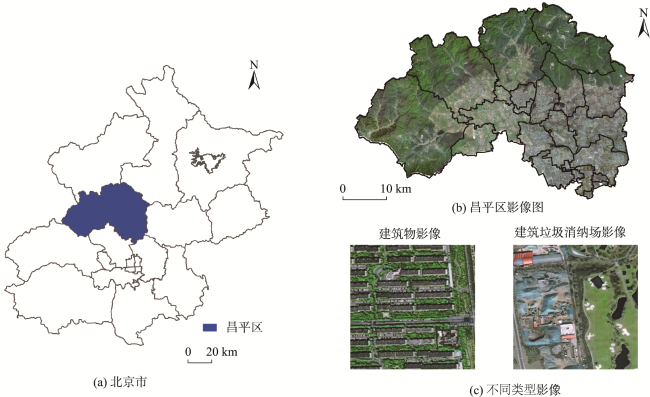
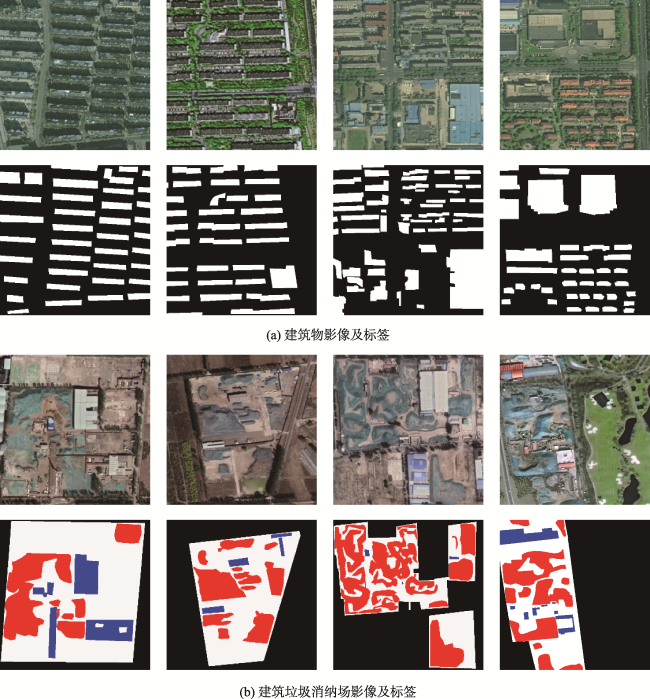
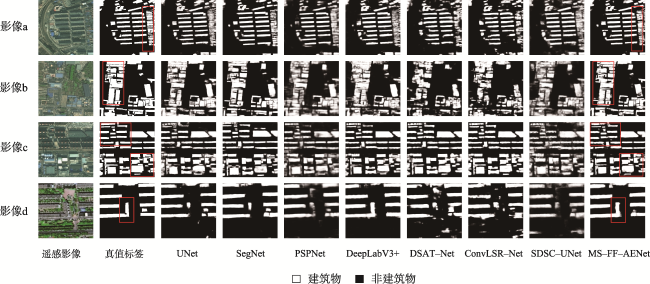
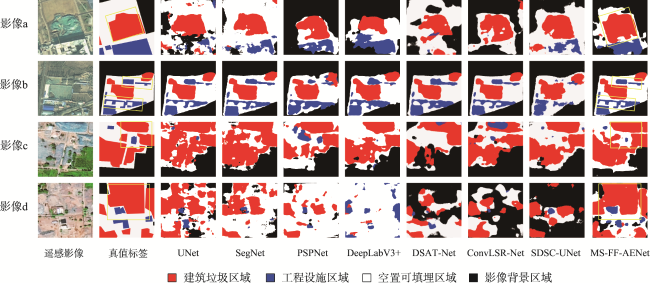
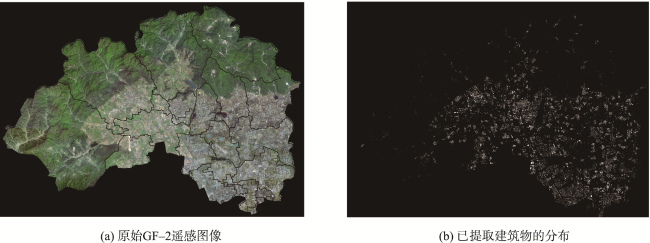
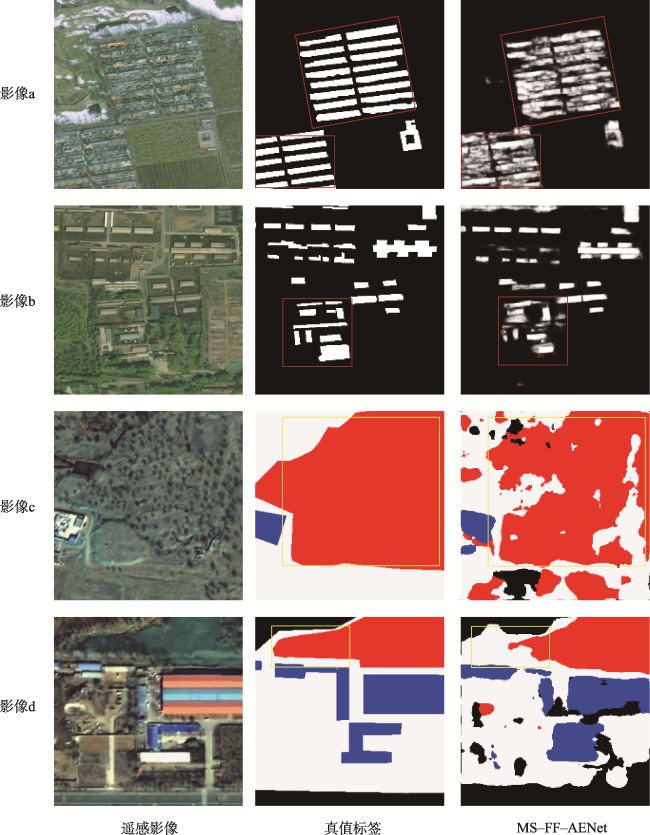
Construction waste is an inevitable byproduct of urban renewal processes, causing serious environmental pollution and ecological pressure. Precisely quantifying the annual production of urban construction waste and the resource conversion rate is crucial for assessing the cost of urban renewal. Traditional manual methods of estimating construction waste production rely heavily on statistical data and historical experience, which are inflexible, time-consuming, and labor-intensive in practical application, and need improvement in terms of accuracy and timeliness. Existing deep learning models have relatively poor capabilities in extracting and integrating small targets and multi-scale features, making it difficult to handle irregular shapes and fragmented detection areas. This paper proposes a Multi-Scale Feature Fusion and Attention-Enhanced Network (MS-FF-AENet) based on High-resolution Remote Sensing Images (HRSIs) to dynamically track and detect changes in buildings and construction waste disposal sites. This paper introduces a novel encoder-decoder structure, utilizing ResNet-101 to extract deeper features to enhance classification accuracy and effectively mitigate the gradient vanishing problem caused by increasing the depth of convolutional neural networks. The Depthwise Separable-Atrous Spatial Pyramid Pooling (DS-ASPP) with different dilation rates is constructed to address insufficient receptive fields, resolving the issue of discontinuous holes when extracting large targets. The Dual Attention Mechanism Module (DAMM) is employed to better preserve spatial details, enriching feature extraction. In the decoder, Multi-Scale Feature Fusion (MS-FF) is utilized to capture contextual information, integrating shallow and intermediate features of the backbone network, thereby enhancing extraction capabilities in complex scenes. MS-FF-AENet is employed to extract and analyze changes in building areas at different time periods, calculating the engineering waste from new constructions and demolition waste from demolished buildings, thereby obtaining the annual production of urban construction waste. Furthermore, MS-FF-AENet is utilized to extract construction waste disposal sites at different time periods, estimating the amount of construction waste landfill based on changes in landfill waste, indirectly assessing the resource conversion rate of urban construction waste. Based on HRSIs of Changping District, Beijing from 2019 to 2020, experimental results demonstrate: (1) Among a series of baseline models including UNet, SegNet, PSPNet, DeepLabV3+, DSAT-Net、ConvLSR-Net and SDSC-UNet, MS-FF-AENet exhibits advantages in terms of precision and efficiency in extracting buildings and construction waste; (2) During the period from 2019 to 2020, the annual production of construction waste in the study area due to urban renewal is approximately 4 101 156.5 tons, with approximately 2 251 855.872 tons being landfill waste and approximately 1 849, 300.628 tons being resource conversion waste, resulting in a construction waste resource conversion rate of 45.09%, further corroborating government statistical reports. This paper provides a convenient and effective analysis approach for accurate measurement of the cost of urban renewal.

HUANG Lei , LIN Shaofu , LIU Xiliang , WANG Shaohua , CHEN Guihong , MEI Qiang . Exploring Urban Renewal Consumption: A Rapid Estimation Method for Annual Urban Construction Waste Production Based on High-Resolution Remote Sensing Images[J]. Journal of Geo-information Science, 2024 , 26(9) : 2192 -2212 . DOI: 10.12082/dqxxkx.2024.240199
表1 垃圾填埋场施工的土层类型和相应高度Tab. 1 Types of layers and corresponding heights for landfill construction |
| 编号 | 分层类型 | 高度/cm |
|---|---|---|
| 1 | 植被层 | h1≈15 |
| 2 | 排水层 | h2≈30 |
| 3 | 防渗层 | h3≈30 |
| 4 | 支撑及排气层 | h4≈30 |
| 5 | 垃圾层 | 200≤h5<400 |
表2 建筑物和建筑垃圾提取混淆矩阵定义Tab. 2 Definition table for the confusion matrix for building and construction waste extraction |
| 真实结果 | 预测结果 | |
|---|---|---|
| 垃圾堆放区域 | 其他区域 | |
| 垃圾堆放区域 | TP | FN |
| 其他区域 | FP | TN |
| 真实结果 | 预测结果 | |
| 建筑物 | 非建筑物 | |
| 建筑物 | TP | FN |
| 非建筑物 | FP | TN |
表3 不同模型在北京市昌平区建筑物数据集的定量指标Tab. 3 Quantitative evaluation of different models on a dataset of buildings in Changping District, Beijing (%) |
| 方法 | 定量指标 | |||||
|---|---|---|---|---|---|---|
| Acc | Precision | Recall | F1 | IoU | BER | |
| UNet | 96.88 | 86.87 | 86.56 | 86.37 | 76.94 | 7.82 |
| SegNet | 97.12 | 88.39 | 86.60 | 87.15 | 78.64 | 7.57 |
| PSPNet | 95.02 | 80.61 | 74.53 | 76.66 | 63.66 | 14.13 |
| DeepLabV3+ | 96.42 | 83.78 | 86.22 | 84.57 | 74.26 | 8.27 |
| DSAT-Net | 95.69 | 84.46 | 81.48 | 82.29 | 72.54 | 10.36 |
| ConvLSR-Net | 95.95 | 85.80 | 82.54 | 83.41 | 74.38 | 9.76 |
| SDSC-UNet | 94.17 | 77.87 | 74.67 | 75.44 | 61.78 | 14.54 |
| MS-FF-AENet | 97.45 | 90.33 | 87.90 | 88.82 | 81.09 | 6.78 |
注:加粗数值表示每一列最优值。 |
表4 不同模型在建筑垃圾消纳场数据集上的定量指标Tab. 4 Quantitative evaluation of different models on construction waste disposal sites dataset (%) |
| 方法 | 指标 | |||||
|---|---|---|---|---|---|---|
| Acc | Precision | Recall | F1 | IoU | BER | |
| UNet | 92.92 | 87.67 | 89.92 | 88.16 | 82.54 | 6.16 |
| SegNet | 92.92 | 88.86 | 88.70 | 88.28 | 82.45 | 6.32 |
| PSPNet | 87.06 | 79.05 | 76.27 | 75.85 | 65.32 | 14.20 |
| DeepLabV3+ | 84.63 | 77.85 | 73.45 | 72.37 | 62.35 | 15.78 |
| DSAT-Net | 89.95 | 83.31 | 84.33 | 82.95 | 74.93 | 9.49 |
| ConvLSR-Net | 91.98 | 85.45 | 86.38 | 85.10 | 78.40 | 7.98 |
| SDSC-UNet | 87.33 | 76.27 | 77.07 | 75.38 | 64.02 | 13.75 |
| MS-FF-AENet | 94.77 | 90.43 | 90.96 | 89.40 | 83.35 | 5.46 |
注:加粗数值表示每一列最优值。 |
表5 建筑垃圾消纳场数据集上的消融实验结果Tab. 5 Results of ablation experiments on construction waste disposal sites dataset (%) |
| ResNet-101 | MS-FF | DAMM-S | DAMM-P | DS-ASPP | Precision | Recall | F1 | Model Size/M |
|---|---|---|---|---|---|---|---|---|
| √ | 88.26 | 89.06 | 88.42 | 178 | ||||
| √ | √ | 88.46 | 89.28 | 88.72 | 179 | |||
| √ | √ | √ | 89.03 | 90.29 | 88.90 | 199 | ||
| √ | √ | √ | 90.43 | 90.96 | 89.40 | 203 | ||
| √ | √ | √ | √ | 90.37 | 90.34 | 88.96 | 190 |
注: MS-FF 代表特征融合; DAMM-S代表DAMM与ASPP串联; DAMM-P代表DAMM与ASPP并联。加粗数值表示最优值。 |
表6 北京市昌平区建筑物数据集上的消融实验结果Tab. 6 Results of ablation experiments on building dataset in Changping District, Beijing (%) |
| ResNet-101 | MS-FF | DAMM-S | DAMM-P | DS-ASPP | Precision | Recall | F1 | Model Size/M |
|---|---|---|---|---|---|---|---|---|
| √ | 82.45 | 84.27 | 83.25 | 178 | ||||
| √ | √ | 86.87 | 84.83 | 85.45 | 179 | |||
| √ | √ | √ | 87.06 | 85.53 | 86.00 | 199 | ||
| √ | √ | √ | 90.33 | 87.90 | 88.82 | 203 | ||
| √ | √ | √ | √ | 87.20 | 85.63 | 86.12 | 190 |
注: MS-FF代表特征融合, DAMM-S代表DAMM与ASPP串联, DAMM-P代表DAMM与ASPP并联。 |
表7 不同方法的时间复杂度评估结果Tab. 7 Time complexity assessment results for different methods |
| 方法 | 变量 | |||
|---|---|---|---|---|
| 训练时间/s | 速度 | 浮点运算次数(G)/次 | 参数量/M | |
| UNet | 170.432 | 8.027 | 124.527 | 13.396 |
| SegNet | 160.204 | 8.539 | 160.977 | 29.445 |
| PSPNet | 801.980 | 1.706 | 201.851 | 52.508 |
| DeepLabV3+ | 182.739 | 7.486 | 83.429 | 54.709 |
| DSAT-Net | 194.040 | 7.050 | 57.675 | 48.371 |
| ConvLSR-Net | 219.071 | 6.245 | 70.832 | 68.037 |
| SDSC-UNet | 199.625 | 6.853 | 21.546 | 21.320 |
| MS-FF-AENet | 151.222 | 9.046 | 68.720 | 52.929 |
注:加粗数值表示最优值。 |
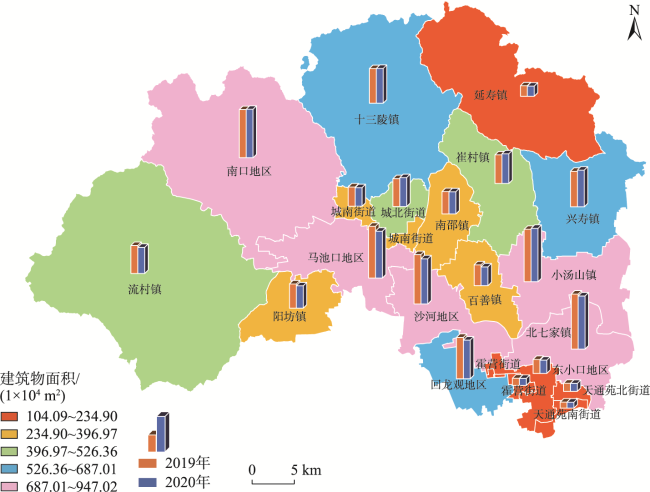
图9 北京市昌平区各行政区域建筑物面积变化情况Fig. 9 Change in the building area of each administrative area in Changping District, Beijing |
表8 北京市昌平区建筑物面积变化和建筑垃圾产量Tab. 8 Changes in building area and construction waste production in Changping District, Beijing |
| 行政区域 | 2019年 | 2020年 | 变化量 /(104 m²) | 工程垃圾 | 拆除垃圾 | |||
|---|---|---|---|---|---|---|---|---|
| 建筑物面积/(104 m²) | 至少/t | 至多/t | 至少/t | 至多/t | ||||
| 百善镇 | 369.644 | 333.440 | -36.204 | 289 631.744 | 470 651.584 | |||
| 北七家镇 | 976.173 | 942.694 | -33.479 | 267 835.904 | 435 233.344 | |||
| 城北街道 | 494.522 | 514.295 | 19.773 | 5 931.878 | 15 818.342 | |||
| 城南街道 | 341.938 | 330.765 | -11.174 | 89 383.424 | 145 248.064 | |||
| 崔村镇 | 508.425 | 526.358 | 17.933 | 5 379.917 | 14 346.445 | |||
| 东小口地区 | 247.839 | 234.896 | -12.943 | 103 542.272 | 168 256.192 | |||
| 回龙观地区 | 734.752 | 687.013 | -47.739 | 381 913.600 | 620 609.600 | |||
| 霍营街道 | 130.196 | 126.665 | -3.531 | 28 248.064 | 45 903.104 | |||
| 流村镇 | 496.992 | 463.736 | -33.257 | 266 053.632 | 432 337.152 | |||
| 马池口地区 | 918.954 | 831.378 | -87.576 | 700 609.536 | 1 138 490.496 | |||
| 南口地区 | 854.672 | 860.037 | 5.365 | 1 609.478 | 4 291.942 | |||
| 南邵镇 | 397.953 | 394.846 | -3.107 | 24 855.040 | 40 389.440 | |||
| 沙河地区 | 875.982 | 801.448 | -74.534 | 596 271.616 | 968 941.376 | |||
| 十三陵镇 | 614.671 | 617.267 | 2.596 | 778.906 | 2 077.082 | |||
| 天通苑北街道 | 144.077 | 142.330 | -1.746 | 13 971.456 | 22 703.616 | |||
| 天通苑南街道 | 105.562 | 104.087 | -1.475 | 11 797.504 | 19 170.944 | |||
| 小汤山镇 | 930.129 | 947.022 | 16.893 | 5 067.878 | 13 514.342 | |||
| 兴寿镇 | 630.362 | 650.856 | 20.493 | 6 147.994 | 16 394.650 | |||
| 延寿镇 | 186.360 | 180.279 | -6.081 | 48 649.728 | 79 055.808 | |||
| 阳坊镇 | 430.365 | 396.975 | -33.390 | 267 123.712 | 434 076.032 | |||
| 昌平区 | 10 389.570 | 10 086.387 | -303.182 | 24 916.051 | 66 442.803 | 3 089 887.232 | 5 021 066.752 | |
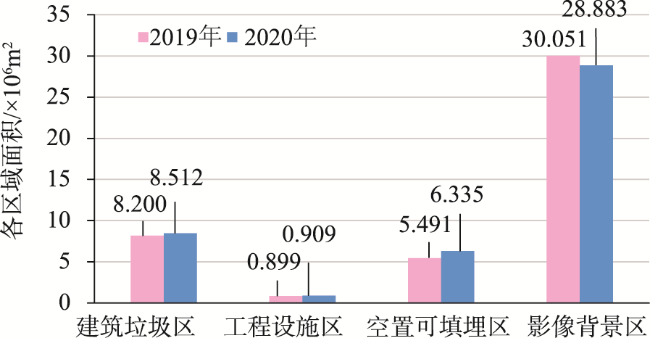
表9 北京市昌平区建筑垃圾消纳场提取结果Tab. 9 Extraction results of construction waste disposal sites in Changping District, Beijing (m2) |
| 区域 | 2019年 | 2020年 | 面积变化 |
|---|---|---|---|
| 建筑垃圾区域 | 8 199 598.08 | 8 512 355.84 | 312 757.76 |
| 工程设施区域 | 898 778.24 | 908 949.76 | 10 171.52 |
| 空置可填埋区域 | 5 490 789.12 | 6 335 324.80 | 844 535.68 |
| 影像背景区域 | 30 050 834.56 | 28 883 369.60 | -1 167 464.96 |
表10 建筑垃圾填埋量计算Tab. 10 Calculation of construction waste landfill volume |
| 参考数 | 2019年 | 2020年 |
|---|---|---|
| 红色像素点数/个 | 12 811 872 | 13 300 556 |
| 面积/m² | 8 199 598.08 | 8 512 355.84 |
| 体积/m³ | 32 798 392.32 | 34 049 423.36 |
| 重量/t | 59 037 106.176 | 61 288 962.048 |
| 填埋垃圾变化量/t | 2 251 855.872 | |
| [1] |
阳建强, 陈月. 1949—2019年中国城市更新的发展与回顾[J]. 城市规划, 2020, 44(2):9-19,31.
[
|
| [2] |
|
| [3] |
|
| [4] |
|
| [5] |
|
| [6] |
住房和城乡建设部关于发布行业标准《建筑垃圾处理技术标准》的公告[EB/OL]. [2023-12-15]. https://www.mohurd.gov.cn/gongkai/zhengce/zhengcefilelib/201910/20191012_242186.html.
|
| [7] |
|
| [8] |
|
| [9] |
国家统计局. 中华人民共和国2022年国民经济和社会发展统计公报告[EB/OL] [2023-12-25]. https://www.gov.cn/xinwen/2023-02/28/content_5743623.htm.
|
| [10] |
|
| [11] |
|
| [12] |
高建文, 管海燕, 彭代锋, 等. 基于局部-全局语义特征增强的遥感影像变化检测网络模型[J]. 地球信息科学学报, 2023, 25(3):625-637.
[
|
| [13] |
朱盼盼, 李帅朋, 张立强, 等. 基于多任务学习的高分辨率遥感影像建筑提取[J]. 地球信息科学学报, 2021, 23(3):514-523.
[
|
| [14] |
|
| [15] |
|
| [16] |
|
| [17] |
|
| [18] |
|
| [19] |
|
| [20] |
|
| [21] |
|
| [22] |
|
| [23] |
|
| [24] |
|
| [25] |
|
| [26] |
|
| [27] |
|
| [28] |
|
| [29] |
|
| [30] |
江宝得, 黄威, 许少芬, 等. 融合分散自适应注意力机制的多尺度遥感影像建筑物实例细化提取[J]. 测绘学报, 2023, 52(9):1504-1514.
[
|
| [31] |
王继成. 基于深度卷积神经网络的高分遥感影像高速铁路沿线建筑物信息提取[J]. 测绘学报, 2023, 52(6):1041.
[
|
| [32] |
冯霞, 秦昆, 崔卫红, 等. 高分辨率遥感影像目标形状特征多尺度描述与识别[J]. 遥感学报, 2014, 18(1):90-104.
[
|
| [33] |
|
| [34] |
|
| [35] |
刘洋, 康健, 管海燕, 等. 基于双注意力残差网络的高分遥感影像道路提取模型[J]. 地球信息科学学报, 2023, 25(2):396-408.
[
|
| [36] |
|
| [37] |
|
| [38] |
|
| [39] |
|
| [40] |
|
| [41] |
|
| [42] |
|
| [43] |
|
| [44] |
北京市政府工作报告全文发布[EB/OL]. [2023-12-19]. http://www.bjchp.gov.cn/cpqzf/315734/bmdt/cp566 5527/index.html.
|
/
| 〈 |
|
〉 |
