
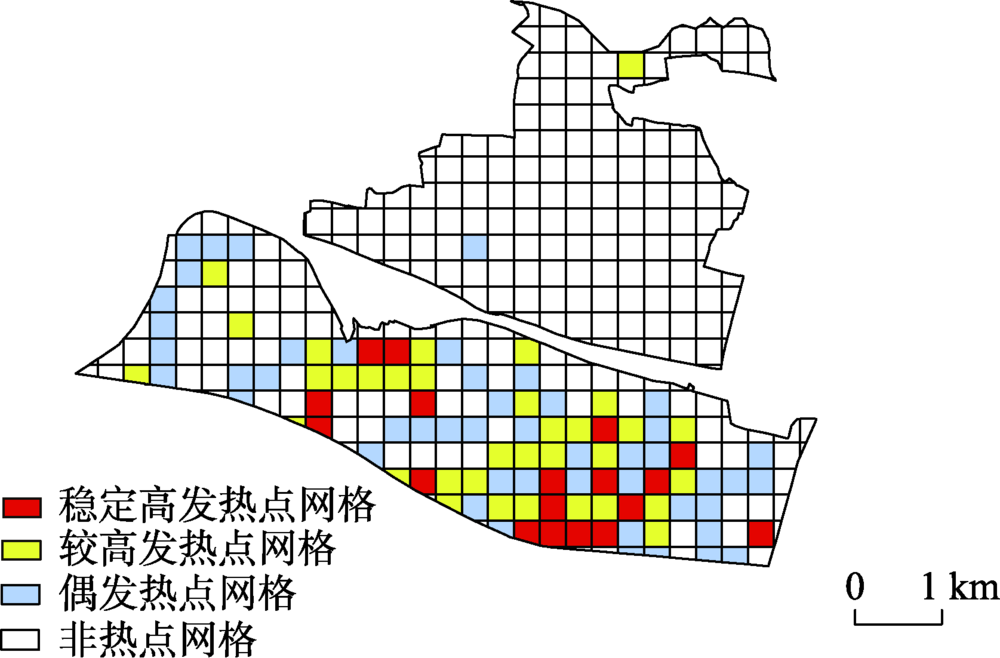
Machine learning is the mainstream method for crime hotspot prediction. As a popular machine learning algorithm, the random forest algorithm is widely used in the construction of crime hotspot prediction models because of its ability of handling sparse data, and reliable predictive capability and accuracy. A number of studies use multi-source data representing the geographical environment and built environment to train and construct crime hotspot prediction models. Some are theory-driven, while others more data-driven. Most crime prediction models are global models, by constructing a single model for the entire study area. These models do not fully consider the spatial variations of crime and the built environment, as well as the varying relationship between crimes and the built environment. This paper aims to fill in this gap, using public property crime as an example to demonstrate that crime prediction models can be improved by incorporating the aforementioned spatial variations and spatially varying relationship. Firstly, according to the distribution of historical crime events and the distribution of past crime hotspots, the research area was divided into four subareas: stable high-heat grids, high-heat grids, even-hot grids, and non-hot grids. Then, according to the social disorganization theory, routine activity theory, and crime pattern theory, the three covariates including the urban village, the road network, and POI (catering, entertainment and shopping malls as crime attractors and generators) were used as the covariates representing the surrounding built environment. The random forest prediction model also used historical crime data for training and validation. Different models were created for the whole study area and each of the four subareas. The results of 26 bi-week crime hotspot prediction experiments in 2017 were compared, showing that, after adding the three covariates representing the built environment, the prediction accuracy of the entire study area, stable high-heat grids, and high-heat grids were all improved. More importantly, the subarea models were substantially more accurate than the whole model. These findings strongly endorse that incorporating spatial differentiation of crime and the built environment plays a critical role in improving the performance of the prediction models. The majority of the hotspots coincide with commercial facilities that serve as crime generators or attractors. Thus, crime prevention and control should target urban villages and the areas where road densities are high. Further, the differences in subarea based models also suggest any crime fighting strategies should be adjusted to fit each local subarea, to achieve the greatest efficiency.
Complex spatial entities such as ocean eddies, circulation, and rainfall processes that can move produce much more complex movement data, namely, complex trajectories. Complex trajectories have nonlinear structures and bear at least one split and/or merger branch. To mine the motion pattern of such complex trajectories, this paper proposed a Spatial-Topological Similarity Measurement (STSM) method based on the topological structure and spatial characteristics of complex trajectories. The STSM method was inspired by the graph isomorphism algorithm VF2. Firstly, each complex trajectory was represented by a graph structure with nodes and edges, which integrates the spatial coordinates of trajectory points into node attributes. By matching all maximal common substructures between the complex trajectories, one-to-one correspondence among the nodes in the matching structure was determined, The weighted Euclidean distance was then used to calculate the spatial similarity between points in the matched structure of the complex trajectories. Secondly, the average-linkage agglomerative hierarchical clustering analysis was carried out based on the proposed STSM algorithm, aiming at discovering any spatial clustering pattern of similar topological structures between complex trajectories. Finally, the effectiveness of the proposed method was verified by using the long-time series of the complex trajectories of cyclonic eddies in the South China Sea (SCS) from 1993 to 2016. The topological structure similarity algorithm CSM (Comprehensive Structure Matching) for complex trajectories was also compared and analyzed. Results show that clustering analysis based on the CSM algorithm can not fully mine spatial aggregation patterns of the cyclonic eddy complex trajectories, because complex trajectories with similar topological structures could exist in different regions. The STSM algorithm classified the complex trajectories of cyclonic eddies in the SCS into five clusters. Cluster 1 was in the north of the SCS, cluster 2 was in the central part of the SCS, and the other three clusters were interlaced in the south of the SCS. To a certain extent, this aggregation model not only reflected the differences of the formation and evolution of cyclonic eddies in the northern, central, and southern SCS, but also indicated that the movement of cyclonic eddies in the southern SCS had more complex heterogeneity than other regions of the SCS. Our findings suggest that the proposed method STSM can help discover effectively from the complex trajectory data the potential aggregation patterns of evolution processes, and provide a new method for revealing the spatiotemporal characteristics of such complex dynamic phenomena.
In China, floods are considered the most frequent natural disaster that can cause serious damages to the safety of human beings and severe economic losses. We chose Jiangxi Province as the study area, which frequently suffered from mountain torrents. According to the conceptual model of flood risk, 12 flood risk assessment indexes were selected from three aspects: trigger factor, hazard inducing environment, and hazard bearing agent. Three models of flood risk assessment were constructed using different machine learning algorithms, including k-Nearest Neighbor (kNN), Random Forest (RF), and AdaBoost. To evaluate the models' performances, we applied three quantitative performance indexes: accuracy, Kappa coefficient, and the ROC curve (AUC value). We analyzed the importance of indexes based on Random Forest algorithm and the feature extraction algorithm of Boruta. Then, the zoning maps of mountain flood risk drawn by the three models were used to compare and analyze the pattern of mountain flood disasters. According to the outcomes of the performance analysis, the average values of accuracy, Kappa coefficient, and AUC of the AdaBoost model were 0.902, 0.870, and 0.826, respectively. The accuracy and Kappa coefficient were slightly higher than RF, the AUC value was equivalent to RF. The three performance indexes of the kNN model were all lower than those of the other two. Our findings suggest that five indexes play very important roles in the formation of the final flood disaster risk, including potential farmland productivity, average annual maximum rainstorm within six hours, average annual maximum rainstorm within one hour, NDVI, and average annual rainfall. Our mapping results show that the areas of higher and highest risk zones account for 34.4% of Jiangxi Province. The regions with higher and highest risk are mainly distributed in the vicinity of mountains with high rainfall, heavy rainstorm, and high potential of farmland production.
Efficient calculation of satellite ground coverage time window can guarantee the management and application of remote sensing satellite data. To solve the problem that existing algorithms for calculating the satellite ground coverage time window cannot provide real-time online service, which needs to guarantee the accuracy, efficiency and timeliness simultaneously, a real-time calculation service for satellite ground coverage time window was proposed in the present study. Based on the common calculation algorithm, the extended bounding box of ground area was established by extending a certain angle in four directions. By judging the spatial relationship between the sub-satellite point and the extended bounding box of ground area, whether the satellite ground coverage area should be calculated precisely was determined. If the sub-satellite point and the extended bounding box of the ground area were disjoint, there was no need to calculate the satellite ground coverage area, which avoids a large number of redundant calculation. Otherwise, the satellite ground coverage area was calculated and the spatial relationship between them was obtained. When the spatial relationship between the satellite ground coverage area and the ground area changed, there existed the start or stop time point of the satellite ground coverage time window, and two kinds of time steps were used to improve the calculation efficiency and accuracy of the time window. Finally, the distributed streaming calculation framework was used to build the real-time online service based on the proposed algorithm, and the topology of data processing was established to implement the algorithm. In the streaming calculation framework, the calculation processes of the satellite ground coverage time window are segmented and each result is integrated after the calculation processes are completed. The final calculation results can be stored in the database or used by different applications. Compared with the tracking propagation algorithm used by business software, our findings from the experimental results suggest that the difference between the proposed method and the business software is small, all of which are less than 1s, and that the real-time calculation service can ensure the accuracy, efficiency, and timeliness. Contrasting to the common tracking propagation algorithm, the real-time calculation service takes less time with an acceleration ratio of over 8 times. The proposed real-time calculation service can meet the requirements for calculating satellite ground coverage time window in terms of accuracy, efficiency, and timeliness in different scenarios.
Measurement of the relationship between home-work separation and commuting distance is a guide to public policy and urban planning. However, the reliability and accuracy of calculation and validation have various limitations in this filed. The widely used home-work ratio based on space units has the scaling and boundary limitations. This study reexamined the relationship using accurate population and economic census data and mobile phone signaling data of Shanghai. A home-work balance region was defined firstly in the central city. The expected housing density of workers was estimated from working locations by using density estimation function and then compared with the actual data. The relationship was established from home-work separation to commuting distance. The scaling and boundary limitations can be reduced by this method. Using the home-work separation zero-one index to verify the separation degree based on average commuting distance which presents a strong linear correlation. Although the result is significant, there are still outliers to the regression equation. The reason of the home-work mismatch of the outliers was explained based on experience, which improved criterion dependability qualitatively. Using the above-mentioned methods, we conclude that workers commute longer and residents commute shorter in job-rich areas, contrasting to the opposite results in housing-rich areas. The areas have less total commuting distance with more balanced home-work index, while have more total commuting distance with more separate index. The methods were proved effective in the case of Shanghai and can be applied to the central regions of other metropolises.
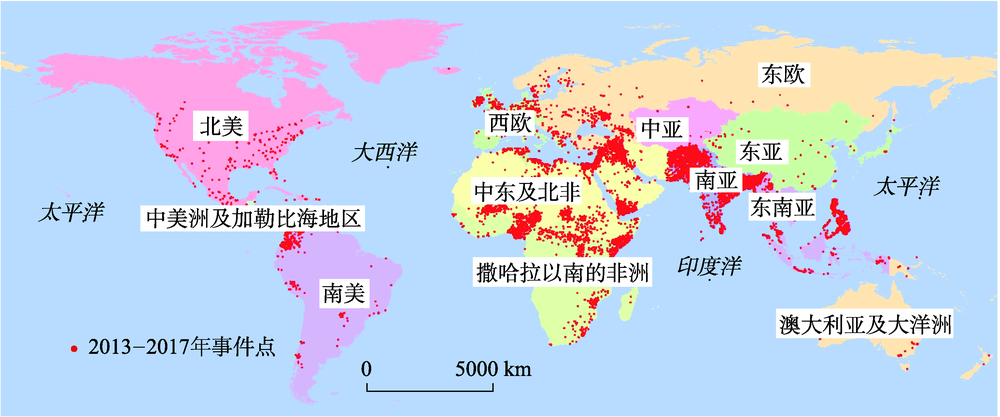
Terrorist attack is violent and destructive, resulting in casualties and property losses; it also involves social unrests, causing significant psychological pressure and hindering normal economic development. The data of this paper came from the global terrorism database, spanning from 2013 to 2017. GIS technology and the statistical theory were used to process and analyze the data of global terrorist attacks, and to analyze the spatial evolution of global terrorist attacks and the overall situation. The attributes selected for the data processing include latitude and longitude, regional information, casualties, etc., which were used for the hotspot analysis of casualties, hierarchical clustering of regional event frequency, and the time and space of global terrorist attacks. The evolution characteristics and situation were analyzed and studied. The spatial distribution and changes of the global high-injury hotspots in the five years were discussed, and the frequency of attacks in different regions was counted and the severity of incidents was classified. Specifically, based on the number of casualties, we used the ArcGIS software to draw the 2013-2017 casualty hotspot map and cold spot map to analyze the spatial trend of terrorism, and used the SPSS software to draw hierarchical clustering pedigree maps for regions of different severity levels. Results show: (1) In the 5 years, the number of casualties reached 202 099 in 2014, and then decreased year by year; the frequency of attacks showed a jagged pattern of “maniac-governance-convergence-no governance-again mania”. (2) The Middle East and North Africa regions were the main sources of terrorist attacks and also the hot spots with high casualties. The average annual casualties accounted for about 49% of the world's total, and the frequency of incidents accounted for about 40%, while the number of casualties in South Asia wass about 22.8%, the attack frequency was about 31.1%, followed by sub-Saharan Africa. By contrast, Southeast Asia, Western Europe, Eastern Europe, and South America were the emerging areas of active terrorism. (3) Global terrorism in general centered on the border area of the Middle East, North Africa, and sub-Saharan Africa, and gradually spreaded to South Asia, Southeast Asia, and Western Europe. Our findings can inform the decision-makers of anti-terrorism organizations to help enhance global security.
Snow accumulation is an important freshwater resource to alleviate the current situation of water stress; however, disasters may also happen when there is too much snow. Therefore, snowfall must be monitored. To extract the strong snowfall areas, a snow distribution model was constructed in this paper. MODIS products (MOD10A1) in the past 20 years from 2000 to 2018 were used as the main input data, and the digital elevation model (DEM) of Shandong Peninsula and meteorological data(e.g., precipitation and wind direction) were used as the auxiliary data. The model worked well in distinguishing strong and weak snowfall areas in Shandong Peninsula. Based on the snow covers information that was extracted by the snow distribution model, the spatiotemporal distribution characteristics were statistically analyzed. We found: (1) It can effectively construct the spatial distribution model of snow cover in Shandong Peninsula using the NDSI values accumulated over many years of snow and DEM data. and The boundary between strong and weak snowfall areas was successfully extracted using this model, and heavy snowfall areas covered 79.78% of the research area where the accumulated NDSI was above 150; (2) The spatial distribution of snow cover on the Shandong Peninsula is spatially uneven, which is generally characterized by rich snow on northeast and east, and less snow in south and west regions of Shandong Peninsula. There was more snow at the north side of mountains 150 m above sea level, and there was less snowfall in the south of mountains. Based on the boundary line between the Bohai Sea, Yellow Sea, and Shandong Peninsula, there was more snowfall within 39.1 km offshore distance. There was a correlation between snowfall areas and wind direction, and northerly winds were more likely to cause heavy snowfall. (3) The amount of snowfall in the Shandong Peninsula varied from 3 to 5 years in a cycle, there was a large snowfall every 3-5 years. But there was uncertainty in the snowfall areas, not all areas had strong snowfall. There was also a difference in the snowfall in each month, snowfall was mainly concentrated in December, and snowfall formed a small peak in late January of the following year. Our findings reveal the spatiotemporal distribution characteristics of long-term sequences and extraction methods of the snowfall in Shandong Peninsula, and indicate the cause of the snowfall. This study can helpin collecting fresh water resources and alleviating water stress and disaster prevention.
The influence of factors on regional economic disparity has always been the focus and a hot issue of scholars at home and abroad. Exploring the dominant influencing factors of the spatiotemporal evolution of county economies and scientifically revealing the mechanism of each factor will provide an important guiding basis for formulating regional economic development strategies. The present paper took the counties of Gansu Province as the research units, and analyzed the spatial differentiation of the county economies by standard deviation ellipse, and examined the factors affecting the spatiotemporal differentiation of the county economies by multivariate linear stepwise regression and geographic detectors. The results show that: (1) The overall difference was obvious between the county economies of Gansu Province, and it fluctuated greatly with time; (2) The spatial distribution of the county economy was unstable and had a large change; (3) fiscal revenue, urbanization rate, and industrial proportion were the main time impact factors of time evolution differentiation; (4) railway density, highway density, river density were the main geographical influence factors of spatial differentiation of the county economies of Gansu Province, and the interaction between two factors was stronger than the effect of one single factor on the economic spatial differentiation. Our findings suggest that, in the process of coordinating county-level economic development, the development strategy should be accurately implemented according to the main influencing factors, and that the interactions between factors should be rationally utilized to accelerate the coordinated development.
In order to prevent the excessive construction of commercial complexes and form vicious competition among commercial complexes. In this paper, based on urban thermographic data from the Wechat Easy Travel Plug-in, this study, with five commercial complexes in Hangzhou as an example, obtained quantifiable thermal data and conducted comparative analysis on the influencing factors of different types of commercial complexes. Results show that influences on the vitality of commercial complexes are mainly from five factors, including the layout density of urban commercial complex, the function of surrounding cities, the sales mode, the function of internal space, and the efficiency of space used. Among them, high-density layout of commercial complexes has an inhibitory effect on the vitality. By comparing the changes of commercial complexes within each service radius, we found that the reasonable service radius of commercial complexes should be greater than 1 km. Urban functions such as residential areas, plazas, and parks have an enhanced effect on the vitality of commercial complexes. Urban and commercial functions have a weaker impact on the vitality of commercial complexes. Different sales models developed in combination with different consumer objects also have a significant impact on commercial complexes vitality. In areas where the public activity space is relatively lacking, commercial complexes with retail-oriented and urban public activity space are more prosperous than those with the main store-based complex, and commercial complexes with higher space utilization have higher vitality; the function of commercial complexes to partially serve as city public space improves the vitality.
Liupanshui is a city with very important ecological status and serious soil erosion in China. In recent years, Liupanshui has adopted a series of ecological construction projects, therefore, it is very important to quantitatively analyze soil erosion and its influencing factors. Based on the Revised Universal Soil Loss Equation (RUSLE) model and geographical detector method, we calculated the average soil erosion modulus of Liupanshui city during 1990-2015. We analyzed the changes of spatiotemporal patterns, and explored the quantitative analysis of the influencing factors of geographic detector, and spatial correlation analysis. Results show that: (1) The Average Soil Erosion Modulus (ASEM)of Liupanshui was 23.50 t·hm-2·a-1, with an average soil erosion amount of 1578.42×104 t·a-1. The micro and moderate erosion were the dominant erosion types, occupying 83.49% of the total area, while the strong and violent erosion accounted for only 5.3%. The strong erosion area in Liupanshui was mainly located at the junction of Beipanjiang River Basin and Nanpanjiang River Basin as well as the Karst areas with fragile eco-environment. (2) The ASEM was the largest in 2000, which increased by 5.50% compared with that in 1990. The ASEM in 2005 decreased by 18.2% compared with that in 2000. The ASEM in 2010 was the smallest, 11.4% lower than that in 2005. The ASEM in 2015 increased compared with that in 2010. The soil erosion intensity in Liupanshui city in 2000-2015 was weaker than that in 1990-2000. The area of violent erosion decreased, and the strong erosion shifted to micro, light and moderate erosion. (3) The vegetation coverage factor and the perennial average rainfall factor are important factors affecting the spatial distribution of regional soil erosion. Moreover, unused land, vegetation coverage less than 0.3, slope above 25° and rainfall between 1543~1593 mm are high-risk erosion areas. (4) Vegetation coverage and soil erosion have negative correlation in space, while rainfall factors have negative correlation and positive correlation in space. (5) Soil erosion improvement areas are mostly distributed in ecological engineering areas, so ecological engineering construction can improve soil erosion. Different ecological engineering protection priorities lead to different degree of soil erosion improvement. By simulating rainfall to calculate the soil erosion modulus and soil erosion amount before and after Grain-for-Green, it could be seen that the soil erosion situation in Liupanshui had improved after Grain-for-Green. Compared with cultivated land-forest land and cultivated land-grassland land use change area, Liupanshui city is more suitable to return cultivated land to forest. Implementation of the Grain-for-Green Project should be continued in Liupanshui city, and focus more on areas with complex topography and fragile eco-environment.
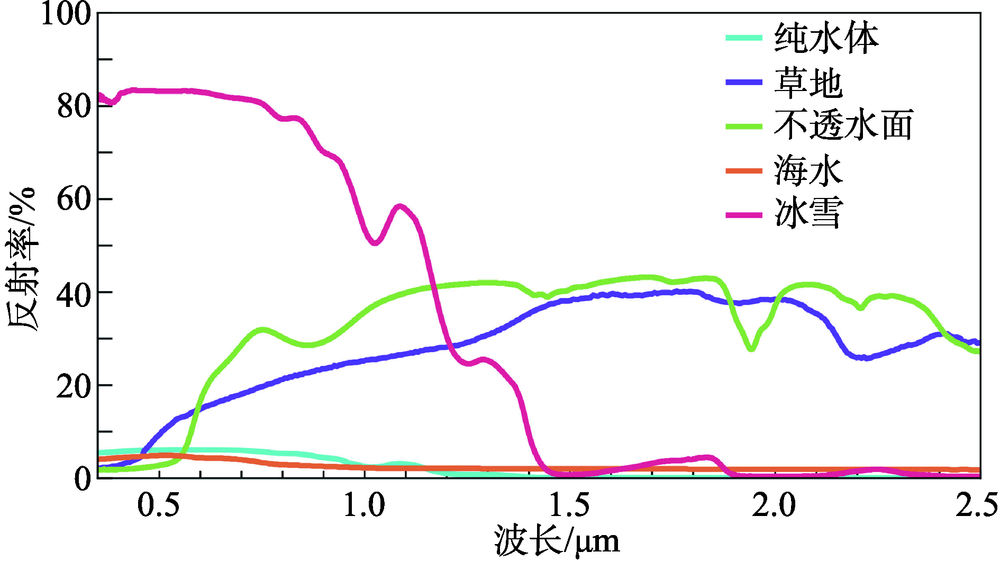
Open surface water bodies play important roles in industrial and agricultural production, climate regulation, and ecosystem maintenance. The spatial distributions of surface water bodies are always changing due to climate change and anthropogenic activities. Therefore, rapid and accurate monitoring of the spatiotemporal dynamics of surface water bodies is of great significance for water resources management and protection, as well as prediction of climate change. Remote sensing technology with the advantages of broader perspective, stronger timely effectiveness, larger information, and the ability of not affected by geographical environment provides a new way to monitor the dynamics of open surface water bodies over large extents, especially in remote and inaccessible mountain regions. The approach of the era of big earth data leads to the continuous improvements of water body mapping algorithms and increasing amounts of remote sensing data. However, there still lacks systematic review and evaluation about the evolution of relevant algorithms and data sources. In this context, based on the relevant literature ranging from the 1980s to 2018, this paper reviewed and assessed the existing algorithms and remote sensing data sources used in open surface water body mapping, and concluded the evolution processes of the common algorithms, such as single-band threshold approach, multi-band spectral relationship approach, spectral- and index-based approach, Support Vector Machine (SVM), Random Forest (RF), and Deep Learning (DL). Besides, we summarized the evolution of remote sensing data from coarse spatial resolutions (e.g. MODIS) to medium (e.g. Landsat) and high (e.g. GF-1/2) spatial resolutions. Furthermore, the different performances between these algorithms and data used in the studies of water body changes were analyzed. Also, we demonstrated the development of computing platforms from local computer to high performance cloud computing platforms such as Google Earth Engine (GEE) and Amazon Web Service (AWS), and highlighted typical cases that conduct retrospective and continuous monitoring of land cover changes over the global or regional scales. Then, we discussed the progress of studies focusing on the monitoring of open surface water body changes, from epoch-based analyses to interannual change analyses. Finally, we discussed the significance of the combined use of multi-source remote sensing data fusion and cloud computing platforms in the continuous monitoring of surface water body changes, and the uncertainties in detecting the different types of surface water bodies.
Automatic extraction of urban buildings has great importance in applications like urban planning and disaster prevention. In this regard, high-resolution remote sensing imagery contain sufficient information and are ideal data for precise extraction. Traditional approaches (excluding visual interpretation) demand researchers to manually design features to describe buildings and distinguishing them from other objects. Unfortunately, the complexity in high-resolution imagery makes these features fragile due to the change of sensors, imaging conditions, and locations. Recently, the convolutional neural networks, which succeeded in many visual applications including image segmentation, were used to extract buildings in high spatial resolution remote sensing imagery and achieved desirable results. However, convolutional neural networks still have much to improve regarding especially network architecture and loss functions. This paper proposed a convolutional neural network SE-Unet. It is based on U-Net architecture and employs squeeze-and-excitation modules in its encoder. The squeeze-and-excitation modules activate useful features and deactivate useless features in an adaptively weighted manner, which can remarkably increase network capacity with only a few extra parameters and memory cost. The decoder of SE-Unet concatenates corresponding features in the encoder to recover spatial information, as the U-Net does. Dice and cross-entropy loss function was applied to train the network and successfully alleviated the sample imbalance problem in building extraction. All experiments were performed on the Massachusetts building dataset for evaluation. Comparing to SegNet, LinkNet, U-Net, and other networks, SE-Unet showed the best results in all evaluation metrics, achieving 0.8704, 0.8496, 0.8599, and 0.9472 in terms of precision, recall, F1-score, and overall accuracy, respectively. Also, SE-Unet presented even better precision in extracting buildings that vary in size and shape. Our findings prove that squeeze-and-excitation modules can effectively strengthen network capability, and that dice and cross-entropy loss function can be useful in other sample imbalanced situations that involve high-resolution remote sensing imagery.
Glacier change monitoring is of great significance for ecological disaster prevention, regional water resource regulation, and climate change research. Based on glaciers' showing incoherence on radar interference imagery, 1998 ERS 1/2 and 2018 Sentinel-1A repeat orbit single-view complex SAR data were chosen to obtain the glacial boundary of the East Pamirs Plateau at the two periods, by taking the threshold of the coherence coefficient. The accuracy of the glacier boundary extraction was verified by Landsat TM/OLI and data published by GLMS, for further analysis of the glacier changes. Results show: (1) While fitting the curve relationship between the coherence coefficient γ and the number of corresponding pixels in the coherence coefficient diagram of the study area, the number of pixels in the glacial area accumulated in the low-value region of γ to form a small peak. The point where the first derivative of the curve becomes slower (the turning point of the transition from the glacier to the non-glacial region) was identified as the threshold point. The glacial boundary extracted by the SAR coherence coefficient threshold method was consistent with the result of the optical remote sensing imagery combined with the RGI6.0 data, suggesting that the proposed method based on SAR interference coherence coefficient for extracting the glacier boundary is feasible and effective. The glacier total area extraction accuracy of ERS 1/2 and Sentinel-1A was over 90%; moreover, SAR data can effectively extract glacier debris difficult to identify by optical remote sensing imagery. (2) The total area of glaciers on the East Pamirs Plateau decreased by 318.59 km 2 from 1998 to 2018, the annual average rate of change was -15.93 km 2/a, and the area of glacial retreat accounted for 23% of the total area of glaciers. (3) For large and medium-sized glaciers, the debris-covered glaciers retracted more than other glaciers. During the past 20 years, glaciers of all slopes have retreated. Glaciers in the southeast slopes retreated the most, and glaciers in the west slopes retreated the least. In 1998, glaciers concentrated in the 4519-5421 m altitude range; while in 2018, they concentrated in the 4682-5320 m altitude range. In the altitude range of 3325-5710 m, glaciers retreated obviously, and the maximum retraction value was at around 4915 m.
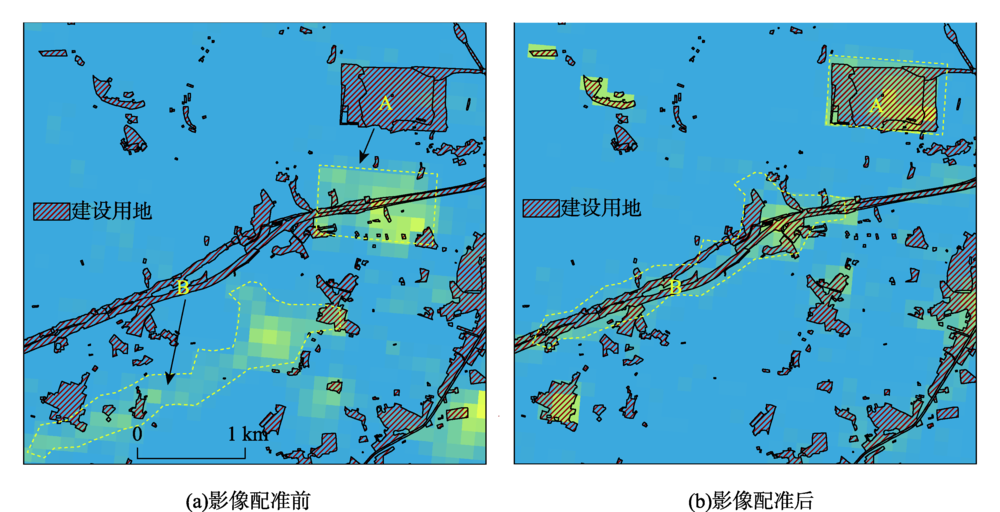
Nightlight data is closely related to human activities, which can be used for mapping construction land. For now, DMSP/OLS (Defense Meteorological Satellite Program, Operational Linescan System) and NPP-VIIRS (National Polar-orbiting Partnership, Visible Infrared Imaging Radiometer Suite) are the most widely-used data for construction land mapping. However, because of low data quality, the mapping results of these two kinds of data are not good enough. Luojia No.1 nightlight has an obvious quality improvement than existing nightlight data. Using Luojia No.1 nightlight data, we can map construction land more precisely. In this research, we first conducted georeferencing and radiometric correction to Luojia No.1 nightlight data to improve data quality further, then used the Support Vector Machine (SVM) classification method to map the construction land of Guangzhou in 2017 at the district level, and we used Kappa coefficient to check the mapping results. Results show that: (1) Better mapping results can be obtained by using Luojia No.1 nightlight data than the DMSP/OLS and NPP-VIIRS nightlight data. (2) Central districts like Haizhu and Tianhe's Kappa coefficients of mapping results are over 0.9. However, remote districts like Conghua and Nansha had relatively low Kappa coefficients of about 0.85. (3) Construction land like city, town, and airport had high Kappa coefficients usually over 0.9, because the nightlight emitted by these lands is easily to capture. In comparison, rural construction land’s single massif was small, and some sections of road and railway lacked lighting condition; thus, these lands are a little harder to recognize in the nightlight data. Correspondingly, their Kappa coefficients were about 0.85. Besides, land of the mining industry and scenic tourism seldom emit light at night, it is hard to identify these lands in Luojia No.1 nightlight data. Therefore, the Kappa coefficients of these lands are pretty low, about 0.45. Our findings suggest that Luojia No.1 nightlight data's great potential in mapping construction land.
In the context of global warming, drought has become increasingly frequent and have seriously jeopardized the safety of food production in China. Constructing an accurate drought monitoring model can not only reflect the occurrence of drought events in a timely manner, but also provide scientific support and guarantee for local governments to formulate measures for disaster reduction and production. Traditional meteorological monitoring methods may overestimate drought severity, because of the lack of information on vegetation requirements of water and soil water supply. However, most relevant remote sensing indicators also have the limitation of considering one single factor such as vegetation status or soil moisture. In addition, most of the existing comprehensive drought monitoring models use meteorological indicators as the dependent variables. On the one hand, more data materials and parameters for calculation are required. On the other hand, the accuracy of the model depends on the meteorological indicators' ability of responding to local agricultural drought. At the same time, the same meteorological indicators also have different adaptability in different regions, which causes limitations. Focusing on winter wheat in Henan Province, this study used the EOS-MODIS data products and meteorological station monitoring data from 2001 to 2011 to calculate the Standardized Precipitation Evapotranspiration Index (SPEI), Vegetation Condition Index (VCI), Temperature Condition Index (TCI), and the Temperature Vegetation Dryness Index (TVDI). Based on the records of agricultural meteorological disasters of winter wheat in Henan Province, an agricultural drought monitoring model was developed using the decision tree algorithm. Results show that the model which integrates atmospheric anomaly information, vegetation state information, and soil moisture information, is better than models that consider only individual indicators. Moreover, drought monitoring results of wheat based on the decision tree model reflect the actual drought situation and its spatial variation in Henan province from April to July in 2009. We conclude that the proposed method can be used to monitor agricultural droughts in Henan province.